Notebookcheck Logo

Qualcomm Snapdragon 8 Gen 2 for Galaxy vs Apple A12 Bionic

Qualcomm Snapdragon 8 Gen 2 for Galaxy

► remove from comparison Qualcomm SD 8 Gen 2 for Galaxy

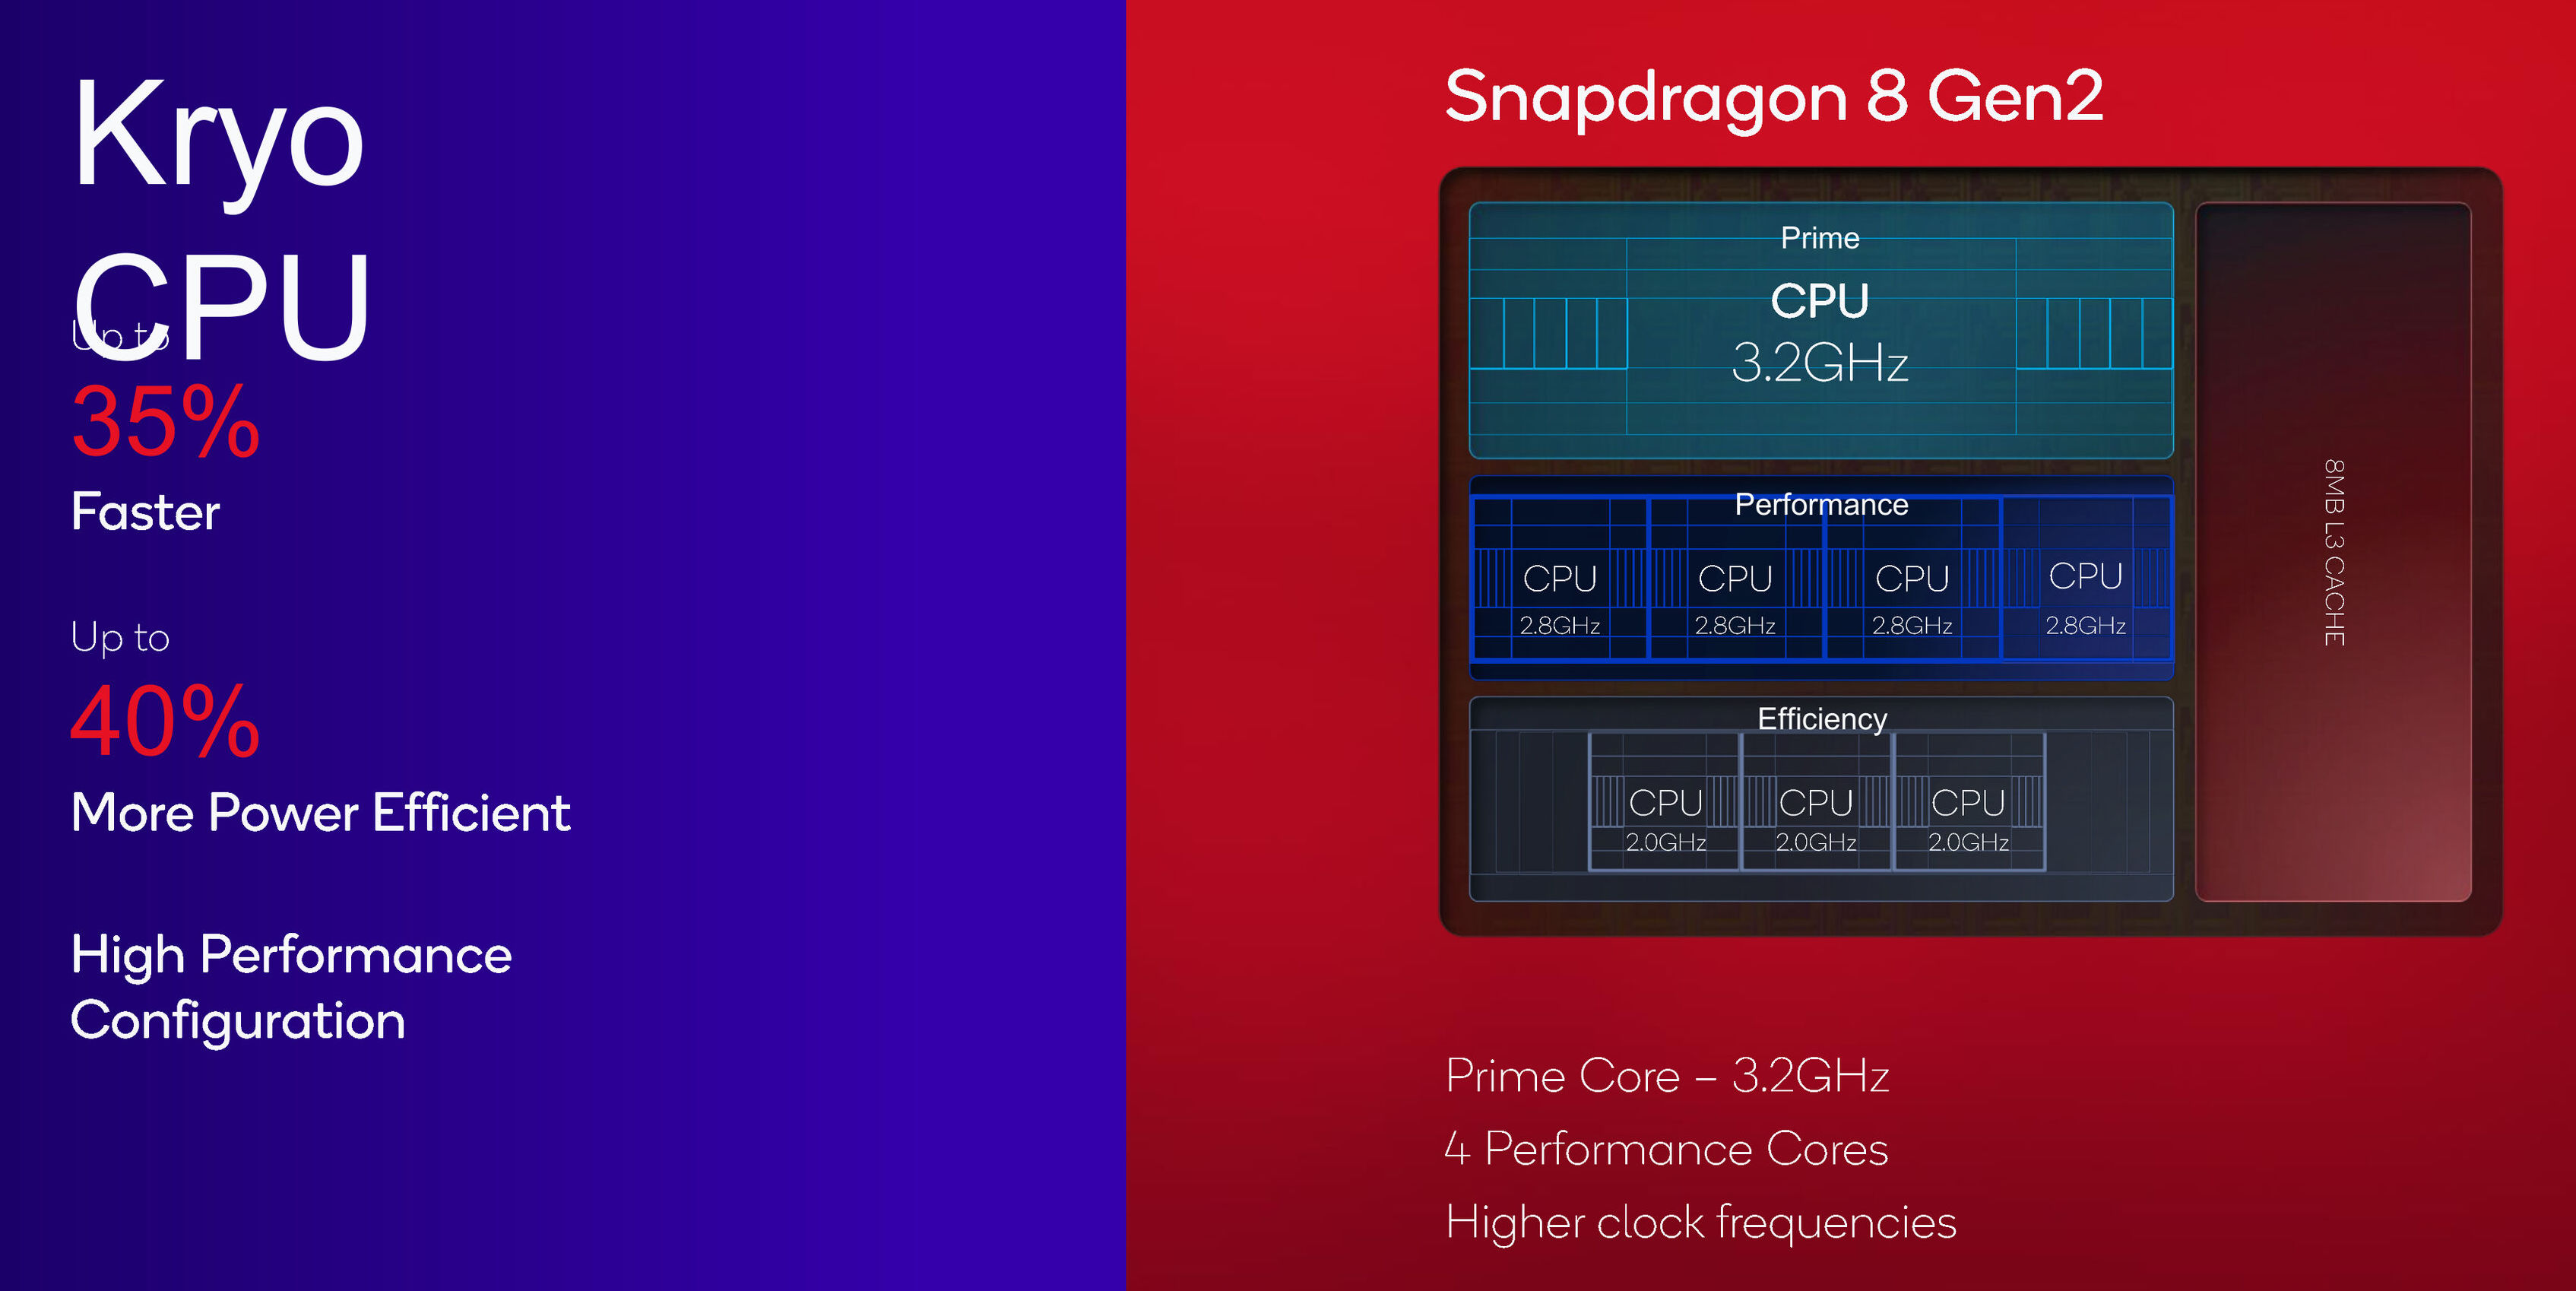
The Qualcomm Snapdragon 8 Gen 2 for Galaxy Mobile Platform is a high-end SoC for smartphones that was introduced in late 2022 and manufactured in 4 nm at TSMC (N4P). It integrates four different CPU clusters. A fast and big prime core based on the ARM Cortex-X3 architecture and clocked at up to 3.36 GHz for 64 bit applications. Two more ARM Cortex-A715 based performance cores clocked at up to 2.8 GHz (also only for 64 bit apps). Two more Cortex-A710 performance cores at up to 2.8 GHz that can also be used for older apps and three efficiency cores (ARM Cortex-A510 with up to 2 GHz). All cores can use the shared 8 MB level 3 cache. Compared to the normal SD 8 Gen 2, the "for Galaxy" version offers a 160 MHz higher clocked prime core.

Thanks to the new architecture and high clock rates, the SD 8 Gen 2 is the fastest mobile CPU for Android based devices and is only topped by current Apple SoCs like the Apple A16 (see benchmarks below).

The chip also integrates a Hexagon accelerator for AI workloads (tensor, scalar and vector). Qualcomm states that its one of the first chips with INT4 support and up to 4.35x performance compared to the previous generation. 

The 18-Bit-Spectra ISP is able to process photos with up to 200 MP and work with videos up to 8k30 (including 10-bit, HDR10+, HLG and Dolby Vision).

A big improvement of the Snapdragon 8 G2 is the integrated Adreno 740 GPU, that now supports Hardware Raytracing and tops even the iGPU in the Apple A16.

The integrated AI Engine can offer up to 4x faster AI performance thanks to the bigger Tensor engine. The 18-Bit-Spectra-ISP also saw some big improvements and is now called Snapdragon Sight.

The integrated Adreno 730 offers a 30% graphics boost compared to the previous Adreno 660.

The integrated Snapdragon X70 5G modem is also new as is the FastConnect 7800 modem with Wi-Fi 7 and Bluetooth 5.3 support.

Apple A12 Bionic

► remove from comparison Apple A12 Bionic

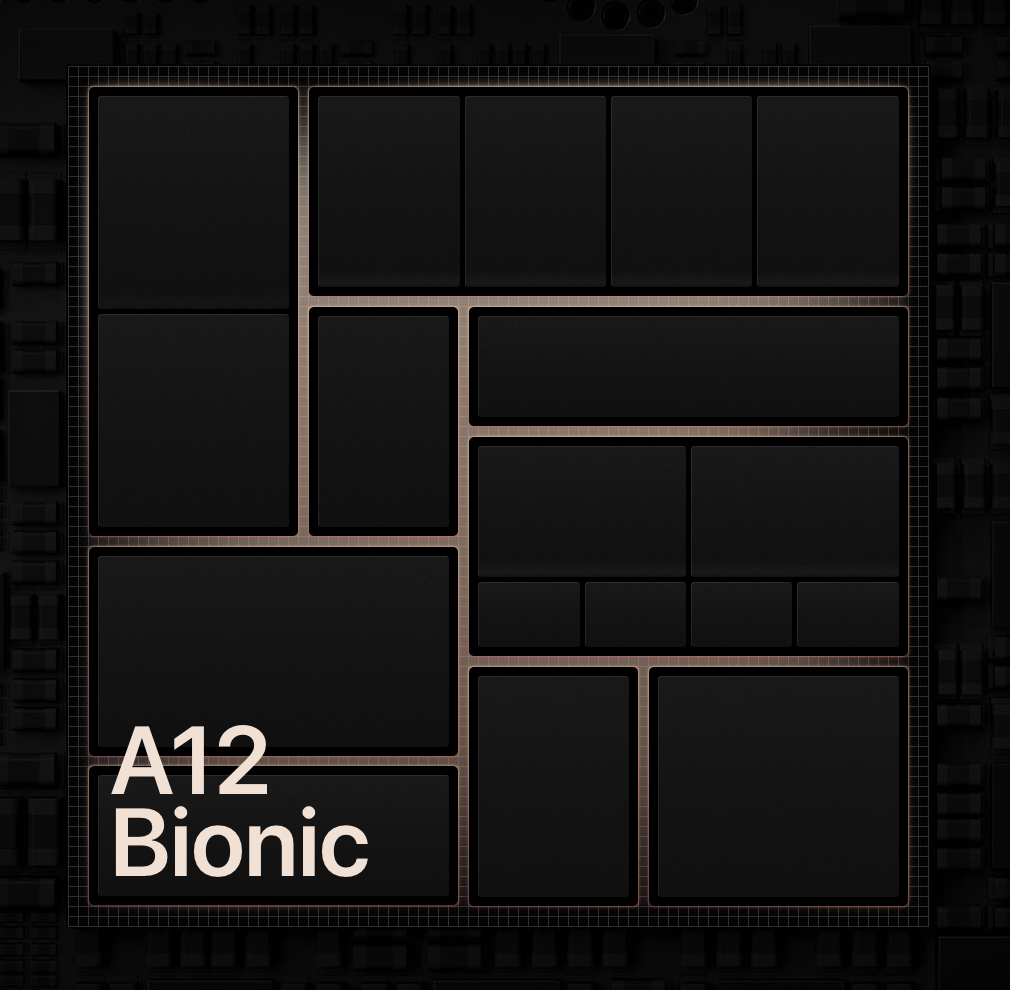
The Apple A12 Bionic is a System on a Chip (SoC) from Apple that is found in the iPhone Xs and Xr. It was announced late 2018 and offers 6 cores divided in 2 performance cores and four power efficiency cores. Compared to the previous A11 Bionic, the A12 should offer a 15% improved CPU performance for the performance cores and a 50% lower power consumption for the efficiency cores (both according to Apple).

The chip also includes a new GPU that is advertised as 50% faster, the M12 Motion co-processor and a Neural Engine with 8 cores for up to 5 trillion operations per second.

With 6.9 billion transistors, the A12 Bionic is a big chip especially compared to the Snapdragon 835 (3 Billion) or a Skylake desktop quad-core Soc (1.75 Billion). Compared to the A11, the A12 integrates 60% more transistors.

ModelQualcomm Snapdragon 8 Gen 2 for GalaxyApple A12 Bionic
SeriesQualcomm SnapdragonApple Apple A-Series
CodenameCortex-X3 / A715 / A710 / A510 (Kryo)
Series: Apple A-Series
Qualcomm Snapdragon 8 Gen 2 for Galaxy « 2 - 3.36 GHz8 / 8 cores8 MB L3
Qualcomm Snapdragon 8 Gen 2 compare2 - 3.2 GHz8 / 8 cores8 MB L3
Apple A15 Bionic compare2.02 - 3.23 GHz6 / 6 cores32 MB L3
Apple A12 Bionic « - 2.49 GHz6 / 6 cores
Clock2000 - 3360 MHz <=2490 MHz
L3 Cache8 MB
Cores / Threads8 / 8
1 x 3.4 GHz ARM Cortex-X3
2 x 2.8 GHz ARM Cortex-A715
2 x 2.8 GHz ARM Cortex-A710
3 x 2.0 GHz ARM Cortex-A510
6 / 6
Technology4 nm7 nm
FeaturesAdreno GPU, Spectra ISP, Hexagon, X70 5G Modem, FastConnect 7800 Wi-Fi 7, LPDDR5x 4200 MHz Memory ControllerARMv8 Instruction Set
iGPUQualcomm Adreno 740Apple A12 Bionic GPU
ArchitectureARM v9ARM
Announced
Manufacturerwww.qualcomm.com
L1 Cache256 KB
L2 Cache8 MB
Transistors6900 Million

Benchmarks

3DMark - 3DMark Ice Storm Unlimited Physics
min: 27400     avg: 27548     median: 27547 (23%)     max: 27717 Points
min: 1116     avg: 1118     median: 1117.5 (47%)     max: 1119 Points
min: 2772     avg: 2815     median: 2814.5 (5%)     max: 2857 Points
Geekbench 5.0 - Geekbench 5.0 64 Bit Single-Core
1118 Points (5%)
Geekbench 5.0 - Geekbench 5.0 64 Bit Multi-Core
2910 Points (9%)
Geekbench 4.4 - Geekbench 4.1 - 4.4 64 Bit Single-Core
min: 8370     avg: 8391     median: 8380 (84%)     max: 8424 Points
min: 4750     avg: 4779     median: 4774 (48%)     max: 4824 Points
Geekbench 4.4 - Geekbench 4.1 - 4.4 64 Bit Multi-Core
min: 21038     avg: 21162     median: 21209 (23%)     max: 21238 Points
min: 11244     avg: 11418     median: 11480 (13%)     max: 11598 Points
Geekbench 4.0 - Geekbench 4.0 64 Bit Single-Core
min: 6882     avg: 6950     median: 6949.5 (95%)     max: 7017 Points
Geekbench 4.0 - Geekbench 4.0 64 Bit Multi-Core
min: 19260     avg: 19271     median: 19270.5 (47%)     max: 19281 Points
Geekbench 3 - Geekbench 3 64 Bit Multi-Core
19117 Points (30%)
Geekbench 3 - Geekbench 3 64 Bit Single-Core
6624 Points (99%)
Mozilla Kraken 1.1 - Kraken 1.1 Total Score *
min: 634.3     avg: 795     median: 696.2 (1%)     max: 1532.5 ms
min: 603     avg: 627     median: 626.5 (1%)     max: 653 ms
Octane V2 - Octane V2 Total Score
min: 49582     avg: 59058     median: 60115 (53%)     max: 64715 Points
min: 41367     avg: 42312     median: 42333.5 (37%)     max: 43280 Points
WebXPRT 3 - WebXPRT 3 Score
min: 183     avg: 219     median: 231 (48%)     max: 243 Points
min: 155     avg: 159.5     median: 159.5 (33%)     max: 166 Points
AnTuTu v7 - AnTuTu v7 MEM
min: 7312     avg: 9998     median: 10135.5 (31%)     max: 12409 Points
AnTuTu v7 - AnTuTu v7 UX
min: 59570     avg: 65177     median: 66701 (82%)     max: 67735 Points
AnTuTu v7 - AnTuTu v7 GPU
min: 129473     avg: 147840     median: 151931 (47%)     max: 158023 Points
AnTuTu v7 - AnTuTu v7 CPU
min: 106600     avg: 124761     median: 127986 (78%)     max: 136472 Points
AnTuTu v7 - AnTuTu v7 Total Score
min: 302955     avg: 347775     median: 358800 (63%)     max: 370545 Points
AnTuTu v8 - AnTuTu v8 UX
min: 71574     avg: 71607     median: 71606.5 (60%)     max: 71639 Points
AnTuTu v8 - AnTuTu v8 MEM
min: 45962     avg: 56767     median: 56767 (46%)     max: 67572 Points
AnTuTu v8 - AnTuTu v8 GPU
min: 166588     avg: 170290     median: 170290 (31%)     max: 173992 Points
AnTuTu v8 - AnTuTu v8 CPU
min: 98561     avg: 122385     median: 122385 (44%)     max: 146209 Points
AnTuTu v8 - AnTuTu v8 Total Score
min: 411764     avg: 421049     median: 421048 (41%)     max: 430333 Points
549549 Points (33%)
129427 Points (35%)
PassMark PerformanceTest Mobile V1 - PerformanceTest Mobile V1 CPU Tests
min: 482773     avg: 486852     median: 486197 (64%)     max: 491585 Points
PCMark for Android - PCM f. Android Storage 2.0 random write internal
85.7 MB/s (63%)
PCMark for Android - PCM f. Android Storage 2.0 seq write internal
2081 MB/s (64%)
PCMark for Android - PCM f. Android Storage 2.0 random read internal
50.9 MB/s (62%)
PCMark for Android - PCM f. Android Storage 2.0 seq read internal
2371 MB/s (66%)
PCMark for Android - PCM f. Android Storage 2.0 score
min: 35786     avg: 42805     median: 41063 (65%)     max: 48832 Points

Average Benchmarks Qualcomm Snapdragon 8 Gen 2 for Galaxy → 100% n=11

Average Benchmarks Apple A12 Bionic → 62% n=11

- Range of benchmark values for this graphics card
- Average benchmark values for this graphics card
* Smaller numbers mean a higher performance
1 This benchmark is not used for the average calculation

Add one or more devices and compare

In the following list you can select (and also search for) devices that should be added to the comparison. You can select more than one device.

restrict list:

show all (including archived), 2024, 2023
v1.28
log 30. 02:35:48

#0 checking url part for id 14990 +0s ... 0s

#1 checking url part for id 10166 +0s ... 0s

#2 redirected to Ajax server, took 1719707748 +0s ... 0s

#3 did not recreate cache, as it is less than 5 days old! Created at Fri, 28 Jun 2024 05:15:21 +0200 +0s ... 0s

#4 composed specs +0.006s ... 0.006s

#5 did output specs +0s ... 0.006s

#6 getting avg benchmarks for device 14990 +0.001s ... 0.007s

#7 got single benchmarks 14990 +0.011s ... 0.017s

#8 getting avg benchmarks for device 10166 +0.001s ... 0.018s

#9 got single benchmarks 10166 +0.006s ... 0.024s

#10 got avg benchmarks for devices +0s ... 0.024s

#11 min, max, avg, median took s +0.024s ... 0.048s

#12 return log +0.003s ... 0.051s

Please share our article, every link counts!
> Expert Reviews and News on Laptops, Smartphones and Tech Innovations > Benchmarks / Tech > Processor Comparison - Head 2 Head
Redaktion, 2017-09- 8 (Update: 2023-07- 1)