Notebookcheck Logo

Qualcomm Snapdragon 8+ Gen 1 vs AMD Ryzen 5 6600U

Qualcomm Snapdragon 8+ Gen 1

► remove from comparison Qualcomm SD 8+ Gen 1

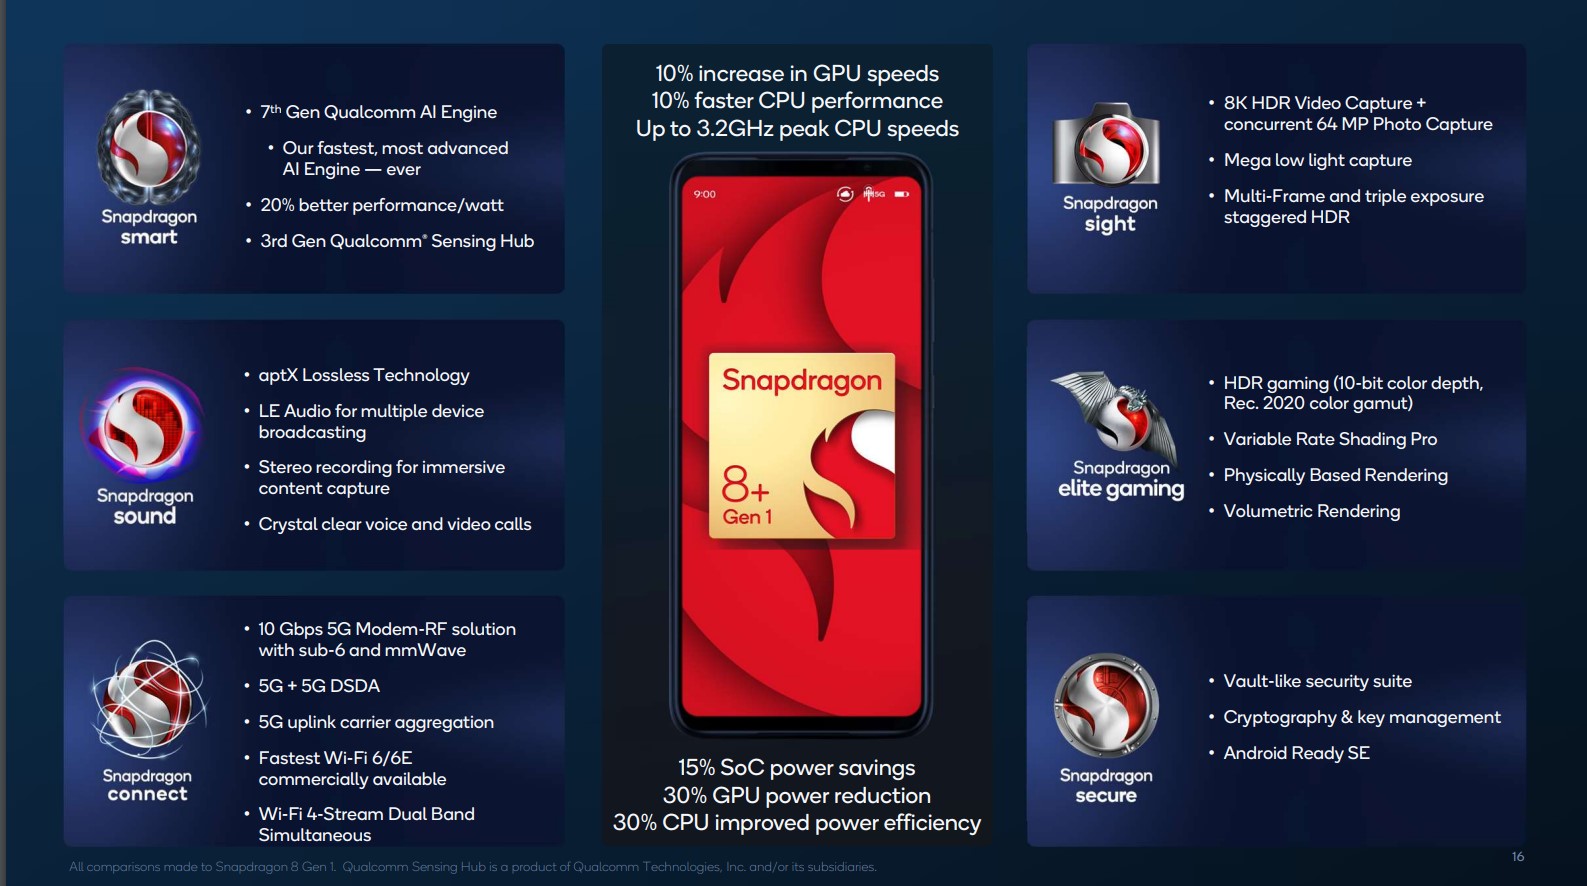
The Qualcomm Snapdragon 8+ Gen 1 Mobile Platform is a high-end SoC for smartphones that was introduced in mid 2022 and manufactured in 4 nm at TSMC. It integrates one “Prime Core” based on a ARM Cortex-X2 architecture clocked at up to 3.2 GHz. Three more performance cores are based on the Cortex-A710 but clocked up to 2.5 GHz. Furthermore, four energy saving cores are integrated that are based on the ARM Cortex-A510 architecture and clocked at up to 1.8 GHz. All cores can use the shared 6 MB level 3 cache.

Compared to the Snapdragon 8 Gen 1, the SoC is now produced in the more power efficient 4nm process at TSMC and offers higher clocked CPU and GPU cores (at a lower power consumption according to Qualcomm).

The integrated AI Engine can offer up to 4x faster AI performance thanks to the bigger Tensor engine. The 18-Bit-Spectra-ISP also saw some big improvements and is now called Snapdragon Sight.

The integrated Adreno 730 offers a 30% graphics boost compared to the previous Adreno 660.

The integrated Snapdragon X65 5G modem is also new and offers faster transfer rates (up to 10 Gbps download and 3 Gbps upload). The FastConnect 6900 offers support for the current Wifi 6E and Bluetooth 5.2.

AMD Ryzen 5 6600U

► remove from comparison AMD R5 6600U

The AMD Ryzen 5 6600U is a processor for thin and light laptops based of the Rembrandt generation. The Ryzen packs six of the eight cores based on the Zen 3+ microarchitecture. They are clocked at 2.9 (guaranteed base clock) to 4.5 GHz (Turbo) and support SMT / Hyperthreading (12 threads). The chip is manufactured on the modern 6 nm process at TSMC. Compared to the similar R5 6600H, the 6600U offers a lower base clock speed and a lower TDP.

In the 6000 series, AMD finally switched to the current RDNA 2 graphics architecture for the iGPU. The 6600U only offers the small Radeon 660M with 6 of the 12 CUs enabled and 1.9 GHz max. clock rate.

The new Zen 3+ is a refresh of the Zen 3 architecture and should not offer a lot of changes. The chip itself however, offers a lot of new features, like support for USB 4 (40 Gbps), PCI-E Gen 4, DDR5-4800MT/s or LPDDR5-6400MT/s, WiFi 6E, Bluetooth LE 5.2, DisplayPort 2, and AV1 decode.

Performance

The average 6600U in our database matches the Ryzen 7 5800U in multi-thread performance, making this Ryzen 5 series chip a great CPU for most activities as of mid 2023.

Your mileage may vary depending on how competent the cooling solution of your system is and how high the CPU power limits are.

Power consumption

This Ryzen 5 series chip has a default TDP, also known as the long-term power limit, of 15 W to 28 W, the expectation being that laptop makers will go for a higher value in exchange for higher performance. Either way, that's too much to allow for passively cooled designs.

The R5 6600U is manufactured on TSMC's 6 nm manufacturing process for good, as of mid 2023, energy efficiency.

ModelQualcomm Snapdragon 8+ Gen 1AMD Ryzen 5 6600U
SeriesQualcomm SnapdragonAMD Rembrandt (Zen 3+)
CodenameCortex-X2 / A710 / A510 (Kryo) WaipioRembrandt-U (Zen 3+)
Series: Rembrandt (Zen 3+) Rembrandt-U (Zen 3+)
Qualcomm Snapdragon 8+ Gen 1 « 1.8 - 3.2 GHz8 / 8 cores6 MB L3
Qualcomm Snapdragon 8 Gen 1 compare1.8 - 3 GHz8 / 8 cores6 MB L3
AMD Ryzen 7 6800U compare2.7 - 4.7 GHz8 / 16 cores16 MB L3
AMD Ryzen 5 6600U « 2.9 - 4.5 GHz6 / 12 cores16 MB L3
Clock1800 - 3200 MHz2900 - 4500 MHz
L3 Cache6 MB16 MB
Cores / Threads8 / 86 / 12
Technology4 nm6 nm
FeaturesAdreno 730 GPU, Spectra ISP, Hexagon, X65 5G Modem, FastConnect 6900 WiFi, LPDDR5-6400 Memory ControllerDDR5-4800/LPDDR5-6400 RAM (incl. ECC), PCIe 4, MMX, SSE, SSE2, SSE3, SSSE3, SSE4A, SSE4.1, SSE4.2, AVX, AVX2, BMI2, ABM, FMA, ADX, SMEP, SMAP, SMT, CPB, AES-NI, RDRAND, RDSEED, SHA, SME
iGPUQualcomm Adreno 730AMD Radeon 660M ( - 1900 MHz)
ArchitectureARM v9x86
Announced
Manufacturerwww.qualcomm.comwww.amd.com
L1 Cache384 KB
L2 Cache3 MB
TDP28 Watt
max. Temp.95 °C
SocketFP7/FP7r2

Benchmarks

Performance Rating - CB R15 + R20 + 7-Zip + X265 + Blender + 3DM11 CPU - R5 6600U
37.8 pt (52%)
AMD Ryzen 5 6600U
37.8
max:
72.1 91%
0%
100%
Cinebench 2024 - Cinebench 2024 CPU Single Core
80 Points (56%)
Cinebench 2024 - Cinebench 2024 CPU Multi Core
408 Points (8%)
Cinebench R23 - Cinebench R23 Multi Core
min: 8491     avg: 9160     median: 9159.5 (9%)     max: 9828 Points
Cinebench R23 - Cinebench R23 Single Core
min: 1420     avg: 1457     median: 1456.5 (62%)     max: 1493 Points
Cinebench R20 - Cinebench R20 CPU (Single Core)
min: 558     avg: 570     median: 570 (63%)     max: 582 Points
Cinebench R20 - Cinebench R20 CPU (Multi Core)
min: 3419     avg: 3623     median: 3623 (9%)     max: 3827 Points
Cinebench R15 - Cinebench R15 CPU Multi 64 Bit
min: 1361     avg: 1493     median: 1493 (9%)     max: 1625 Points
Cinebench R15 - Cinebench R15 CPU Single 64 Bit
min: 227     avg: 233     median: 233 (70%)     max: 239 Points
Cinebench R11.5 - Cinebench R11.5 CPU Multi 64 Bit
17.2 Points (22%)
Cinebench R11.5 - Cinebench R11.5 CPU Single 64 Bit
2.7 Points (68%)
Cinebench R10 - Cinebench R10 Rend. Single (32bit)
6242 Points (38%)
Cinebench R10 - Cinebench R10 Rend. Multi (32bit)
32097 Points (23%)
Cinebench R10 - Cinebench R10 Rend. Multi (64bit)
54792 Points (38%)
Cinebench R10 - Cinebench R10 Rend. Single (64bit)
11685 Points (14%)
wPrime 2.10 - wPrime 2.0 1024m *
146.6 s (2%)
wPrime 2.10 - wPrime 2.0 32m *
4.7 s (1%)
WinRAR - WinRAR 4.0
6937 Points (11%)
7-Zip 18.03 - 7-Zip 18.03 Multli Thread 4 runs
44320 MIPS (25%)
7-Zip 18.03 - 7-Zip 18.03 Single Thread 4 runs
5486 MIPS (66%)
X264 HD Benchmark 4.0 - x264 Pass 2
71.5 fps (25%)
X264 HD Benchmark 4.0 - x264 Pass 1
212 fps (49%)
HWBOT x265 Benchmark v2.2 - HWBOT x265 4k Preset
11.7 fps (21%)
TrueCrypt - TrueCrypt Serpent
0.9 GB/s (0%)
TrueCrypt - TrueCrypt Twofish
1.3 GB/s (22%)
TrueCrypt - TrueCrypt AES
9.3 GB/s (24%)
Blender - Blender 3.3 Classroom CPU *
min: 323     avg: 488.5     median: 488.5 (6%)     max: 654 Seconds
Blender - Blender 2.79 BMW27 CPU *
415 Seconds (3%)
R Benchmark 2.5 - R Benchmark 2.5 *
0.5 sec (11%)
3DMark 06 - CPU - 3DMark 06 - CPU
min: 9435     avg: 9908     median: 9908 (21%)     max: 10381 Points
Super Pi mod 1.5 XS 1M - Super Pi mod 1.5 XS 1M *
8.1 s (2%)
Super Pi mod 1.5 XS 2M - Super Pi mod 1.5 XS 2M *
19.9 s (1%)
Super Pi Mod 1.5 XS 32M - Super Pi mod 1.5 XS 32M *
692 s (3%)
3DMark Vantage - 3DM Vant. Perf. CPU no Physx
min: 38061     avg: 41628     median: 41627.5 (36%)     max: 45194 Points
3DMark 11 - 3DM11 Performance Physics
min: 11630     avg: 12171     median: 12171 (33%)     max: 12712 Points
3DMark - 3DMark Ice Storm Physics
min: 65694     avg: 66719     median: 66719 (54%)     max: 67744 Points
3DMark - 3DMark Ice Storm Extreme Physics
min: 66512     avg: 67032     median: 67032 (54%)     max: 67552 Points
3DMark - 3DMark Ice Storm Unlimited Physics
min: 66942     avg: 70708     median: 70708 (60%)     max: 74474 Points
3DMark - 3DMark Cloud Gate Physics
min: 10347     avg: 10513     median: 10513 (27%)     max: 10679 Points
3DMark - 3DMark Fire Strike Standard Physics
min: 15902     avg: 15918     median: 15918 (28%)     max: 15934 Points
3DMark - 3DMark Time Spy CPU
min: 5114     avg: 5340     median: 5339.5 (23%)     max: 5565 Points
Geekbench 6.2 - Geekbench 6.2 Single-Core
min: 1530     avg: 1719     median: 1741 (47%)     max: 1806 Points
1977 Points (53%)
Geekbench 6.2 - Geekbench 6.2 Multi-Core
min: 4140     avg: 4483     median: 4584 (18%)     max: 4690 Points
8310 Points (33%)
min: 1445     avg: 1477     median: 1483 (63%)     max: 1504 Points
min: 7034     avg: 7407     median: 7529 (13%)     max: 7658 Points
Geekbench 5.0 - Geekbench 5.0 64 Bit Single-Core
min: 1405     avg: 1481     median: 1481 (6%)     max: 1557 Points
Geekbench 5.0 - Geekbench 5.0 64 Bit Multi-Core
min: 6956     avg: 8603     median: 8602.5 (27%)     max: 10249 Points
min: 6067     avg: 6383     median: 6382.5 (64%)     max: 6698 Points
Geekbench 4.4 - Geekbench 4.1 - 4.4 64 Bit Multi-Core
min: 16273     avg: 17467     median: 17569.5 (19%)     max: 18976 Points
min: 26824     avg: 33338     median: 33338 (37%)     max: 39852 Points
Geekbench 3 - Geekbench 3 64 Bit Multi-Core
15884 Points (25%)
7529 Points (12%)
Geekbench 3 - Geekbench 3 64 Bit Single-Core
6109 Points (91%)
1483 Points (22%)
Mozilla Kraken 1.1 - Kraken 1.1 Total Score *
min: 728.6     avg: 1047     median: 982.6 (1%)     max: 1706.5 ms
619 ms (1%)
Sunspider - Sunspider 1.0 Total Score *
190.4 ms (2%)
Octane V2 - Octane V2 Total Score
min: 17622     avg: 41373     median: 39564 (35%)     max: 55611 Points
WebXPRT 4 - WebXPRT 4 Score
min: 69     avg: 111     median: 101 (29%)     max: 159 Points
217 Points (62%)
WebXPRT 3 - WebXPRT 3 Score
min: 106     avg: 159.4     median: 156.5 (33%)     max: 224 Points
274 Points (57%)
PCMark for Android - PCM f. Android Storage 2.0 random write internal
55.5 MB/s (41%)
PCMark for Android - PCM f. Android Storage 2.0 seq write internal
1504 MB/s (46%)
PCMark for Android - PCM f. Android Storage 2.0 random read internal
37.6 MB/s (46%)
PCMark for Android - PCM f. Android Storage 2.0 seq read internal
1588 MB/s (44%)
PCMark for Android - PCM f. Android Storage 2.0 score
min: 27865     avg: 33338     median: 33344.5 (53%)     max: 37845 Points
1517 Points (58%)
Power Consumption - Prime95 Power Consumption - external Monitor *
44.6 Watt (8%)
Power Consumption - Cinebench R15 Multi Power Consumption - external Monitor *
41.9 Watt (8%)
Power Consumption - Idle Power Consumption - external Monitor *
8.8 Watt (6%)

Average Benchmarks Qualcomm Snapdragon 8+ Gen 1 → 100% n=12

Average Benchmarks AMD Ryzen 5 6600U → 131% n=12

- Range of benchmark values for this graphics card
- Average benchmark values for this graphics card
* Smaller numbers mean a higher performance
1 This benchmark is not used for the average calculation

Add one or more devices and compare

In the following list you can select (and also search for) devices that should be added to the comparison. You can select more than one device.

restrict list:

show all (including archived), 2024, 2023
v1.28
log 02. 14:04:18

#0 checking url part for id 14528 +0s ... 0s

#1 checking url part for id 14090 +0s ... 0s

#2 redirected to Ajax server, took 1719921858 +0s ... 0s

#3 did not recreate cache, as it is less than 5 days old! Created at Mon, 01 Jul 2024 05:15:43 +0200 +0s ... 0s

#4 composed specs +0.006s ... 0.006s

#5 did output specs +0s ... 0.006s

#6 getting avg benchmarks for device 14528 +0.001s ... 0.007s

#7 got single benchmarks 14528 +0.023s ... 0.029s

#8 getting avg benchmarks for device 14090 +0.007s ... 0.037s

#9 got single benchmarks 14090 +0.006s ... 0.043s

#10 got avg benchmarks for devices +0s ... 0.043s

#11 min, max, avg, median took s +0.038s ... 0.081s

#12 return log +0.002s ... 0.084s

Please share our article, every link counts!
> Expert Reviews and News on Laptops, Smartphones and Tech Innovations > Benchmarks / Tech > Processor Comparison - Head 2 Head
Redaktion, 2017-09- 8 (Update: 2023-07- 1)