Notebookcheck Logo

Qualcomm Snapdragon 8+ Gen 1 vs Apple M3 Max 16-Core

Qualcomm Snapdragon 8+ Gen 1

► remove from comparison Qualcomm SD 8+ Gen 1

The Qualcomm Snapdragon 8+ Gen 1 Mobile Platform is a high-end SoC for smartphones that was introduced in mid 2022 and manufactured in 4 nm at TSMC. It integrates one “Prime Core” based on a ARM Cortex-X2 architecture clocked at up to 3.2 GHz. Three more performance cores are based on the Cortex-A710 but clocked up to 2.5 GHz. Furthermore, four energy saving cores are integrated that are based on the ARM Cortex-A510 architecture and clocked at up to 1.8 GHz. All cores can use the shared 6 MB level 3 cache.

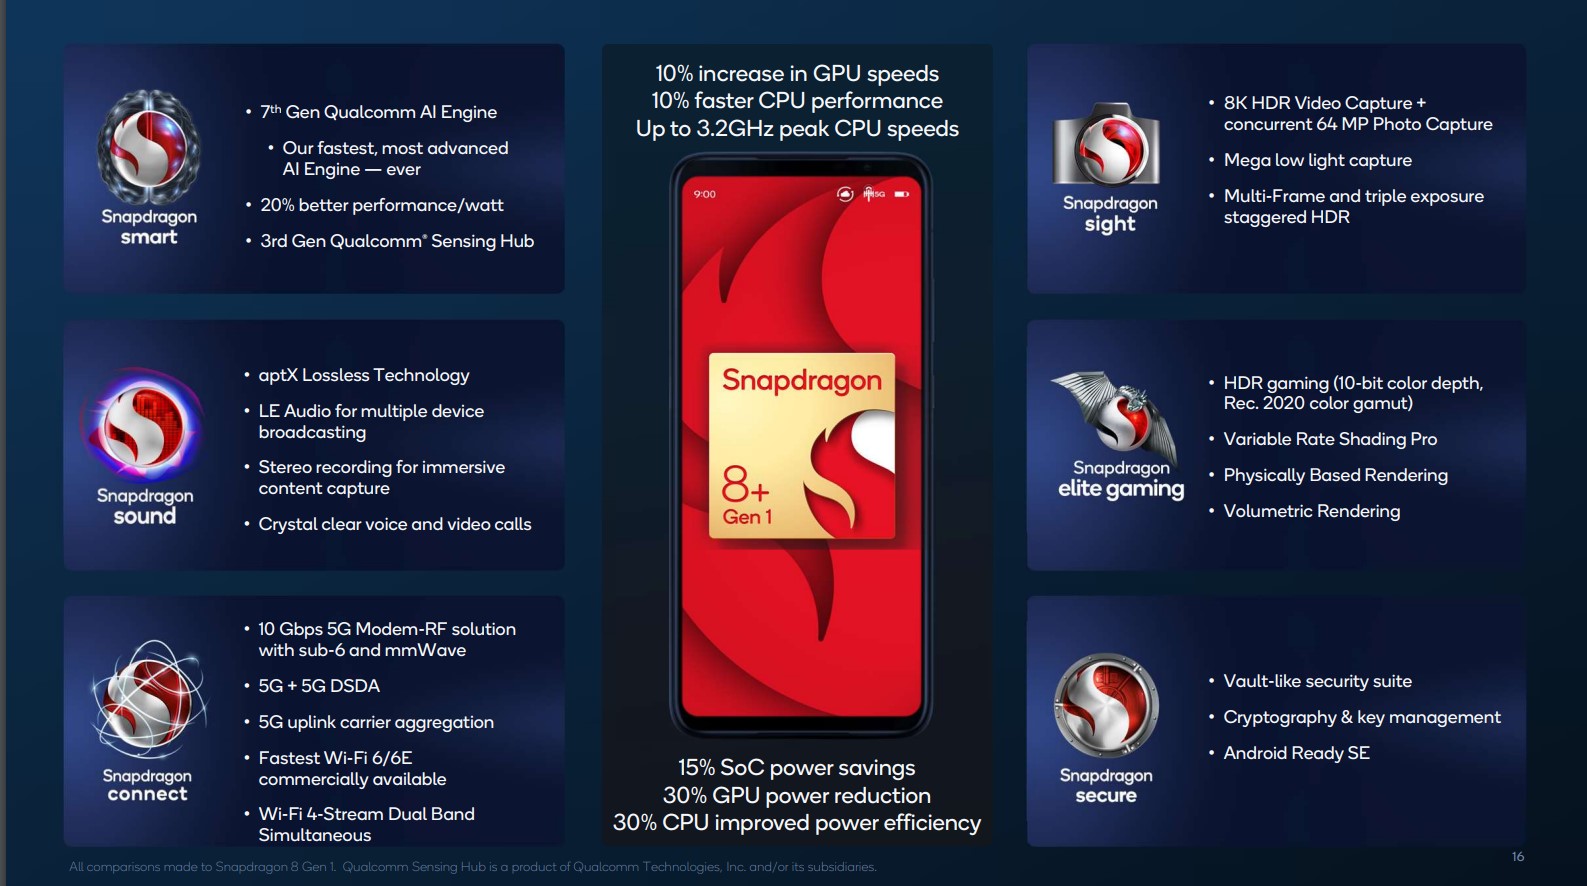
Compared to the Snapdragon 8 Gen 1, the SoC is now produced in the more power efficient 4nm process at TSMC and offers higher clocked CPU and GPU cores (at a lower power consumption according to Qualcomm).

The integrated AI Engine can offer up to 4x faster AI performance thanks to the bigger Tensor engine. The 18-Bit-Spectra-ISP also saw some big improvements and is now called Snapdragon Sight.

The integrated Adreno 730 offers a 30% graphics boost compared to the previous Adreno 660.

The integrated Snapdragon X65 5G modem is also new and offers faster transfer rates (up to 10 Gbps download and 3 Gbps upload). The FastConnect 6900 offers support for the current Wifi 6E and Bluetooth 5.2.

Apple M3 Max 16-Core

► remove from comparison Apple Apple M3 Max 16-Core

The Apple M3 Max (16 Core) is a system on a chip (SoC) from Apple for notebooks that was launched towards the end of 2023. It integrates a new 16-core CPU with 12 performance cores with up to 4.06 GHz and 4 efficiency cores with 2.8 GHz. There is also a slimmed-down 14-core variant with a 30-core GPU.

Thanks to the higher clock rates and architectural improvements, the processor performance is also significantly better than the M2 Max in benchmarks and can keep up with the fastest mobile CPUs (such as a Core i9-13900HX).

The M3 also integrates a new graphics card with dynamic caching, mesh shading and ray tracing acceleration via hardware. In the top model, all 40 cores of the chip are used and support up to 5 displays simultaneously (internal and 4 external).

GPU and CPU can jointly access the shared memory on the package (unified memory). This is available in 48, 64 and 128 GB variants and offers 400 GB/s maximum bandwidth (512 bit bus).

The integrated 16-core Neural Engine has also been revised and now offers 18 TOPS peak performance (compared to 15.8 TOPS in the M2 but 35 TOPS in the new A17 Pro). The video engine now also supports AV1 decoding in hardware. H.264, HEVC and ProRes (RAW) can still be decoded and encoded. Like its predecessor, the Max chip offers two video engines and can therefore encode and decode two streams simultaneously.

Unfortunately, the integrated WLAN only continues to support WiFi 6E (no WiFi 7), unlike the small M3 SoC thunderbolt 4 is also supported (max 40 Gbit/s).

The chip is manufactured in the current 3nm process (N3B) at TSMC and contains 92 billion transistors (+37% vs. Apple M2 Max). Under load, the CPU part consumes up to 56 watts, the chip can use a total of 78 watts.

ModelQualcomm Snapdragon 8+ Gen 1Apple M3 Max 16-Core
SeriesQualcomm SnapdragonApple Apple M3
CodenameCortex-X2 / A710 / A510 (Kryo) Waipio
Series: Apple M3
Qualcomm Snapdragon 8+ Gen 1 « 1.8 - 3.2 GHz8 / 8 cores6 MB L3
Qualcomm Snapdragon 8 Gen 1 compare1.8 - 3 GHz8 / 8 cores6 MB L3
Apple M3 Max 16-Core « 2.75 - 4.06 GHz16 / 16 cores
Apple M3 Max 14-Core compare2.75 - 4.06 GHz14 / 14 cores
Apple M3 Pro 12-Core compare2.75 - 4.06 GHz12 / 12 cores
Apple M3 Pro 11-Core compare2.75 - 4.06 GHz11 / 11 cores
Apple M3 compare2.75 - 4.06 GHz8 / 8 cores
Clock1800 - 3200 MHz2748 - 4056 MHz
L3 Cache6 MB
Cores / Threads8 / 816 / 16
12 x 4.1 GHz Apple M3 P-Core
4 x 2.7 GHz Apple M3 E-Core
Technology4 nm3 nm
FeaturesAdreno 730 GPU, Spectra ISP, Hexagon, X65 5G Modem, FastConnect 6900 WiFi, LPDDR5-6400 Memory ControllerARMv8 Instruction Set
iGPUQualcomm Adreno 730Apple M3 Max 40-Core GPU
ArchitectureARM v9ARM
Announced
Manufacturerwww.qualcomm.comwww.apple.com
TDP78 Watt
Transistors92000 Million

Benchmarks

Cinebench 2024 - Cinebench 2024 CPU Single Core
min: 139     avg: 139.5     median: 139.5 (97%)     max: 140 Points
Cinebench 2024 - Cinebench 2024 CPU Multi Core
min: 1532     avg: 1572     median: 1572 (29%)     max: 1612 Points
Cinebench R23 - Cinebench R23 Multi Core
min: 24020     avg: 24022     median: 24022 (22%)     max: 24024 Points
Cinebench R23 - Cinebench R23 Single Core
min: 1950     avg: 1959     median: 1959 (83%)     max: 1968 Points
Cinebench R20 - Cinebench R20 CPU (Single Core)
min: 492     avg: 494.5     median: 494.5 (55%)     max: 497 Points
Cinebench R20 - Cinebench R20 CPU (Multi Core)
min: 5920     avg: 6124     median: 6123.5 (15%)     max: 6327 Points
Cinebench R15 - Cinebench R15 CPU Multi 64 Bit
min: 3225     avg: 3297     median: 3264 (21%)     max: 3401 Points
Cinebench R15 - Cinebench R15 CPU Single 64 Bit
min: 269     avg: 271     median: 271 (82%)     max: 273 Points
Blender - Blender 3.3 Classroom CPU *
min: 194     avg: 195     median: 195 (2%)     max: 196 Seconds
Blender - Blender 2.79 BMW27 CPU *
min: 215     avg: 216     median: 216 (2%)     max: 217 Seconds
Geekbench 6.2 - Geekbench 6.2 Single-Core
min: 1530     avg: 1719     median: 1741 (47%)     max: 1806 Points
min: 3096     avg: 3127     median: 3126.5 (84%)     max: 3157 Points
Geekbench 6.2 - Geekbench 6.2 Multi-Core
min: 4140     avg: 4483     median: 4584 (18%)     max: 4690 Points
min: 21243     avg: 21254     median: 21253.5 (84%)     max: 21264 Points
min: 2318     avg: 2325     median: 2324.5 (98%)     max: 2331 Points
min: 22816     avg: 22938     median: 22937.5 (41%)     max: 23059 Points
Geekbench 4.4 - Geekbench 4.1 - 4.4 64 Bit Single-Core
min: 6968     avg: 7193     median: 7202.5 (72%)     max: 7378 Points
Geekbench 4.4 - Geekbench 4.1 - 4.4 64 Bit Multi-Core
min: 16273     avg: 17467     median: 17569.5 (19%)     max: 18976 Points
Geekbench 3 - Geekbench 3 64 Bit Multi-Core
15884 Points (25%)
Geekbench 3 - Geekbench 3 64 Bit Single-Core
6109 Points (91%)
Mozilla Kraken 1.1 - Kraken 1.1 Total Score *
min: 728.6     avg: 1047     median: 982.6 (1%)     max: 1706.5 ms
min: 379.2     avg: 385.5     median: 385.5 (0%)     max: 391.7 ms
Sunspider - Sunspider 1.0 Total Score *
190.4 ms (2%)
Octane V2 - Octane V2 Total Score
min: 17622     avg: 41373     median: 39564 (35%)     max: 55611 Points
min: 94770     avg: 96363     median: 96362.5 (85%)     max: 97955 Points
WebXPRT 4 - WebXPRT 4 Score
min: 69     avg: 111     median: 101 (29%)     max: 159 Points
WebXPRT 3 - WebXPRT 3 Score
min: 106     avg: 159.4     median: 156.5 (33%)     max: 224 Points
min: 416     avg: 421     median: 421 (88%)     max: 426 Points
PCMark for Android - PCM f. Android Storage 2.0 random write internal
55.5 MB/s (41%)
PCMark for Android - PCM f. Android Storage 2.0 seq write internal
1504 MB/s (46%)
PCMark for Android - PCM f. Android Storage 2.0 random read internal
37.6 MB/s (46%)
PCMark for Android - PCM f. Android Storage 2.0 seq read internal
1588 MB/s (44%)
PCMark for Android - PCM f. Android Storage 2.0 score
min: 27865     avg: 33338     median: 33344.5 (53%)     max: 37845 Points
min: 2032     avg: 2042     median: 2041.5 (78%)     max: 2051 Points
Power Consumption - Cinebench R15 Multi Power Consumption - external Monitor *
min: 91.8     avg: 92.3     median: 92.3 (17%)     max: 92.7 Watt
Power Consumption - Idle Power Consumption - external Monitor *
min: 3.81     avg: 5.2     median: 5.2 (3%)     max: 6.49 Watt
min: 4.63     avg: 6.3     median: 6.3 (7%)     max: 7.91 Watt
Power Consumption - Cinebench R15 Multi Power Efficiency - external Monitor
min: 35.1     avg: 35.9     median: 35.9 (27%)     max: 36.7 Points per Watt

Average Benchmarks Qualcomm Snapdragon 8+ Gen 1 → 100% n=8

Average Benchmarks Apple M3 Max 16-Core → 271% n=8

- Range of benchmark values for this graphics card
- Average benchmark values for this graphics card
* Smaller numbers mean a higher performance
1 This benchmark is not used for the average calculation

Add one or more devices and compare

In the following list you can select (and also search for) devices that should be added to the comparison. You can select more than one device.

restrict list:

show all (including archived), 2024, 2023
v1.28
log 28. 09:36:40

#0 checking url part for id 14528 +0s ... 0s

#1 checking url part for id 15113 +0s ... 0s

#2 redirected to Ajax server, took 1719560200 +0s ... 0s

#3 did not recreate cache, as it is less than 5 days old! Created at Fri, 28 Jun 2024 05:15:21 +0200 +0s ... 0s

#4 composed specs +0.005s ... 0.005s

#5 did output specs +0s ... 0.005s

#6 getting avg benchmarks for device 14528 +0.001s ... 0.005s

#7 got single benchmarks 14528 +0.022s ... 0.028s

#8 getting avg benchmarks for device 15113 +0.001s ... 0.028s

#9 got single benchmarks 15113 +0.004s ... 0.033s

#10 got avg benchmarks for devices +0s ... 0.033s

#11 min, max, avg, median took s +0.021s ... 0.054s

#12 return log +0.002s ... 0.056s

Please share our article, every link counts!
> Expert Reviews and News on Laptops, Smartphones and Tech Innovations > Benchmarks / Tech > Processor Comparison - Head 2 Head
Redaktion, 2017-09- 8 (Update: 2023-07- 1)