

SCHENKER XMG Core 15 (M24) laptop review: A premium, metal-cased gaming machine from Germany
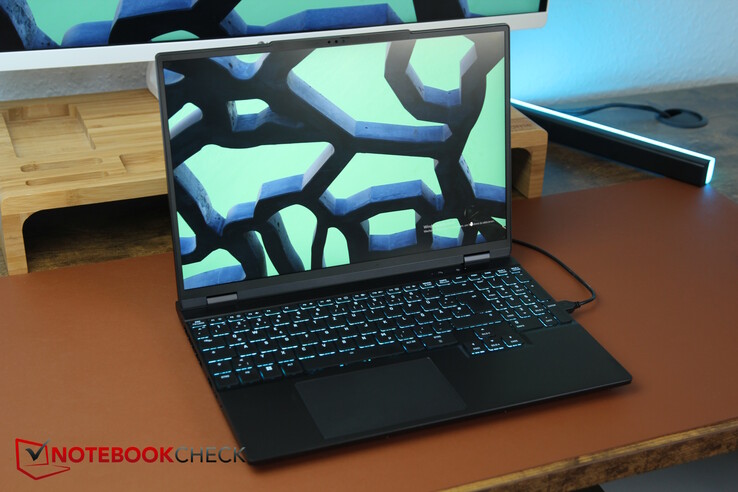
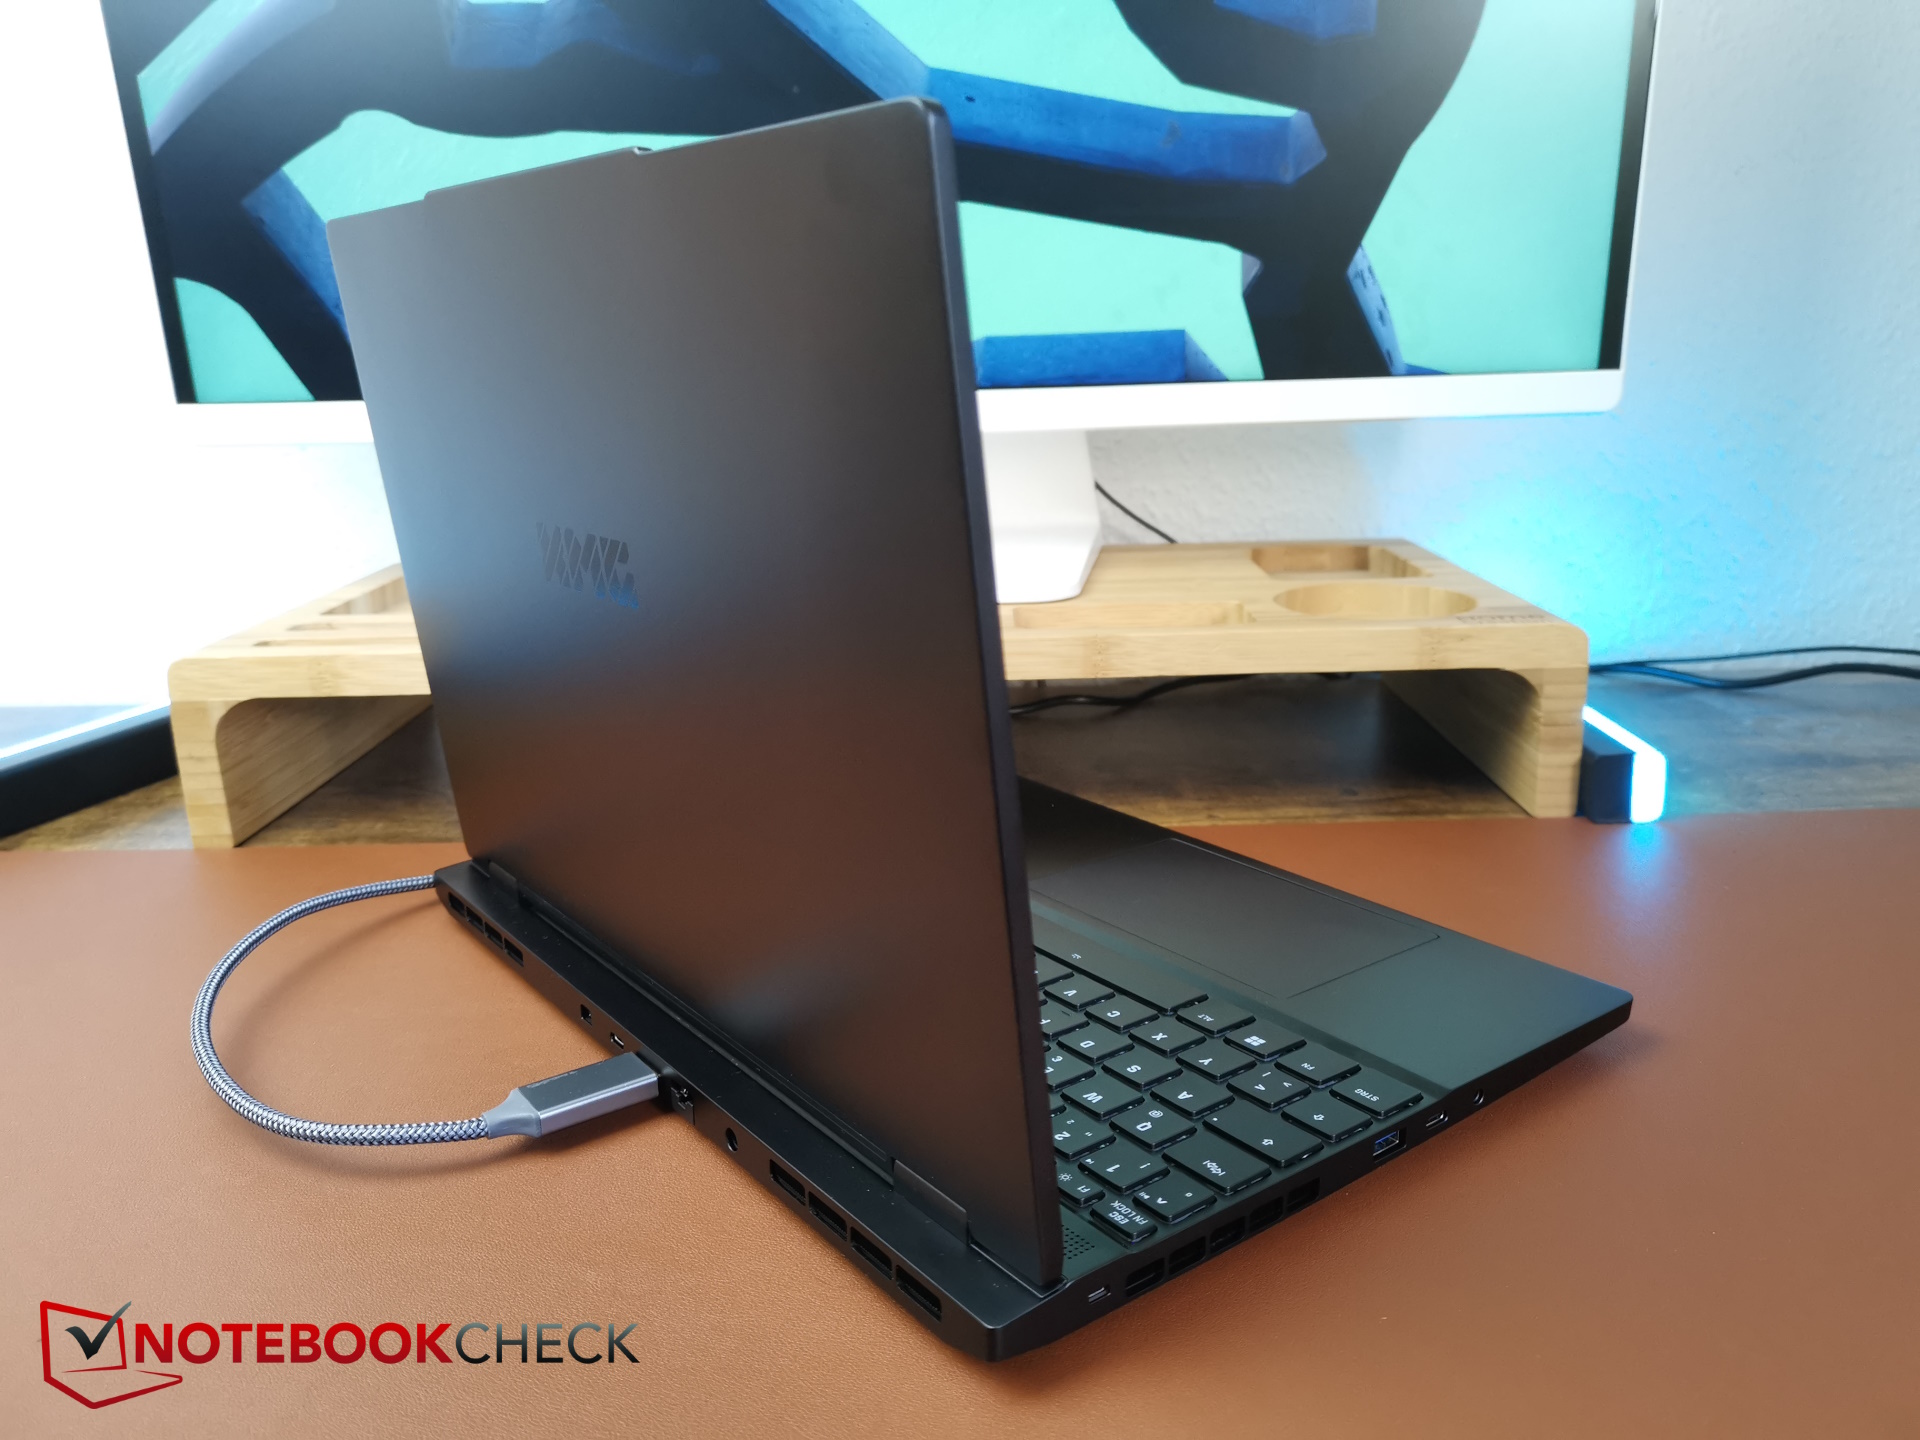
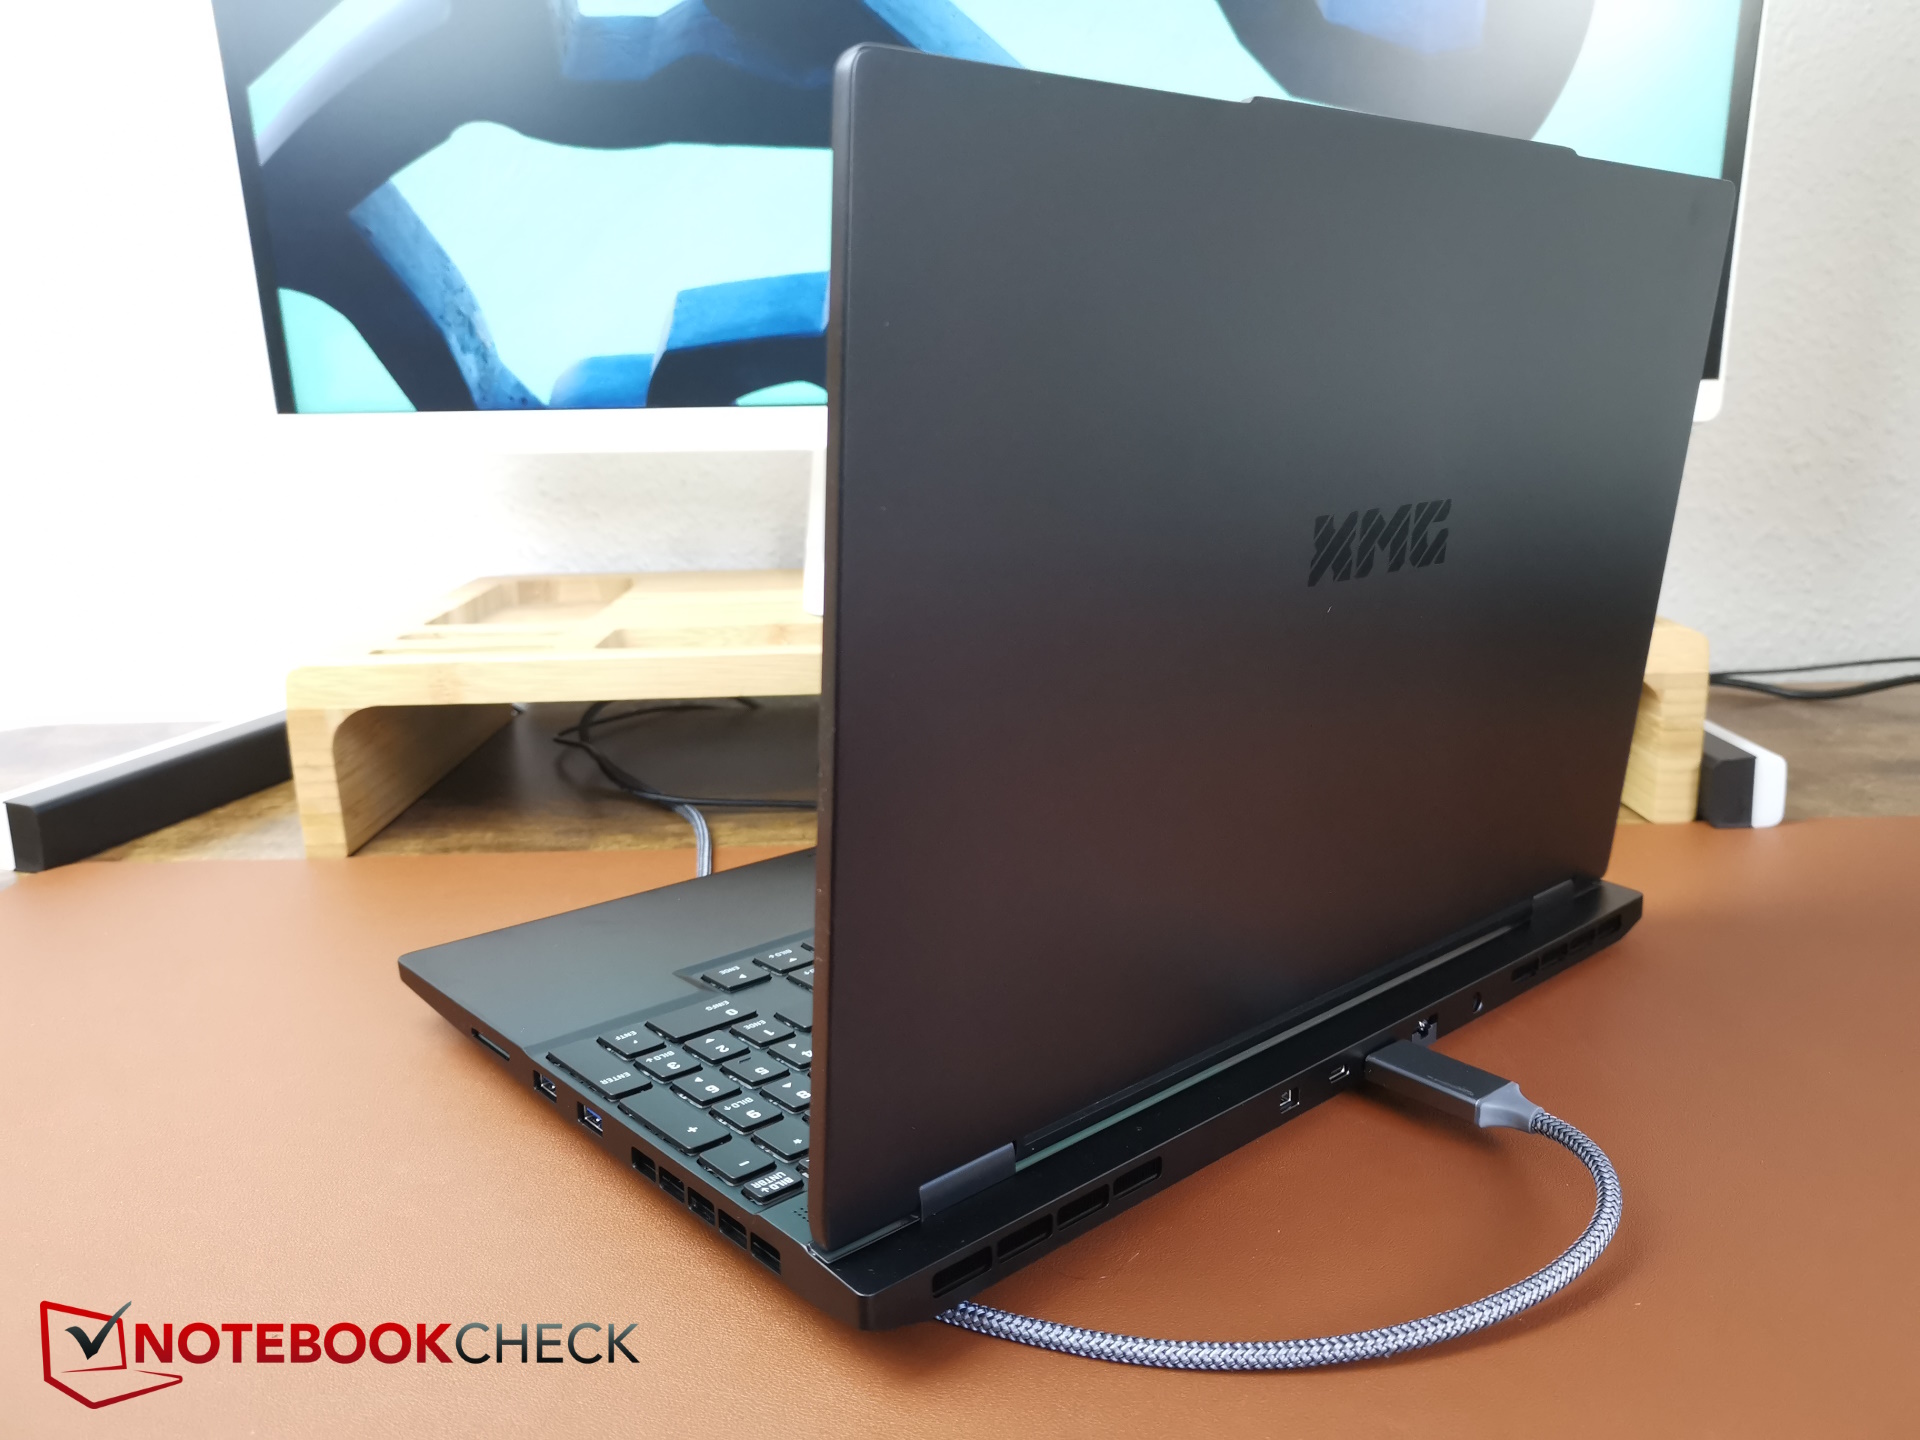
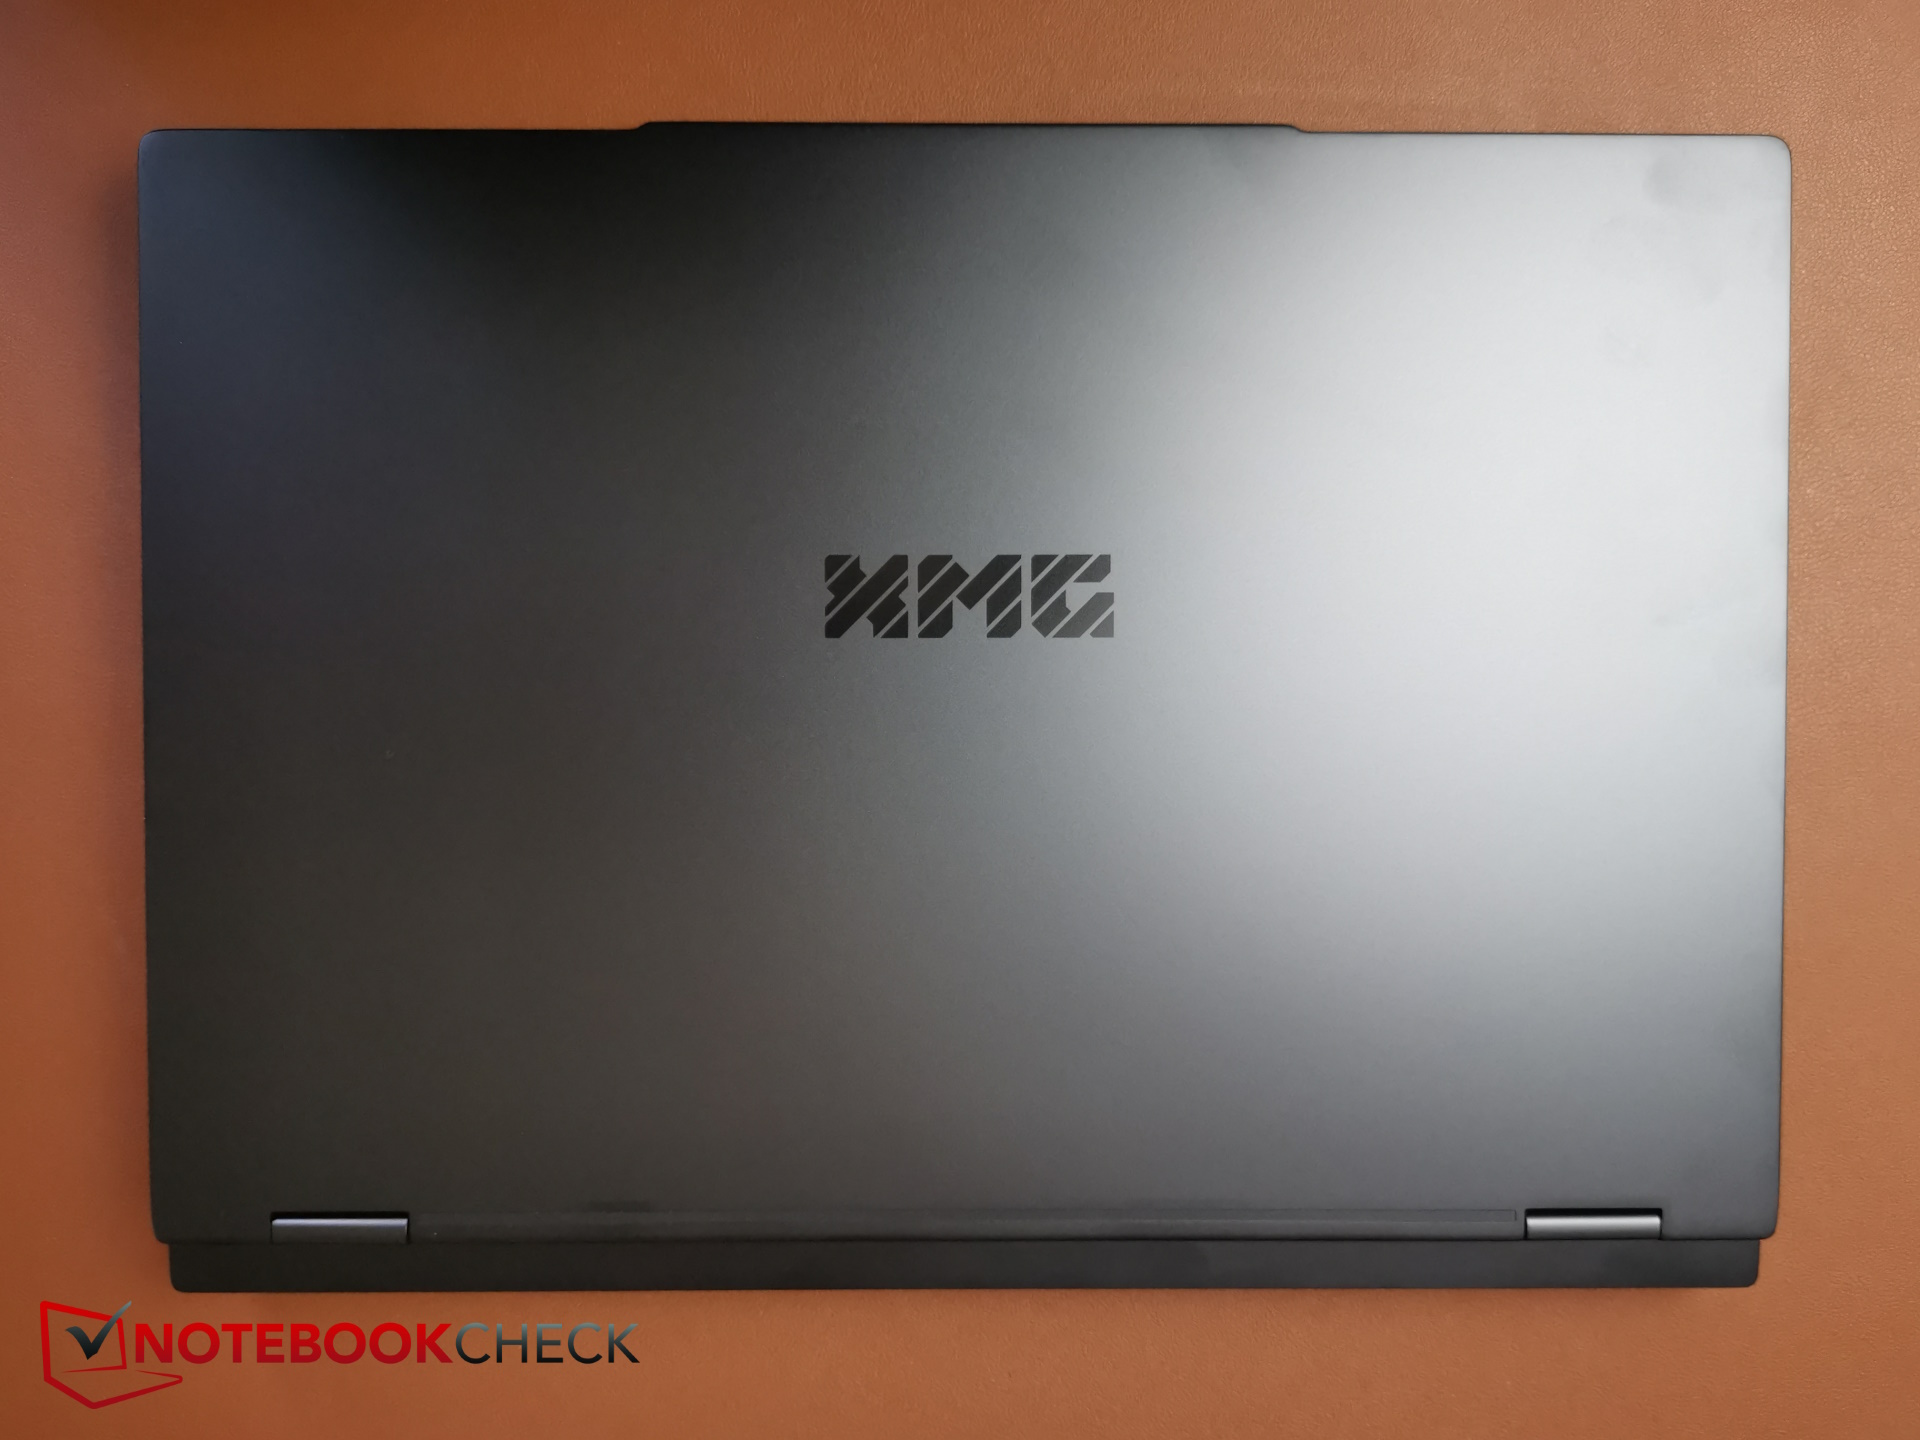
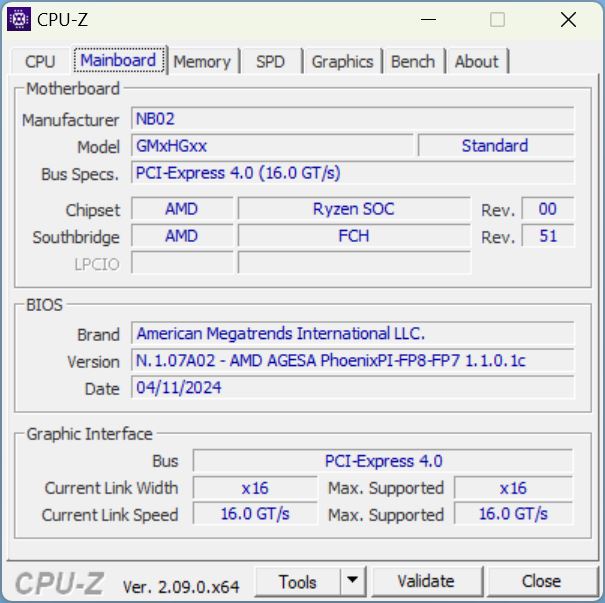
According to Schenker, the current Core 15 is a slightly pared-down Fusion 15. The advantage is a significantly cheaper price, however, despite this, the Core 15 keeps its sleek metal case which lends it a good look and feel. The manufacturer calls it "Undercover Gaming" because the aluminum case also ought to appeal to creators without necessarily screaming gaming laptop.
Nevertheless, the Core 15 is not only pared-down, it also changes a few things. For example, the laptop processor is a current generation AMD Ryzen instead of an Intel Gen14 HX CPU which lowers the price somewhat but is, by no means, worse.
Since there are no longer virtually any 15-inch laptops equipped with a current CPU, we are comparing the 15.3-inch Core 15 with the 16-inch gaming and multimedia laptops which come with an RTX 4060 such as the Dell G16, the Lenovo Legion 5i 16 G9, as well as the HP Victus 16. In addition, we have, of course, drawn comparisons with the Fusion 15 and also taken a look at what has changed since last year's Schenker XMG Pro 15 E23.
Watch out: Our new rating system is V8 which means the scores are now lower. With the old V7 rating system V7, the Core 15 scored between 88 and 89 percent. You can find out what is new here.
Update July 16, 2024: We subsequently repeated the battery tests because some background processes apparently prevented better runtimes in the first run. The battery life achieved in the second attempt is significantly higher, so we have included this as a positive pro point in the verdict. In addition, the rating increases from 83 to 84 percent.
Possible competitors compared
Rating | Version | Date | Model | Weight | Height | Size | Resolution | Price |
|---|---|---|---|---|---|---|---|---|
| 83.7 % | v8 | 06 / 2024 | SCHENKER XMG Core 15 (M24) R7 8845HS, NVIDIA GeForce RTX 4060 Laptop GPU | 2.1 kg | 21.9 mm | 15.30" | 2560x1600 | |
| 89.1 % v7 (old) | v7 (old) | 01 / 2024 | Lenovo Legion 5 16IRX G9 i7-14650HX, NVIDIA GeForce RTX 4060 Laptop GPU | 2.4 kg | 25.2 mm | 16.00" | 2560x1600 | |
| 84.3 % v7 (old) | v7 (old) | 05 / 2024 | HP Victus 16 (2024) i7-14700HX, NVIDIA GeForce RTX 4060 Laptop GPU | 2.4 kg | 23.9 mm | 16.10" | 1920x1080 | |
| 85.5 % v7 (old) | v7 (old) | 02 / 2024 | Dell G16, i7-13650HX, RTX 4060 i7-13650HX, NVIDIA GeForce RTX 4060 Laptop GPU | 2.8 kg | 25.65 mm | 16.00" | 2560x1600 | |
| 88.9 % v7 (old) | v7 (old) | 05 / 2024 | SCHENKER XMG Fusion 15 (Early 24) i9-14900HX, NVIDIA GeForce RTX 4070 Laptop GPU | 2.1 kg | 21.9 mm | 15.30" | 2560x1600 | |
| 86.2 % v7 (old) | v7 (old) | 07 / 2023 | SCHENKER XMG Pro 15 (E23) i9-13900HX, NVIDIA GeForce RTX 4060 Laptop GPU | 2.4 kg | 24.9 mm | 15.60" | 2560x1440 |
Note: We have recently updated our rating system and the results of version 8 are not comparable with the results of version 7. More information is available here .
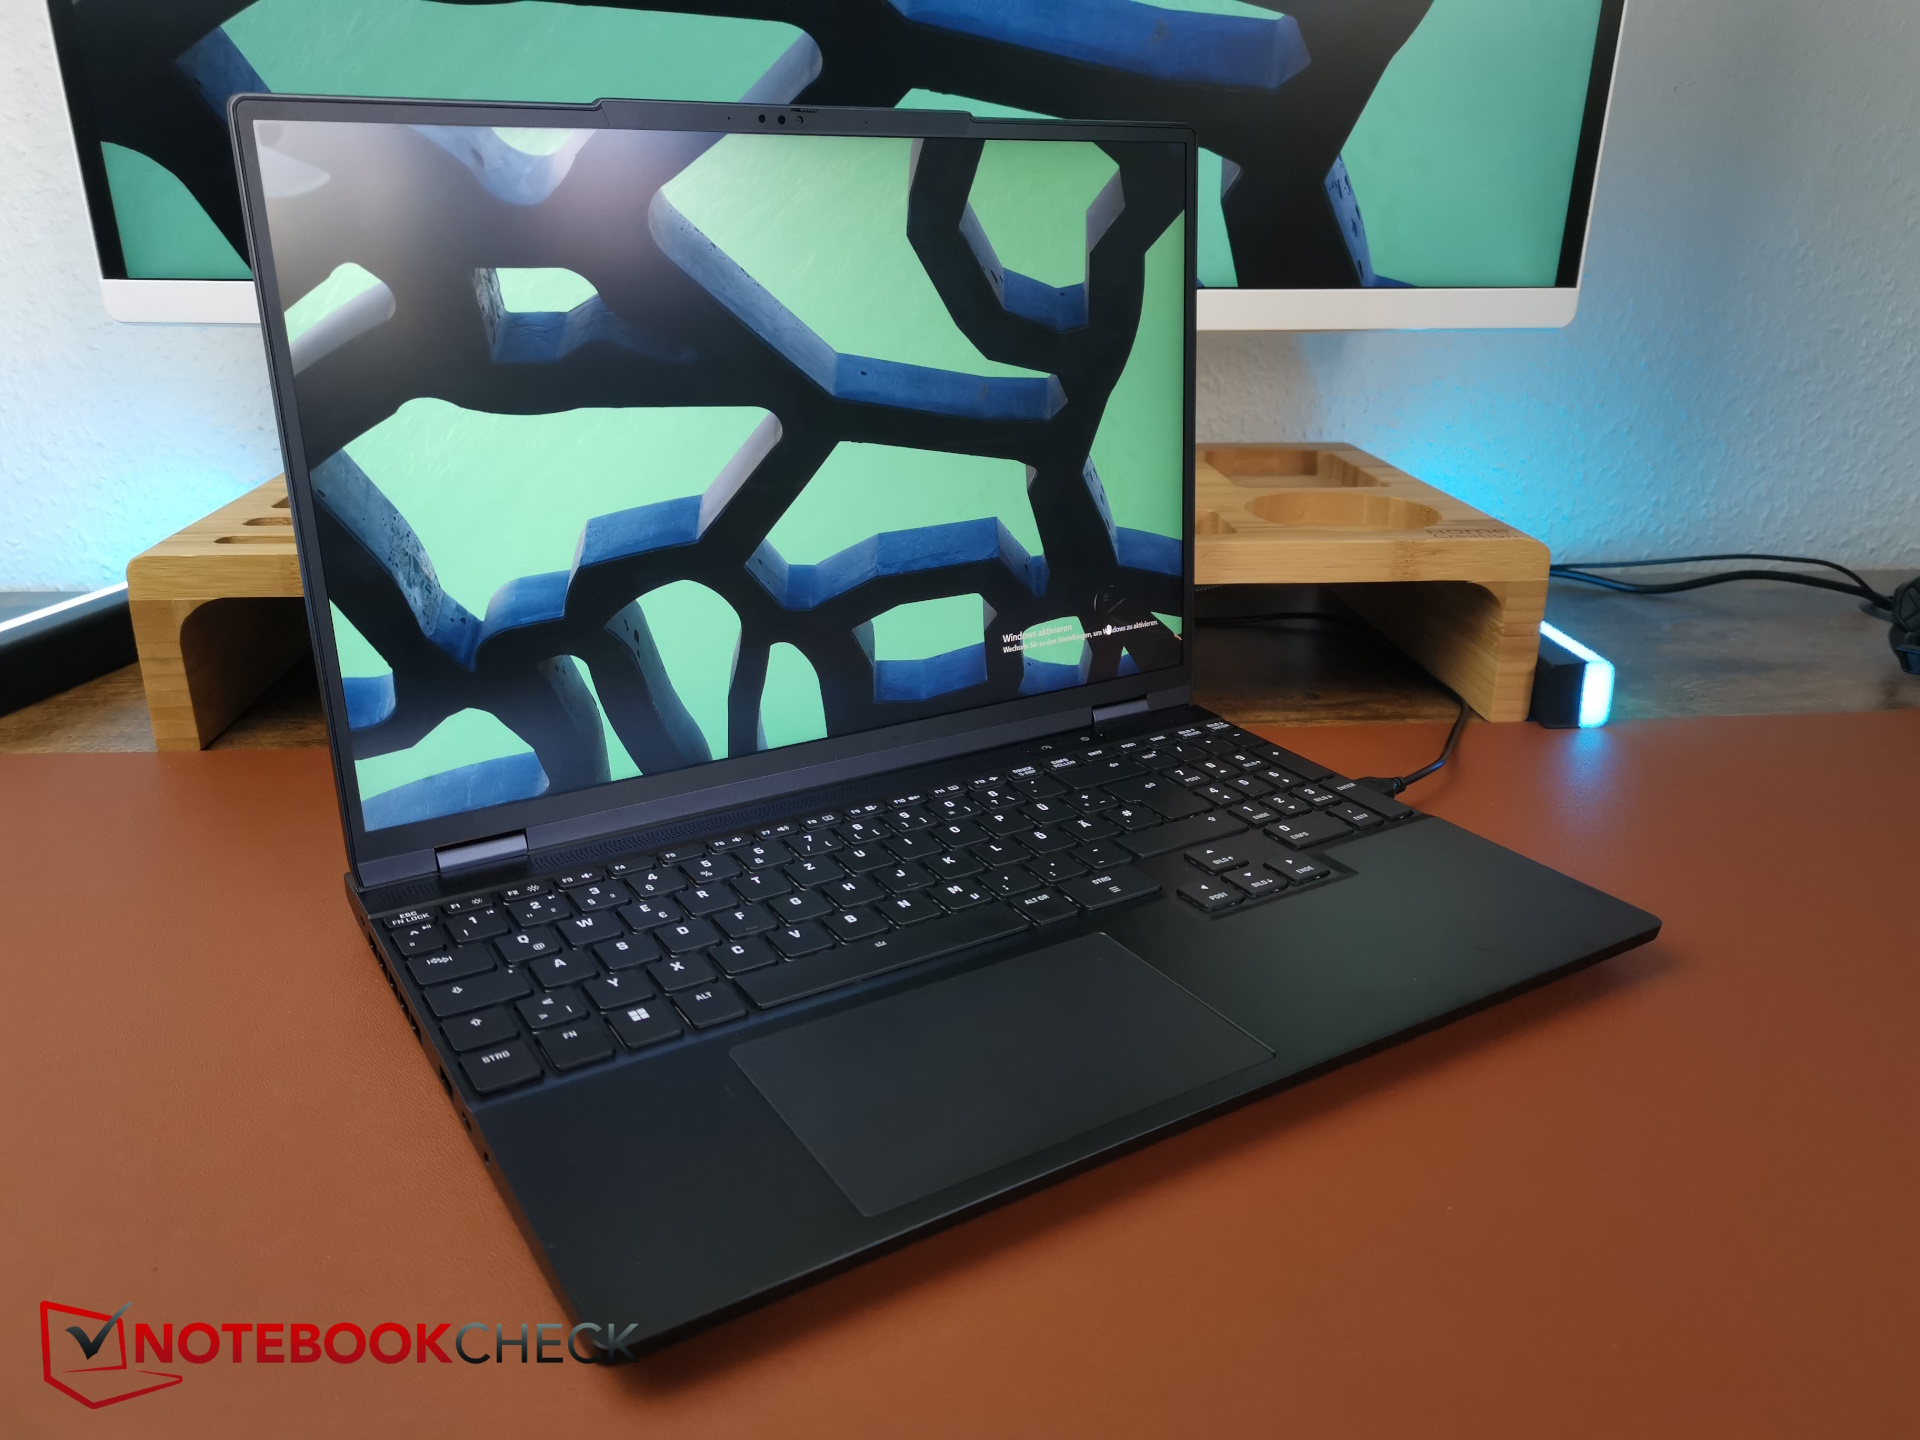
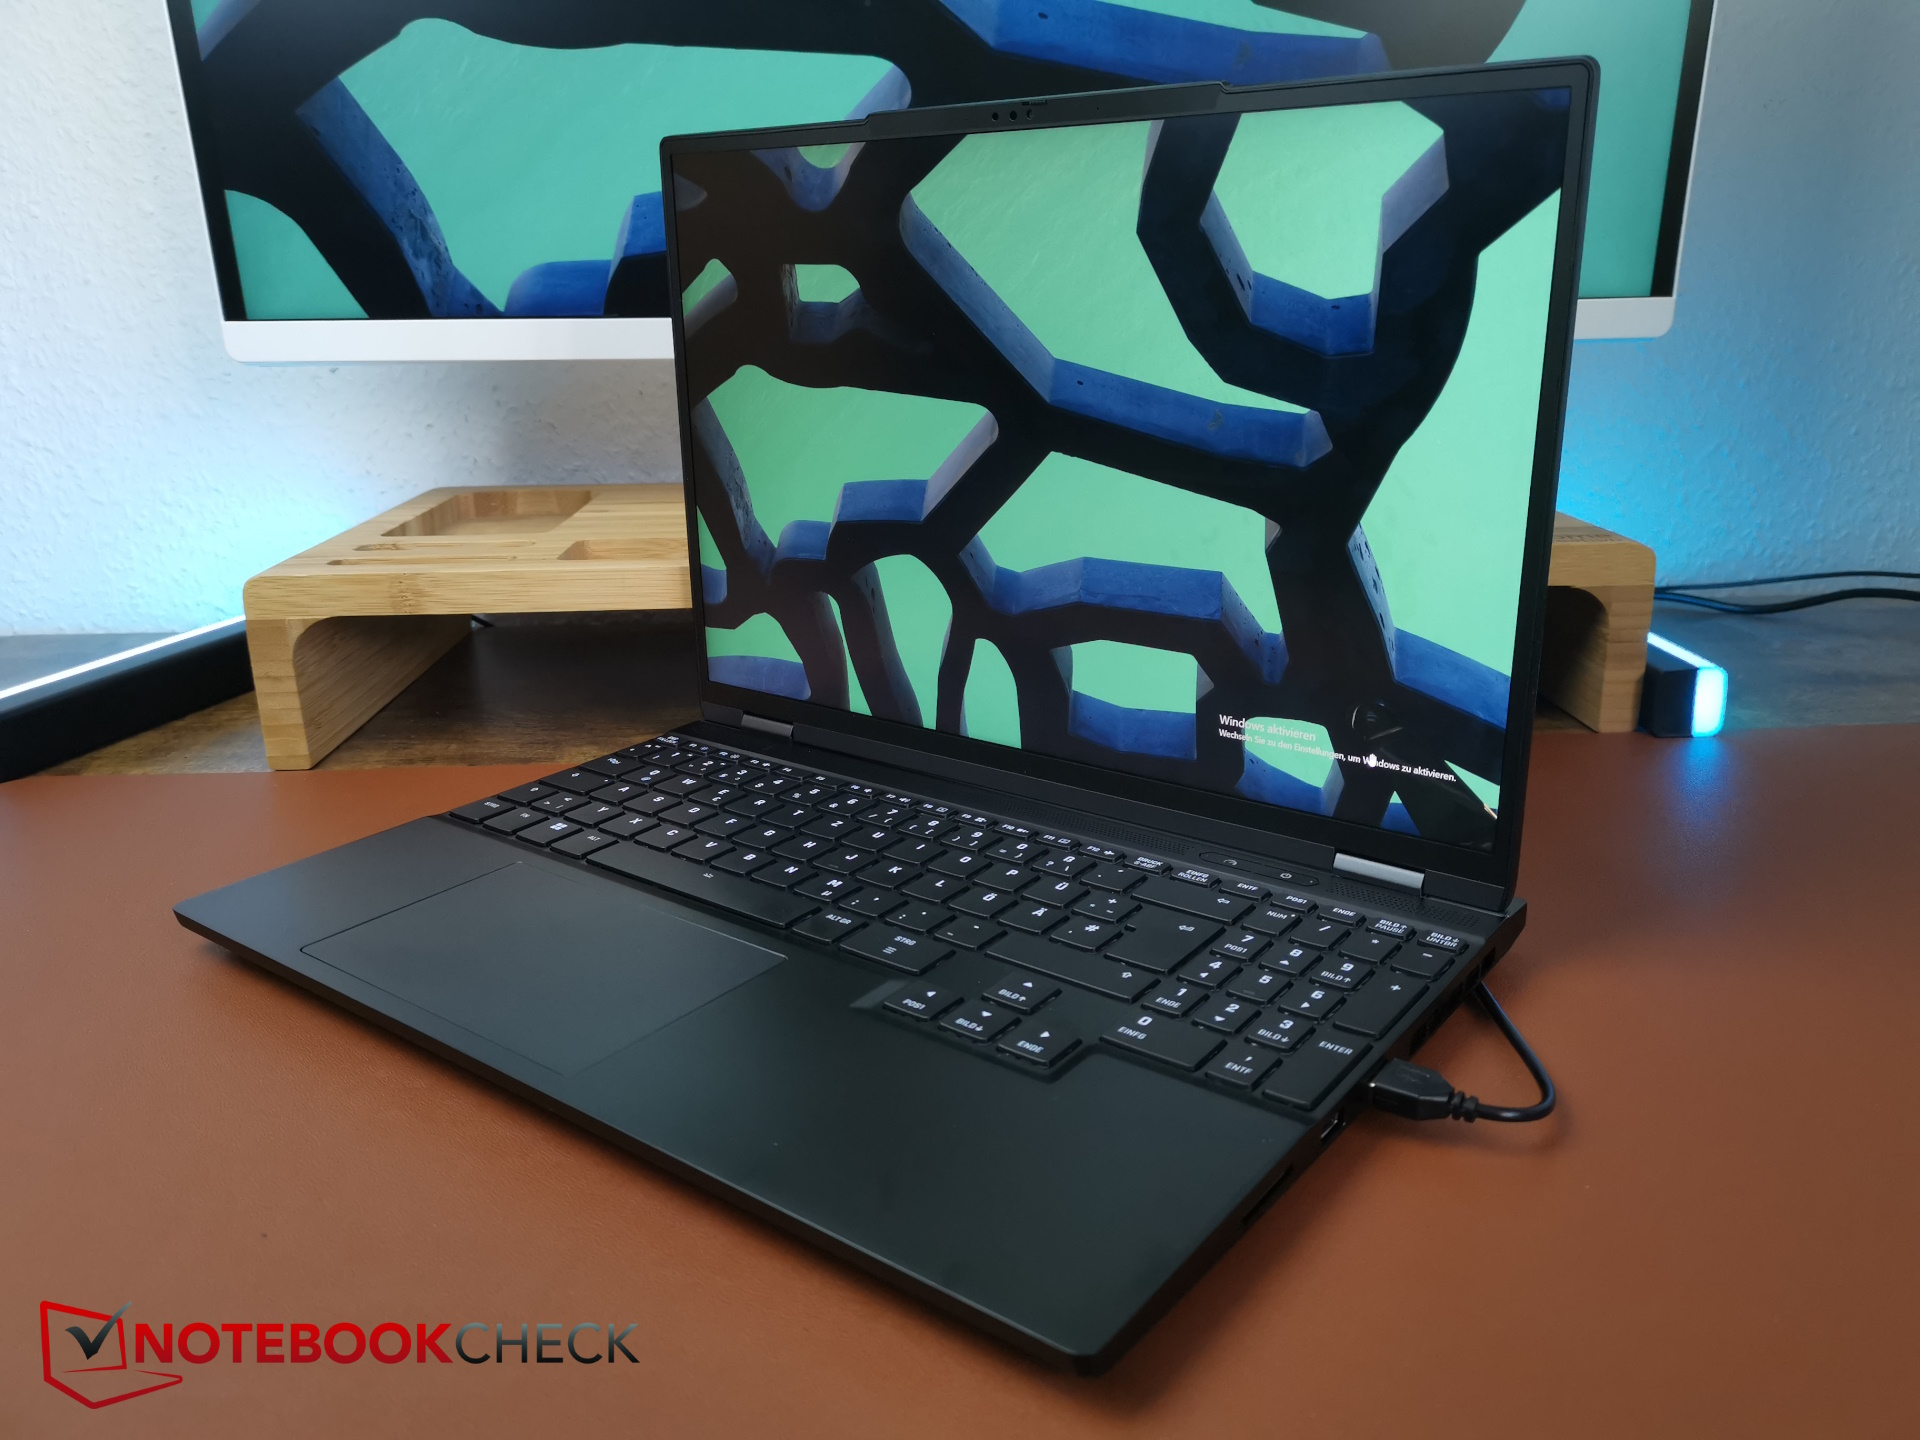
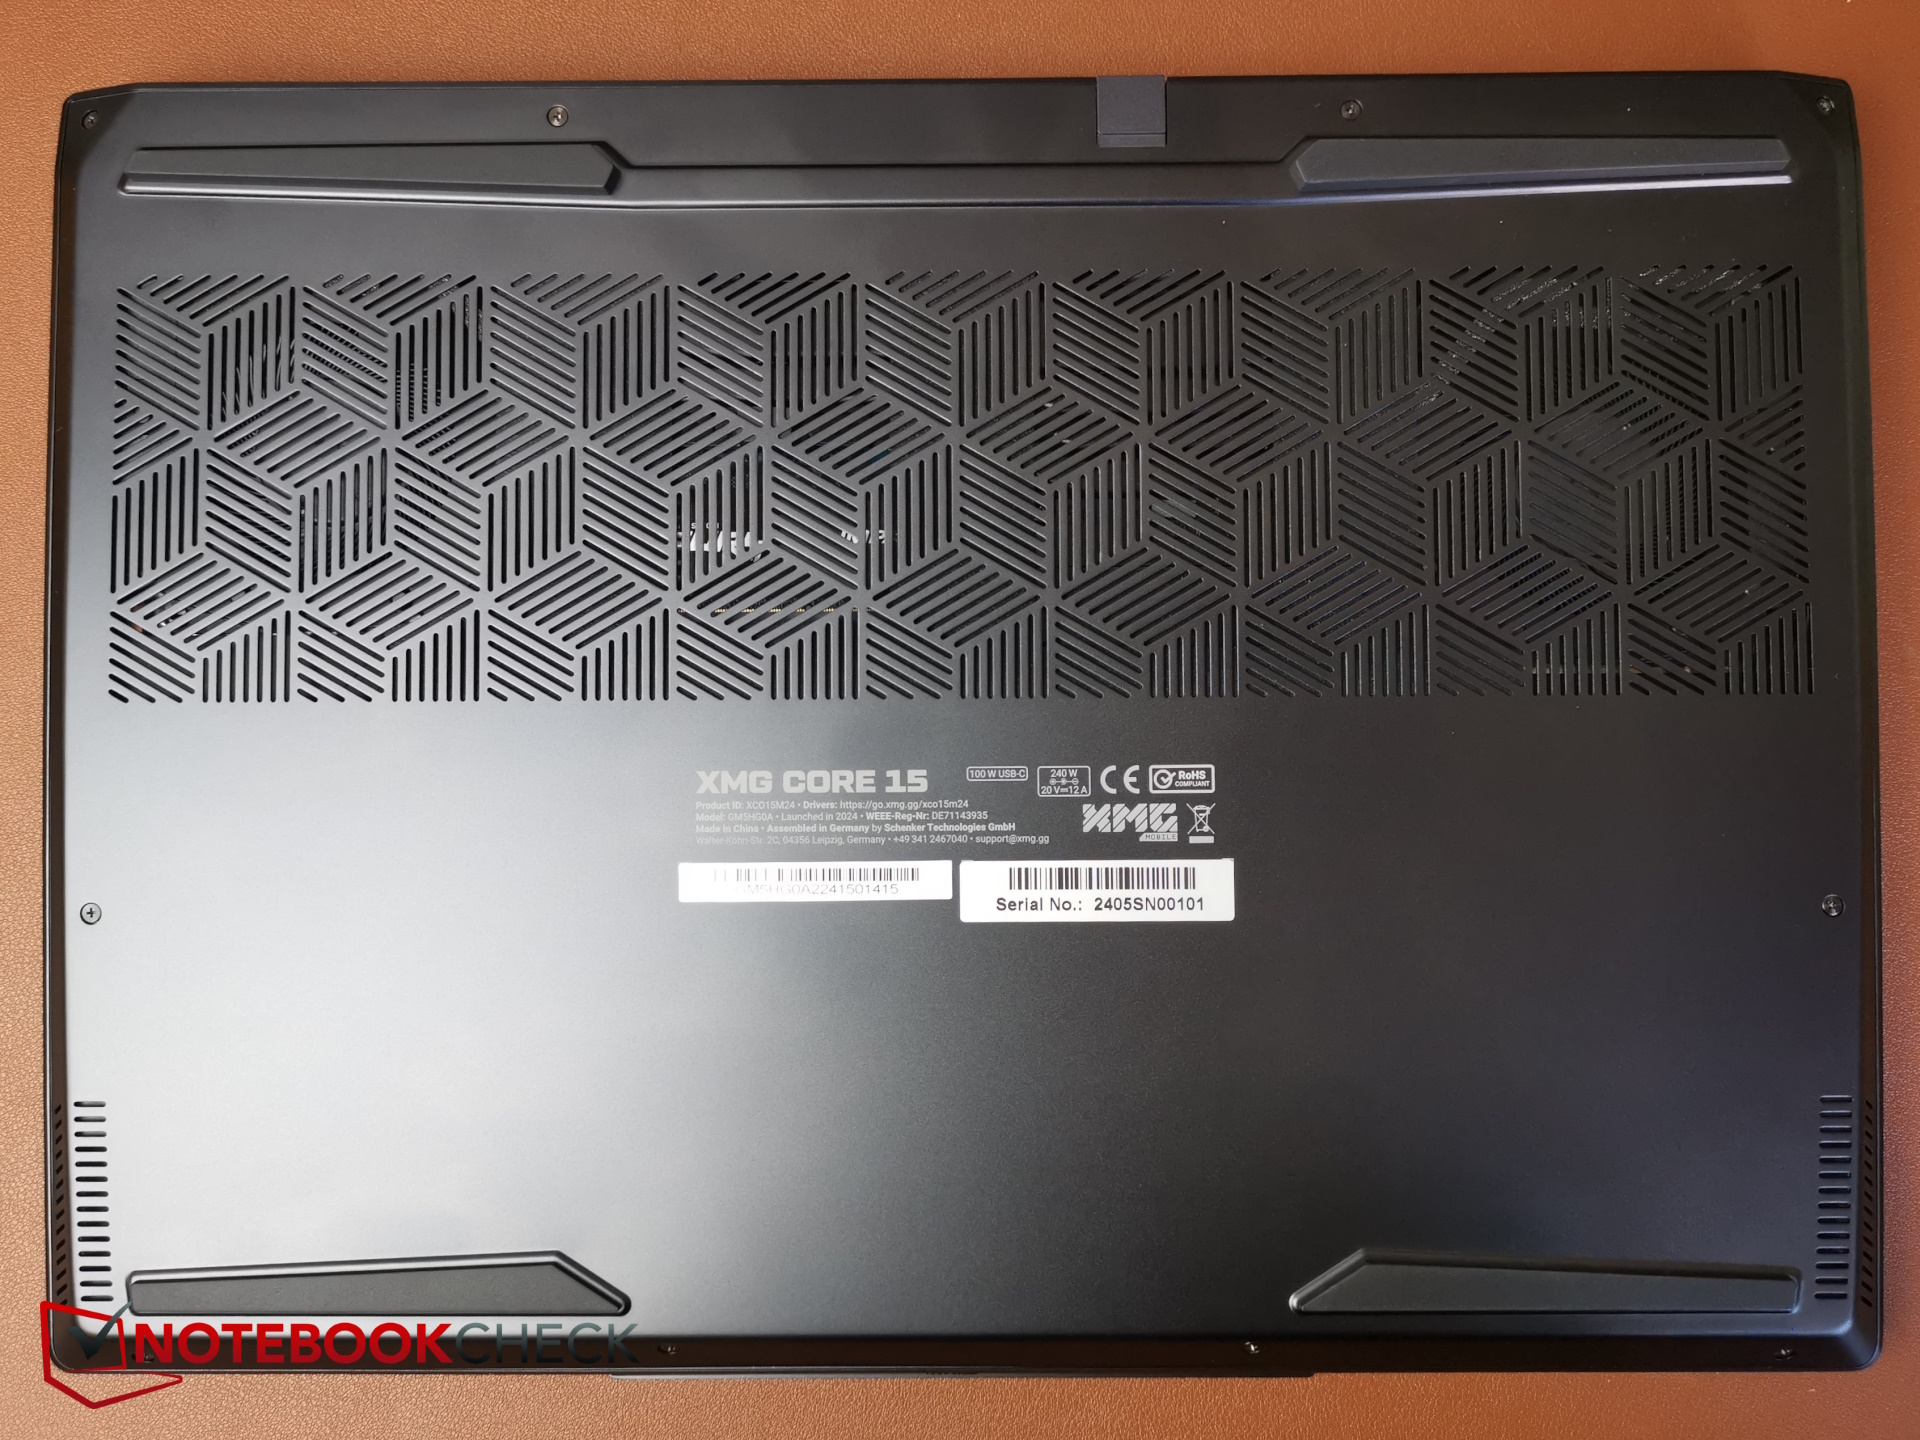
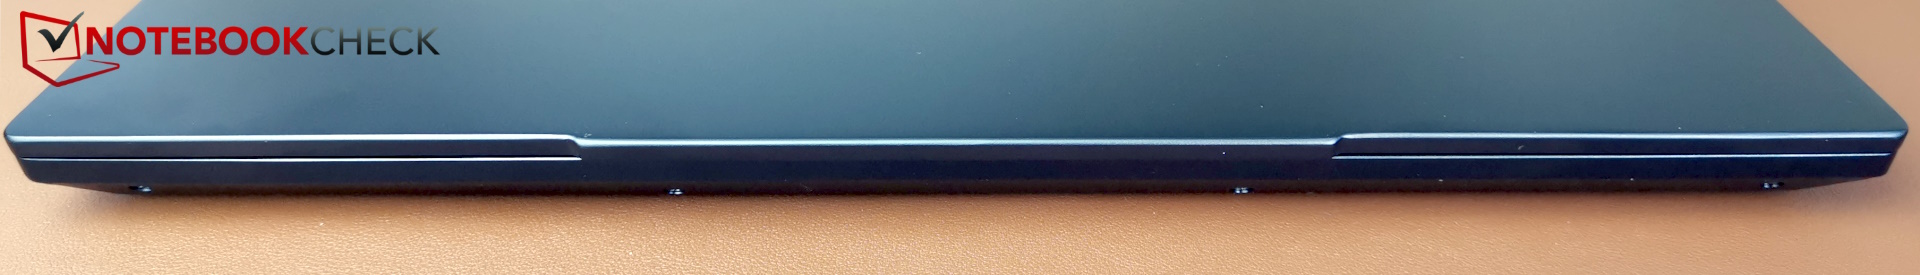
Case & features: A stylish aluminum case
Since we have already extensively tested the visual features, we refer you to our XMG Fusion 15 review for further information regarding the case, maintenance, ports and input devices. Here we will only list the changes to these aspects.
Size comparison
At the moment, 15-inch gaming machines with a current CPU appear to have almost died out and one of the Core 15's unique features is its unusual 15.3-inch format. The manufacturer argues that current 16-inch laptops are hardly any bigger meaning you can now get a larger display in in nearly the same-sized case.
However, with the Core 15, you can see that some of the 16-inch competitors are noticeably bigger. On top of that, they are also thicker and heavier. The latter is the case despite the competition using significantly more plastic. This is an area in which the Core 15 scores a plus point for mobility.
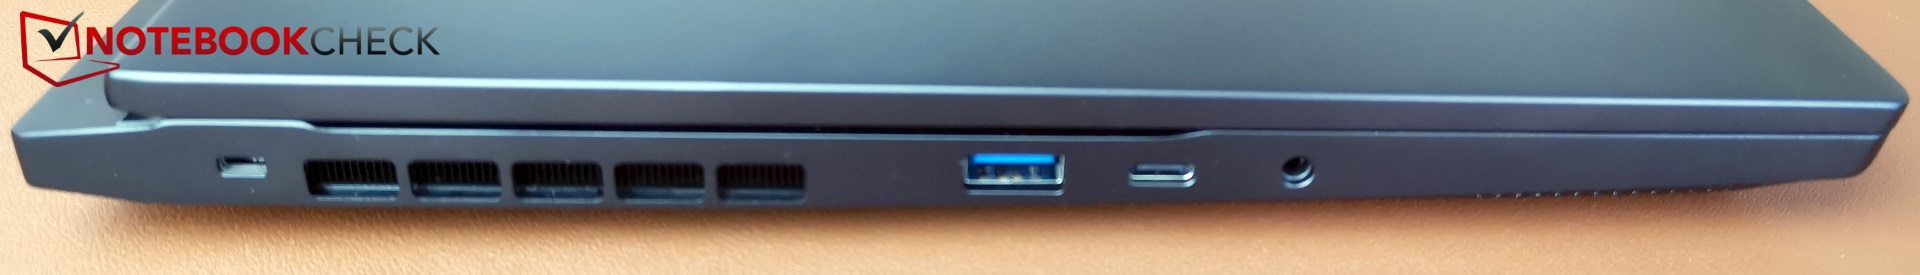
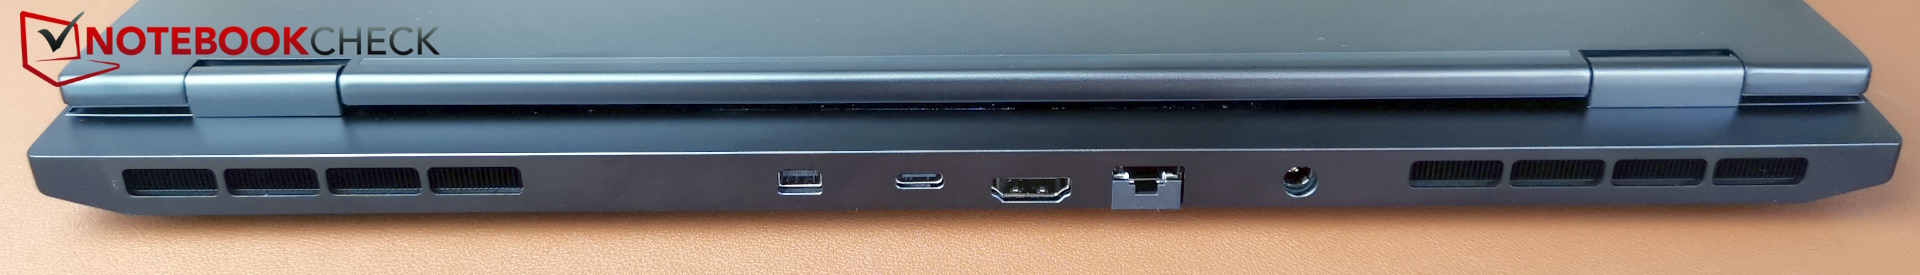
Ports
Unlike the Intel CPU-equipped Fusion, the AMD Core does without Thunderbolt 4 and USB 4. Instead, you only get USB-C 3.2 Gen 2 although it does offer Power Delivery at up to 100 W (20V, 5 A).
There is one additional advantage over the Fusion: With the Core, you get a dedicated mini DisplayPort that is absent in the Fusion.
One interesting side note: At the beginning of 2023, our recently reviewed Core 15 was still equipped with a water connection for external cooling which went by the name of XMG Oasis. These ports are now absent in the newer and slimmer Core 15 and it appears XMG has given up on experimenting with this production series.
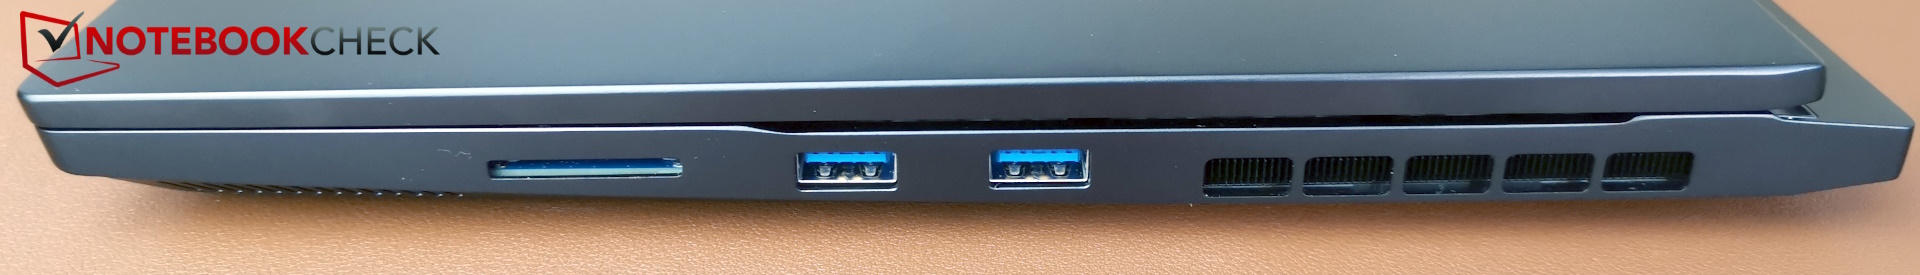
SD Card Reader
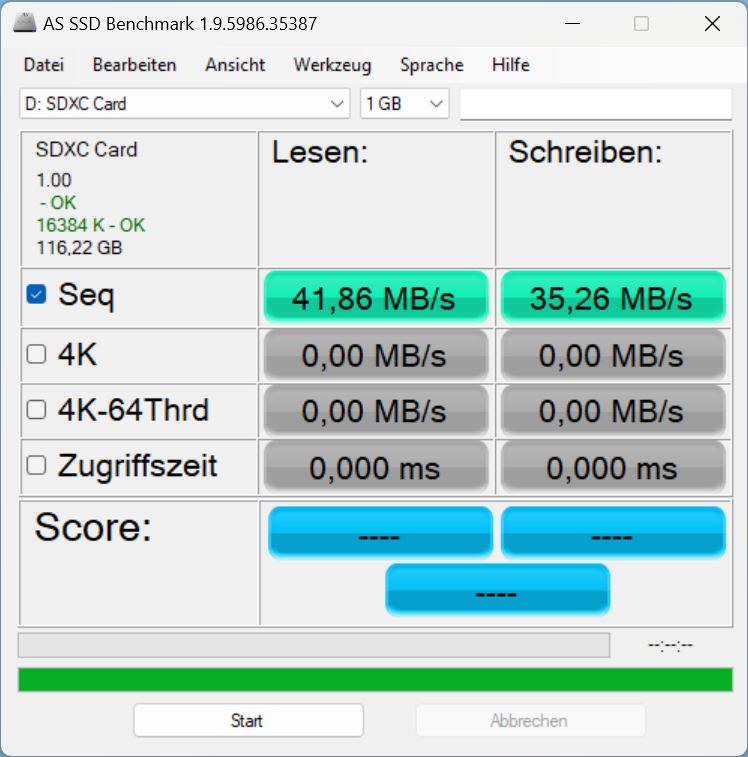
The SD reader takes full-sized cards, however, there is no locking mechanism which means the cards stick out.
Unfortunately, the performance of the already average card reader found in the Fusion 15 has halved again meaning the Core 15 belongs to some of the slowest performers in this category.
| SD Card Reader | |
| average JPG Copy Test (av. of 3 runs) | |
| Average of class Gaming (20 - 210, n=67, last 2 years) | |
| SCHENKER XMG Pro 15 (E23) | |
| SCHENKER XMG Fusion 15 (Early 24) (AV PRO microSD 128 GB V60) | |
| SCHENKER XMG Core 15 (M24) | |
| Lenovo Legion 5 16IRX G9 | |
| maximum AS SSD Seq Read Test (1GB) | |
| Average of class Gaming (25.8 - 261, n=65, last 2 years) | |
| SCHENKER XMG Pro 15 (E23) | |
| SCHENKER XMG Fusion 15 (Early 24) (AV PRO microSD 128 GB V60) | |
| SCHENKER XMG Core 15 (M24) | |
| Lenovo Legion 5 16IRX G9 | |
Communication
The manufacturer informed us after receiving the laptop that our review model was accidentally fitted with an Intel AX211 WiF, just like the Fusion 15. This isn't actually the case with the Core 15.
Normally, the Intel AX200 comes as standard in the Core 15 and, for only an additional 15 dollars, you get the AMD Wi-Fi 6E RZ616 with Wi-Fi 6E. However, we are currently unable to test its speed.

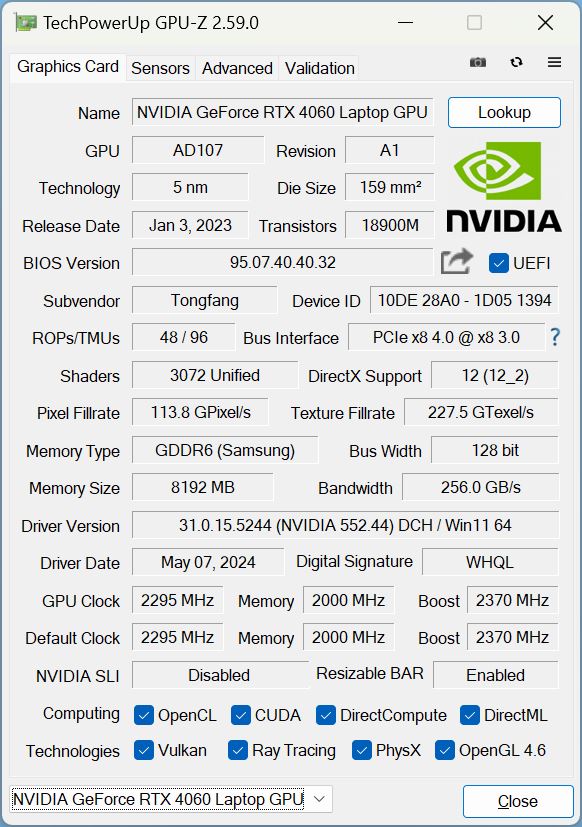
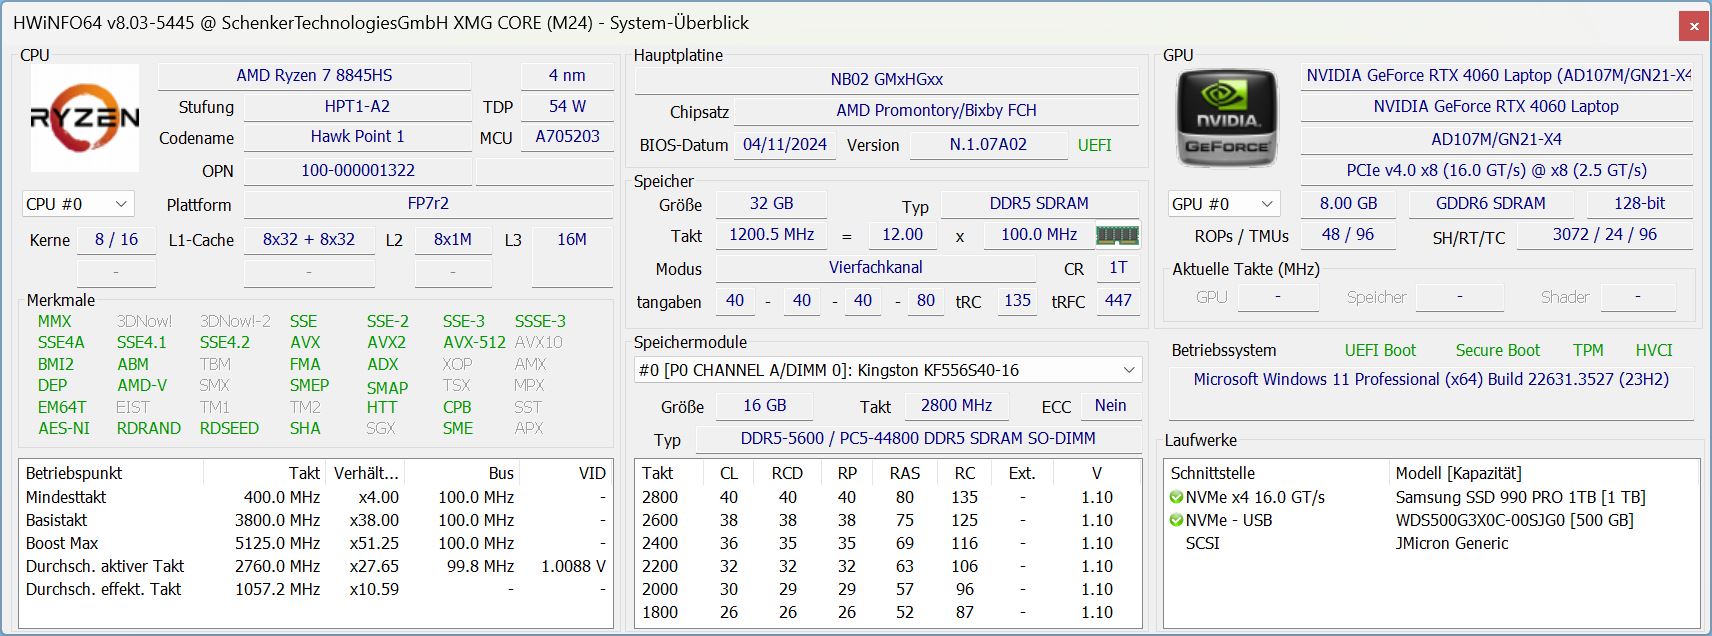
 NVIDIA GeForce RTX 4060 Laptop GPU, R7 8845HS, Samsung 990 Pro 1 TB")
 NVIDIA GeForce RTX 4060 Laptop GPU, R7 8845HS, Samsung 990 Pro 1 TB")
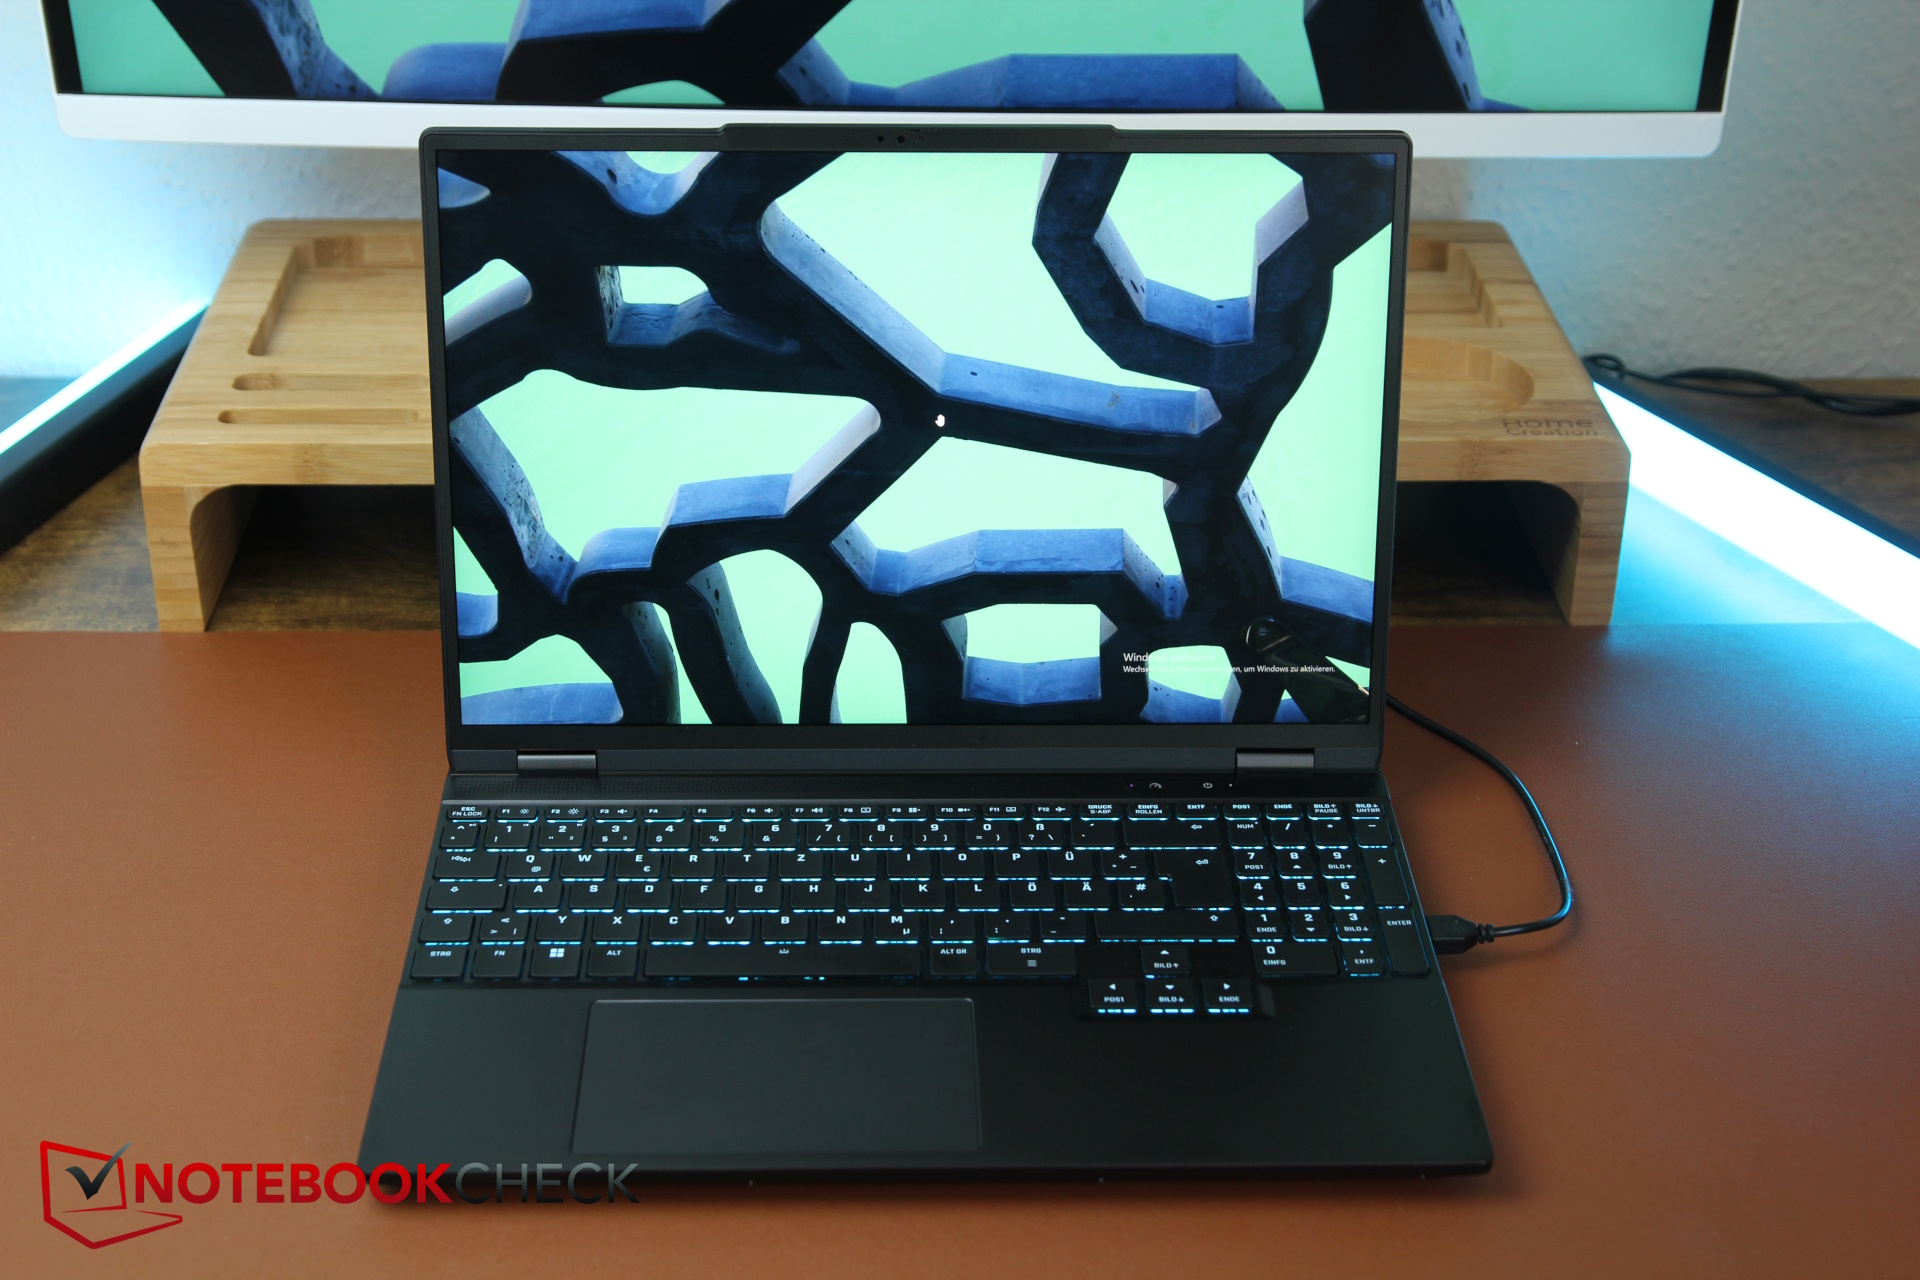
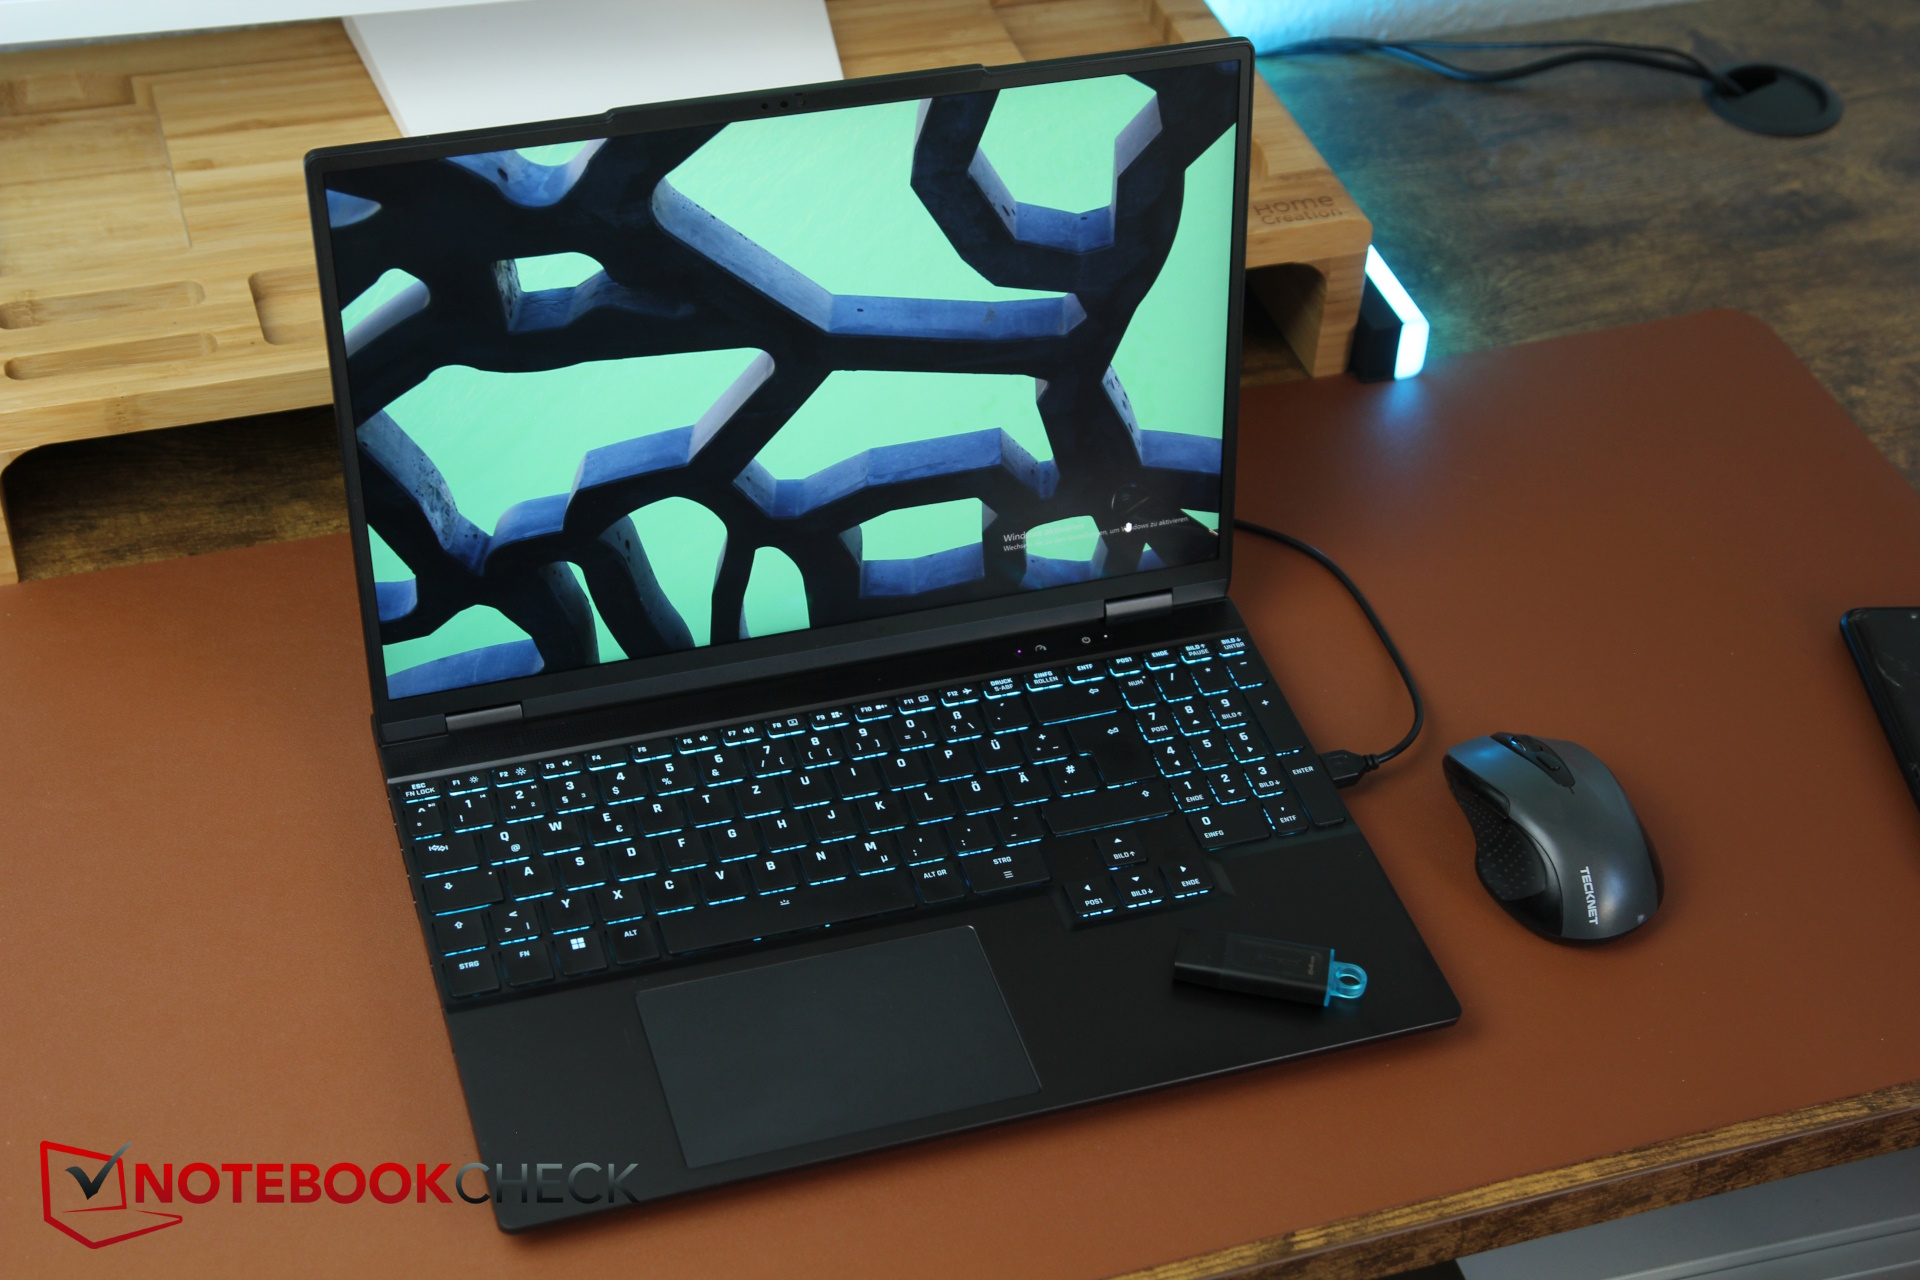
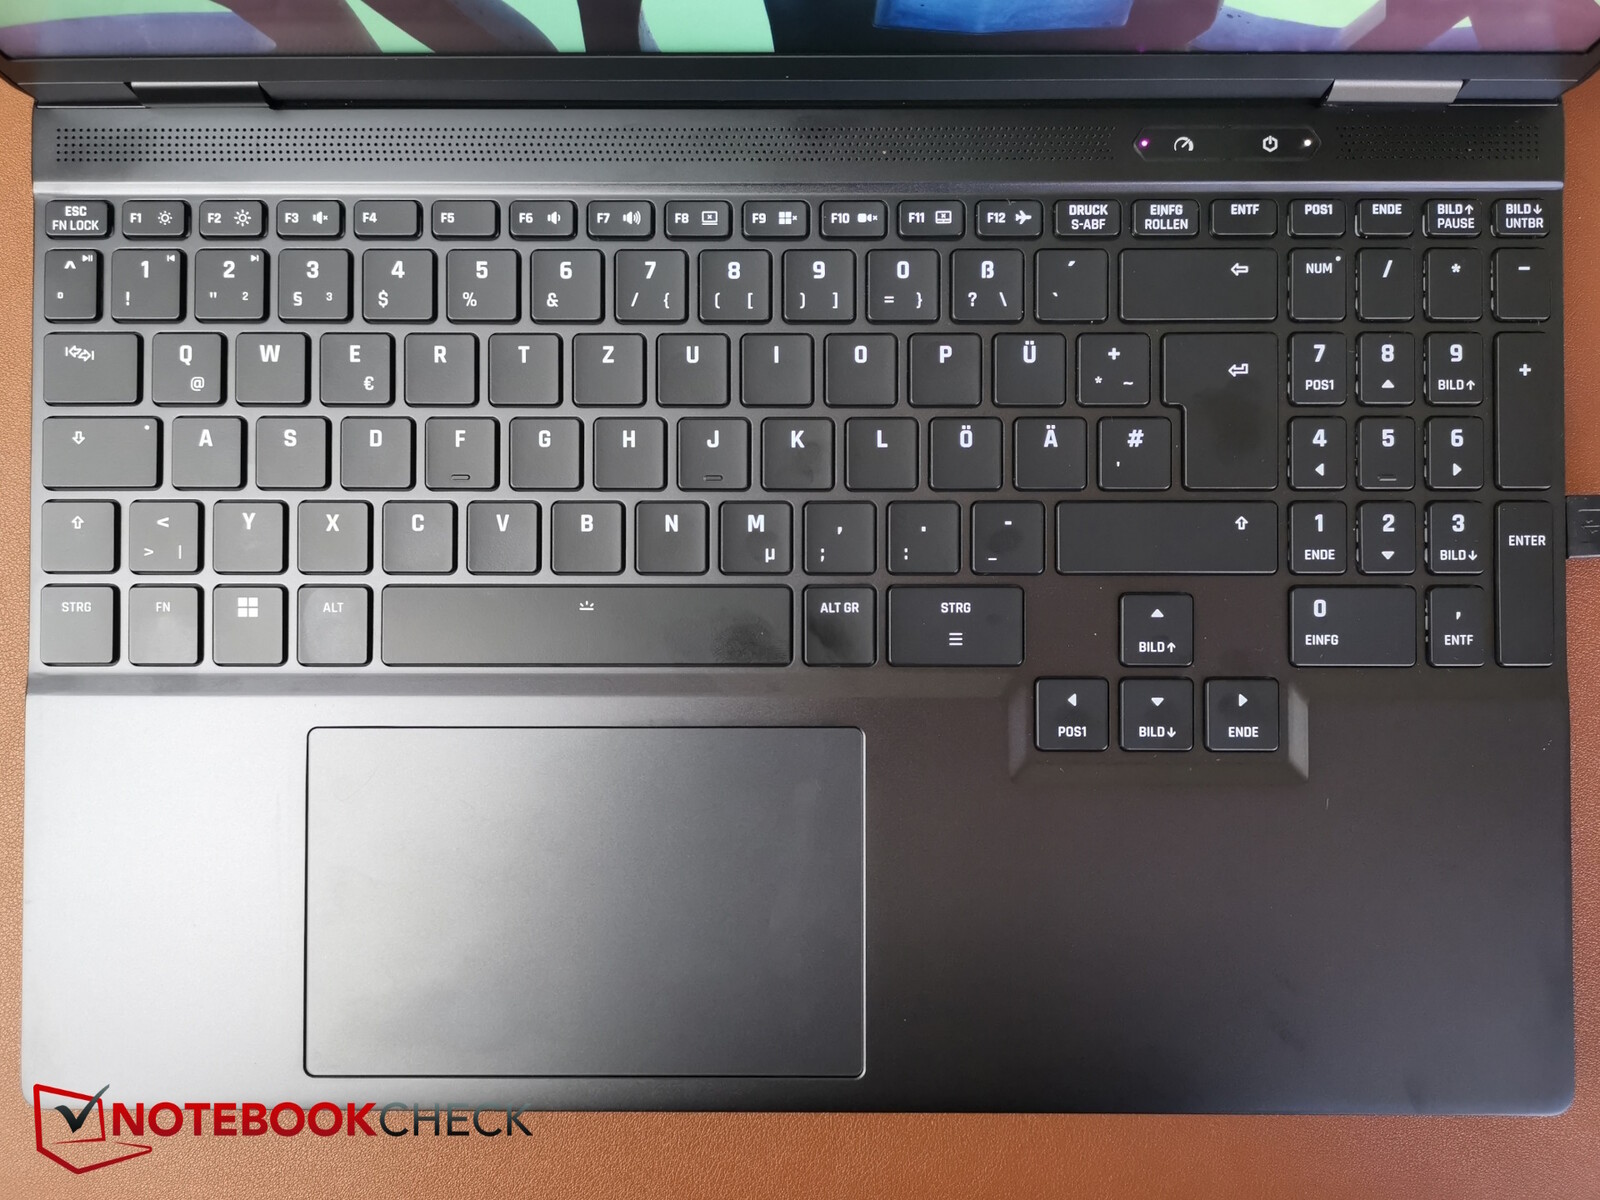
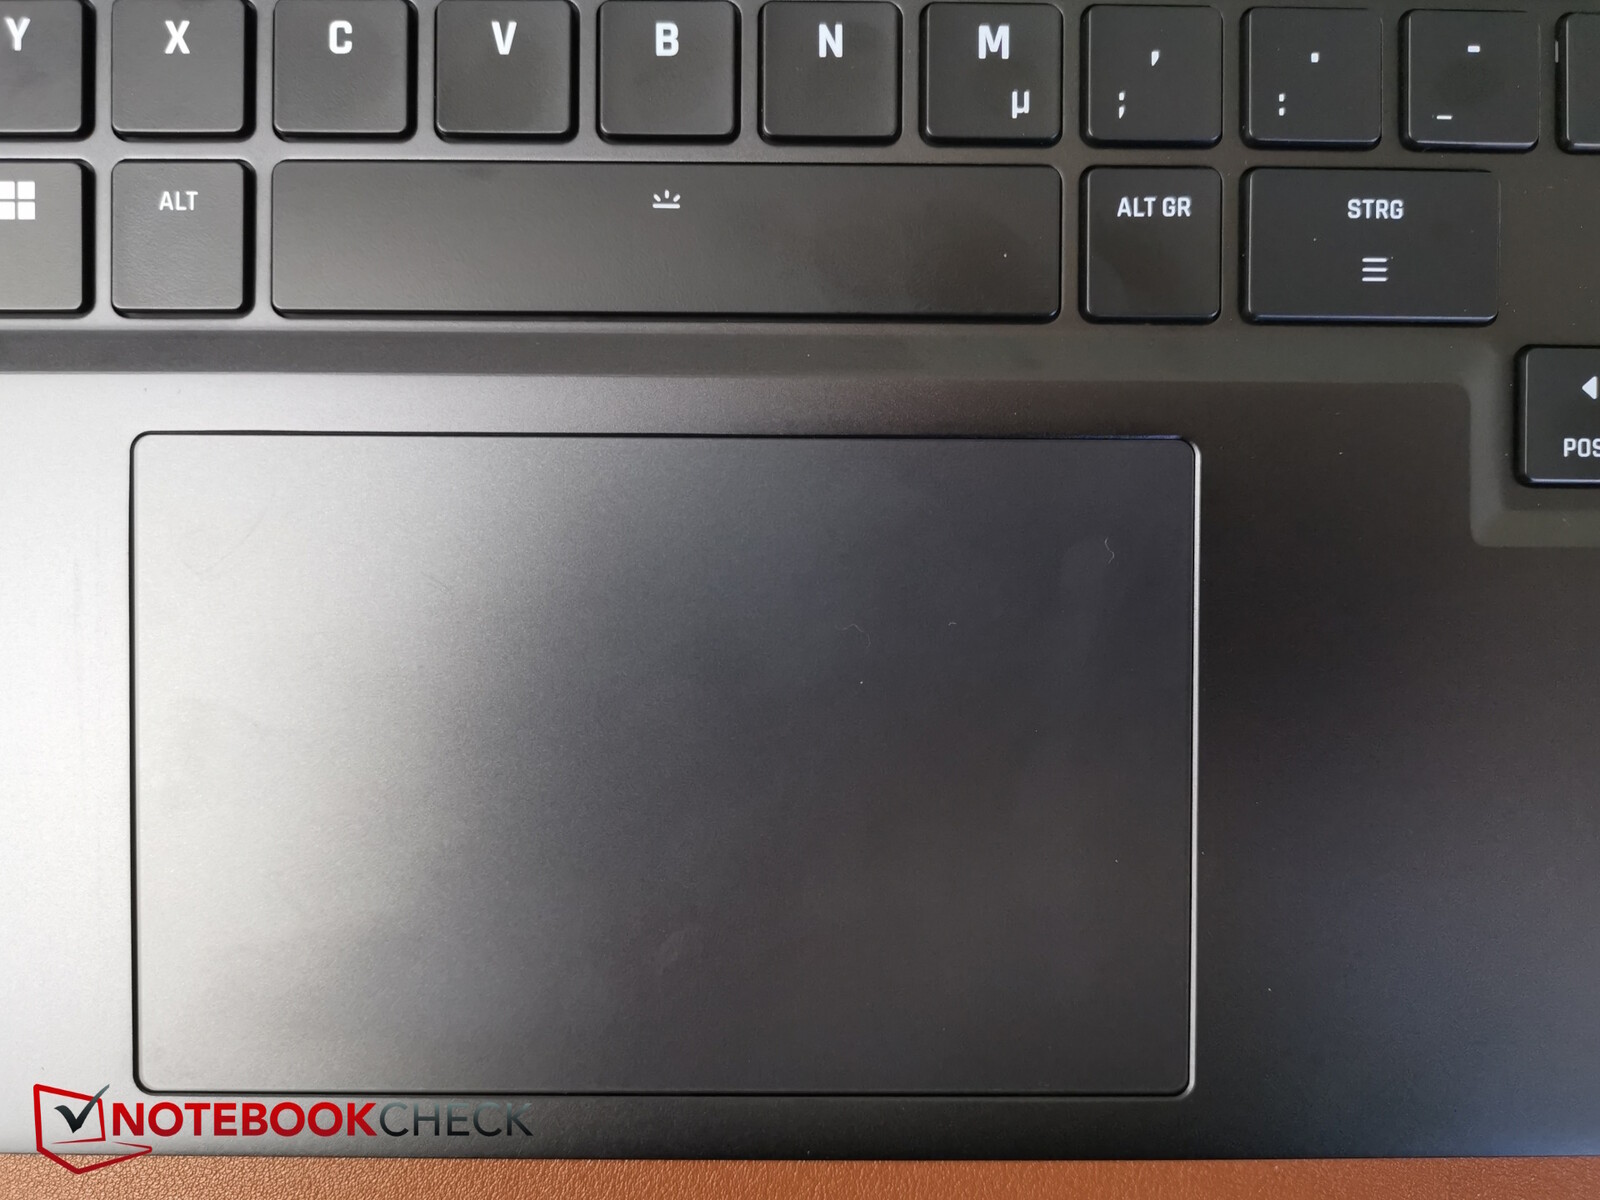
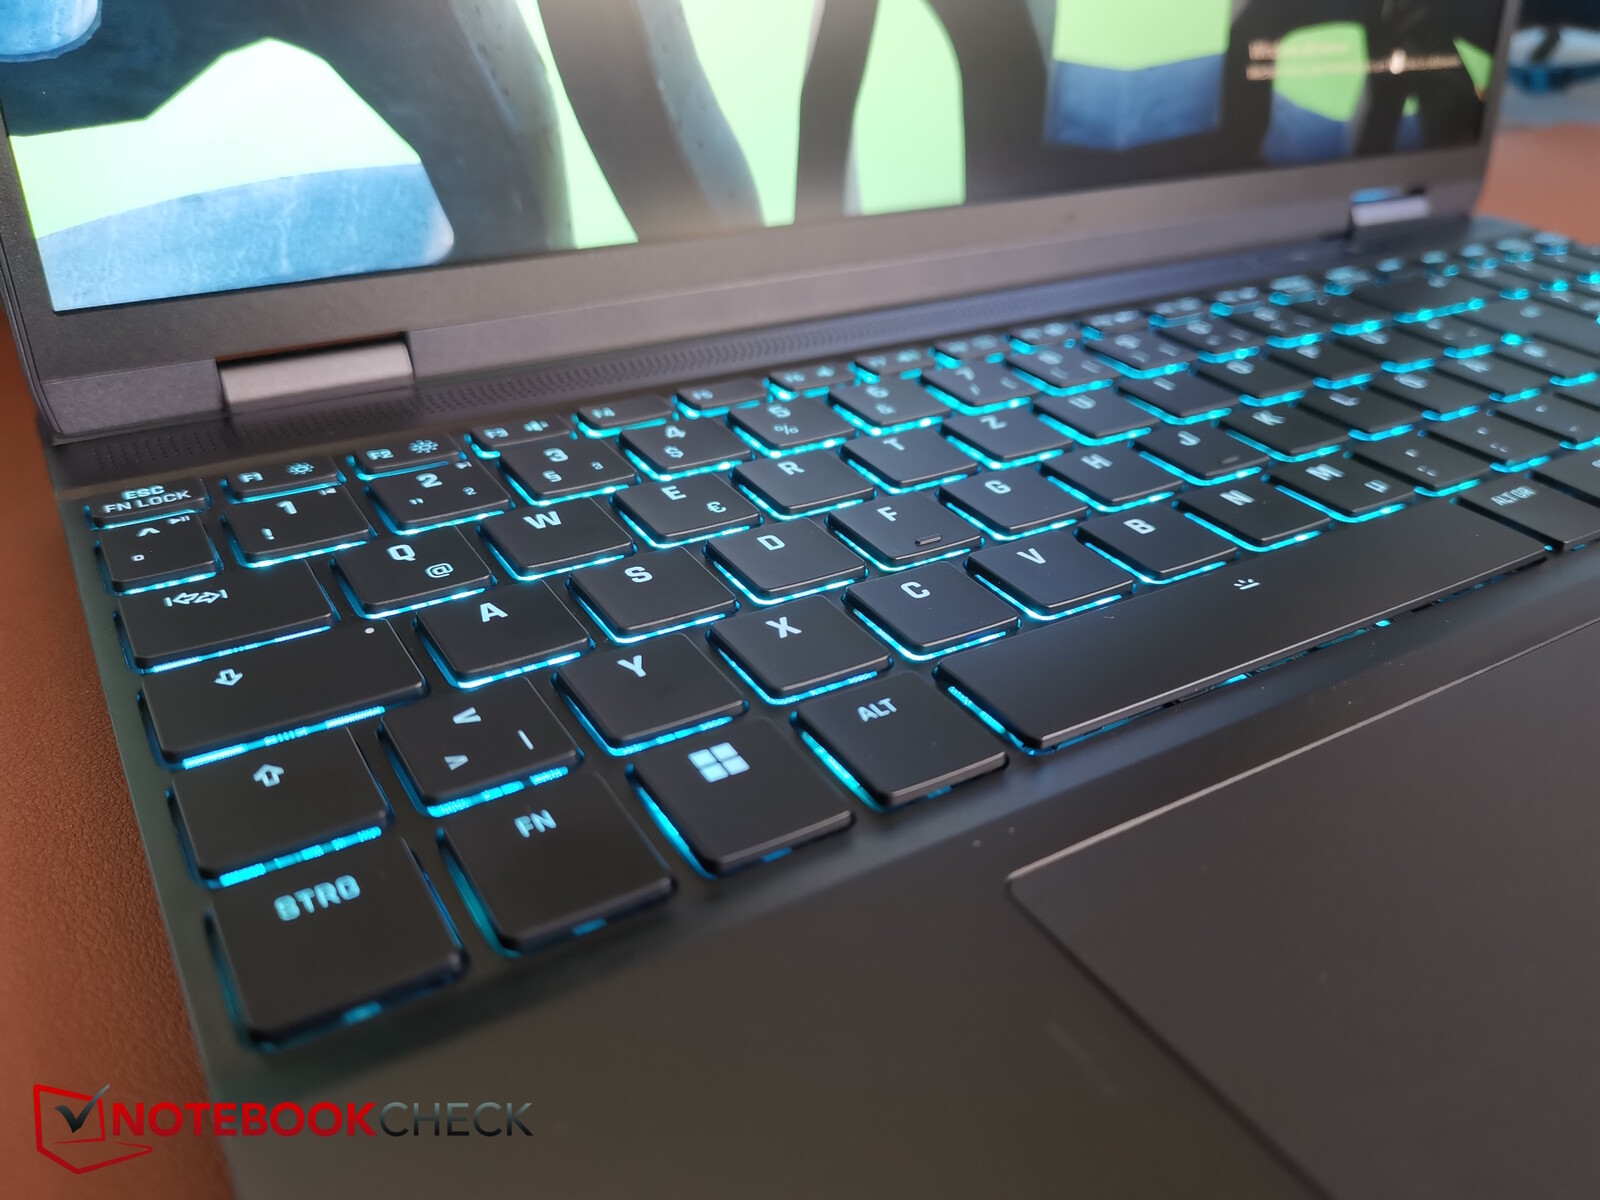
Input devices - Space used to the maximum
Unlike the Fusion 15, the Core 15 doesn't possess individual RGB key lighting. Instead, it just has one lighting zone. Although it doesn't allow for as many optional LED settings, everything is still visible.
The keyboard also lacks N key rollover as well as anti-ghosting, at least according to the data sheet. Nevertheless, the key with which you can switch performance profiles is on board.
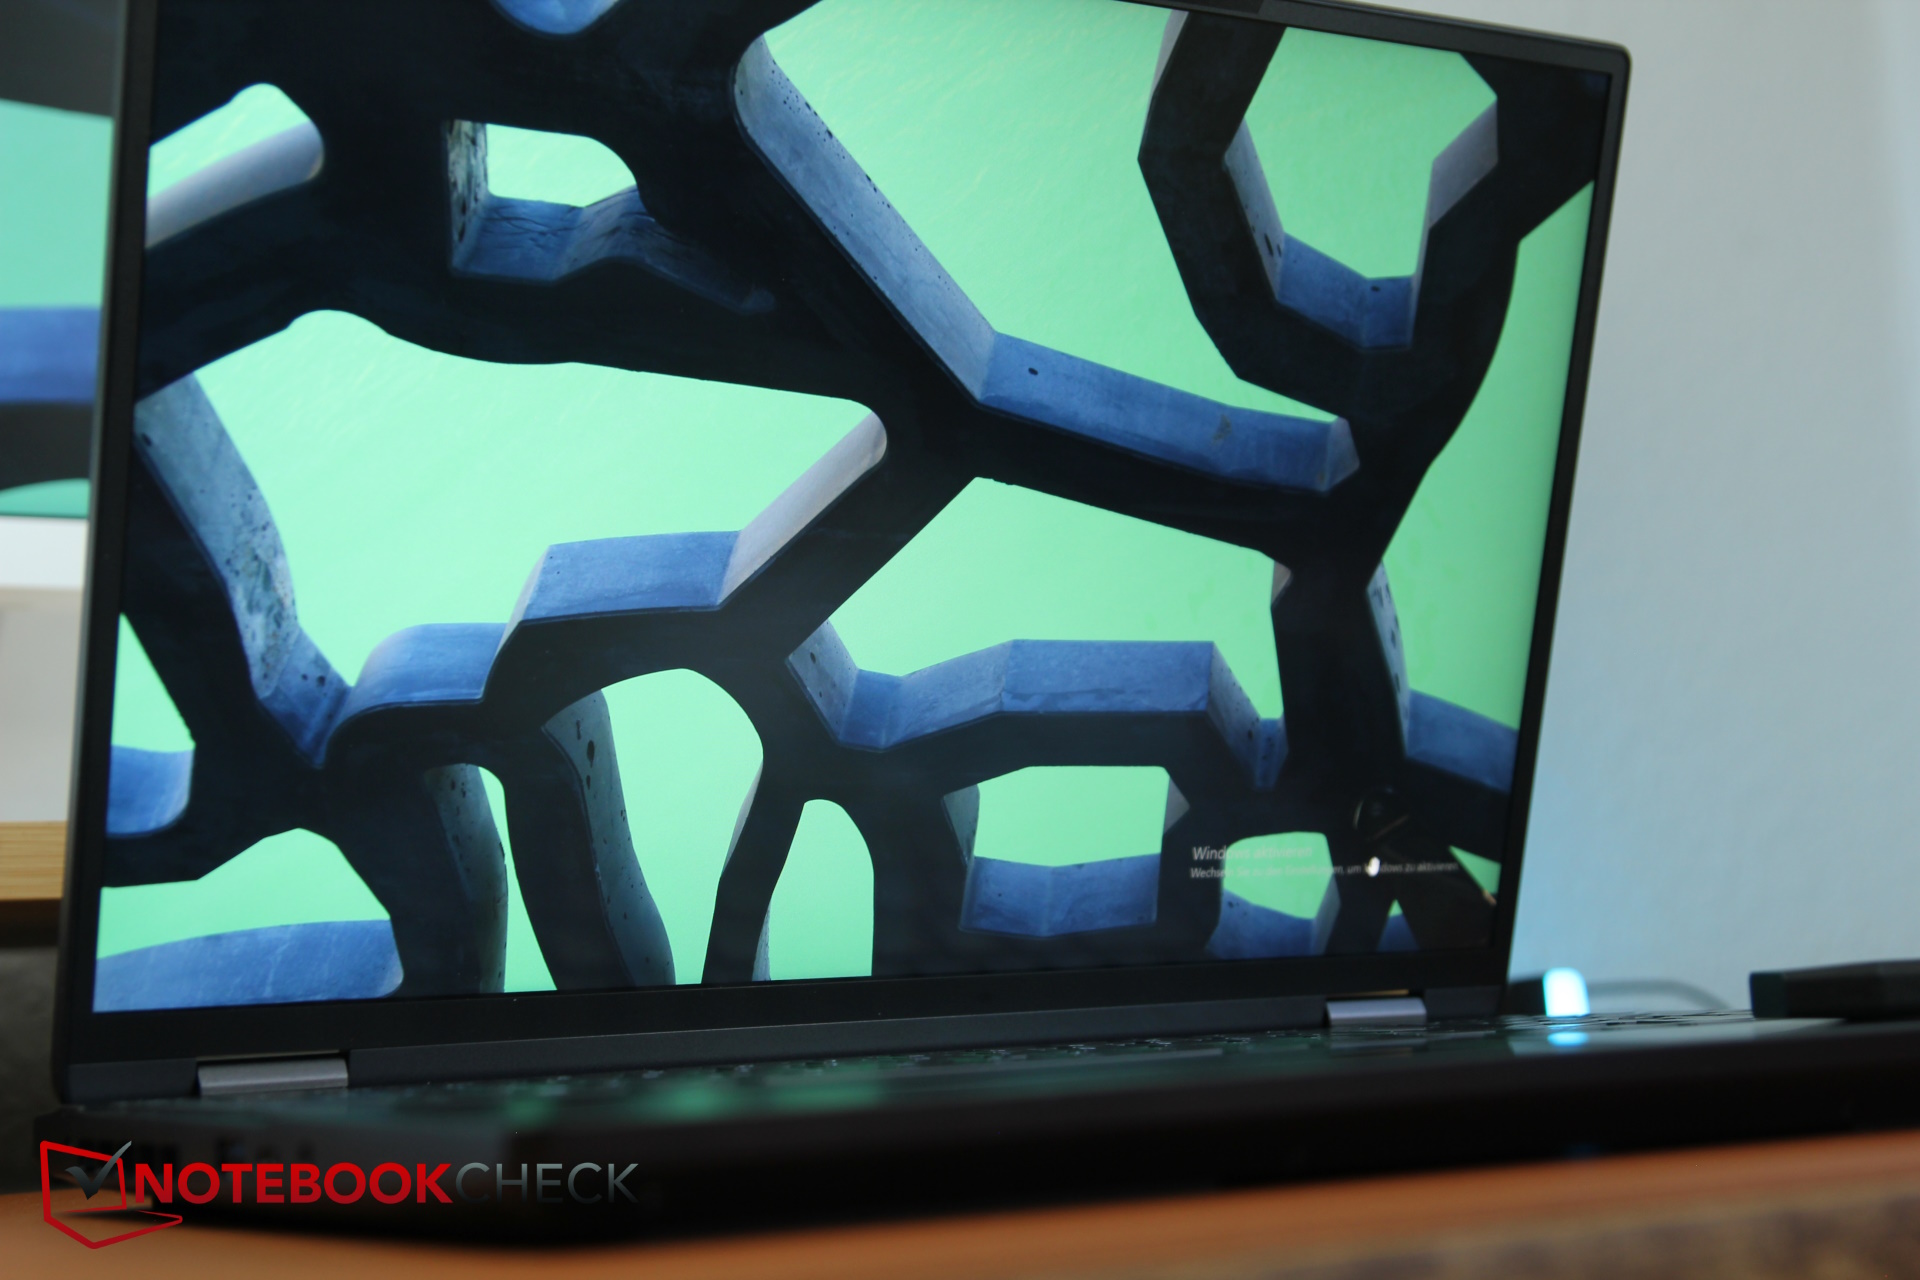
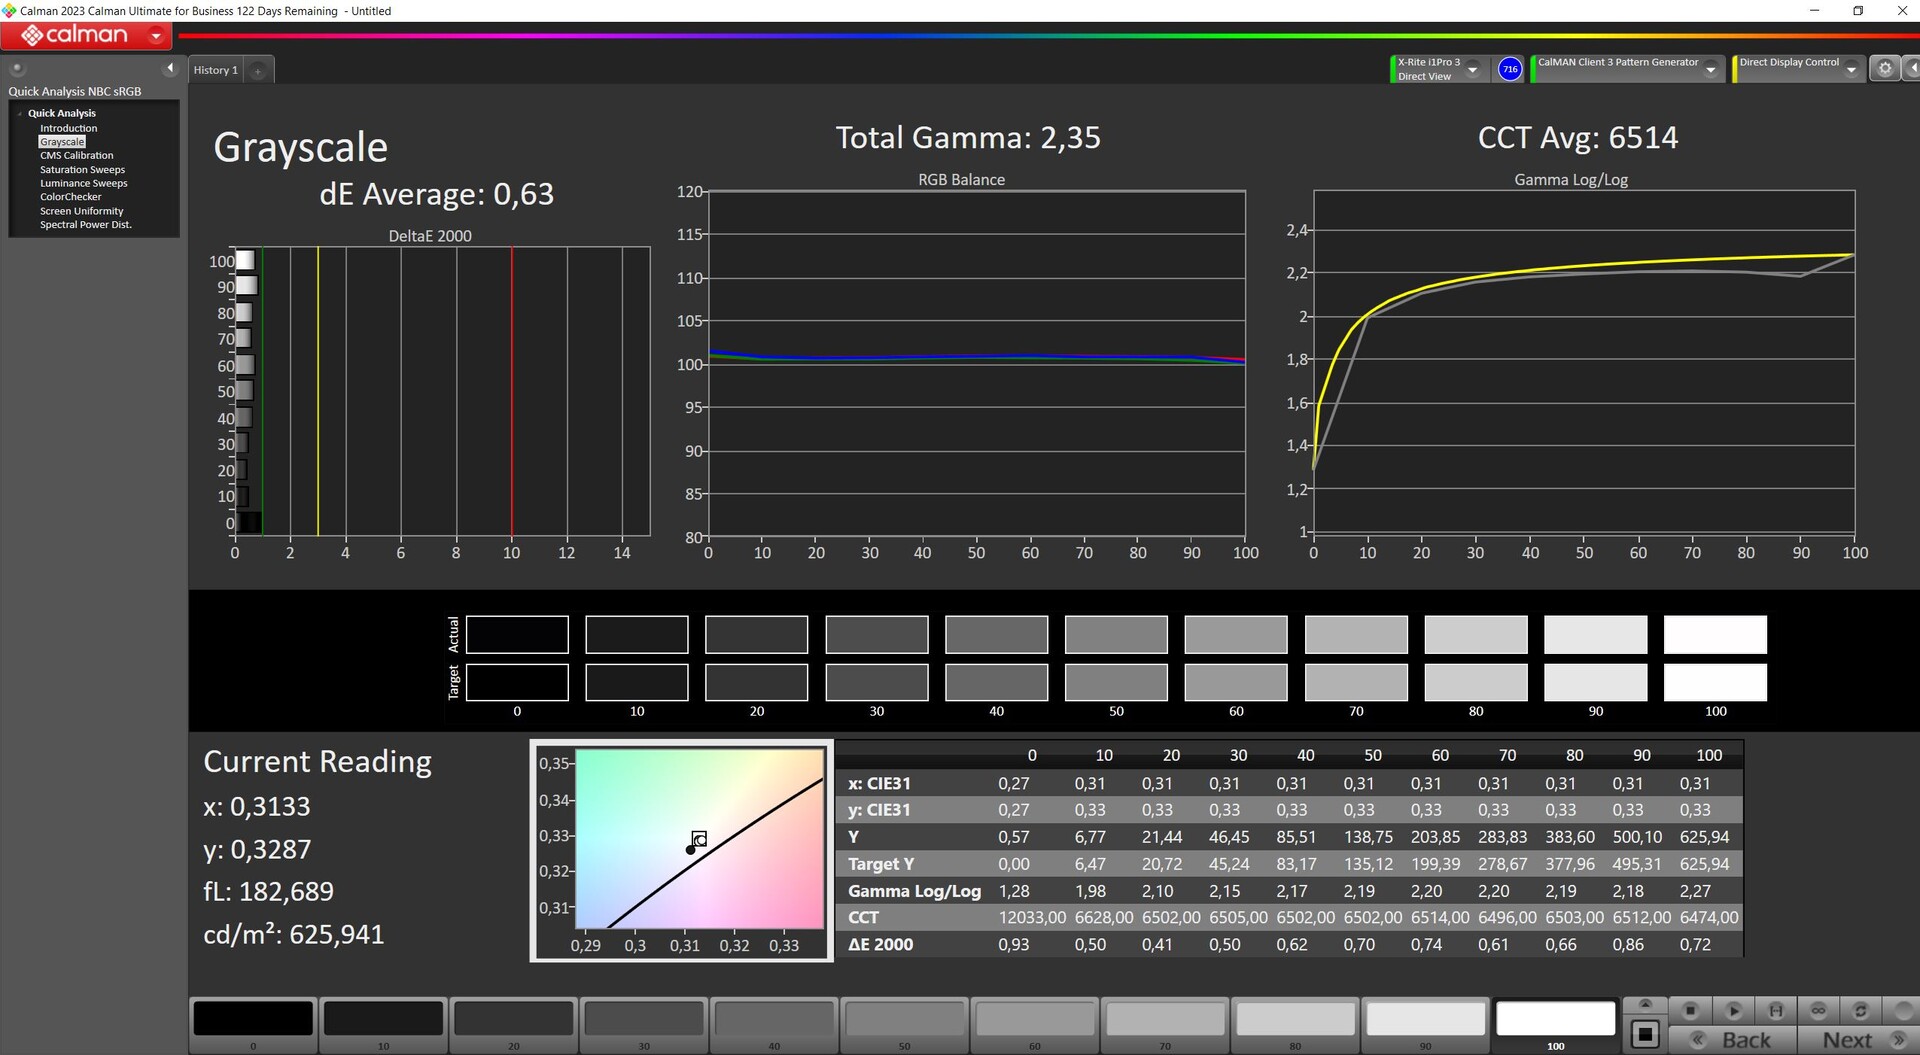
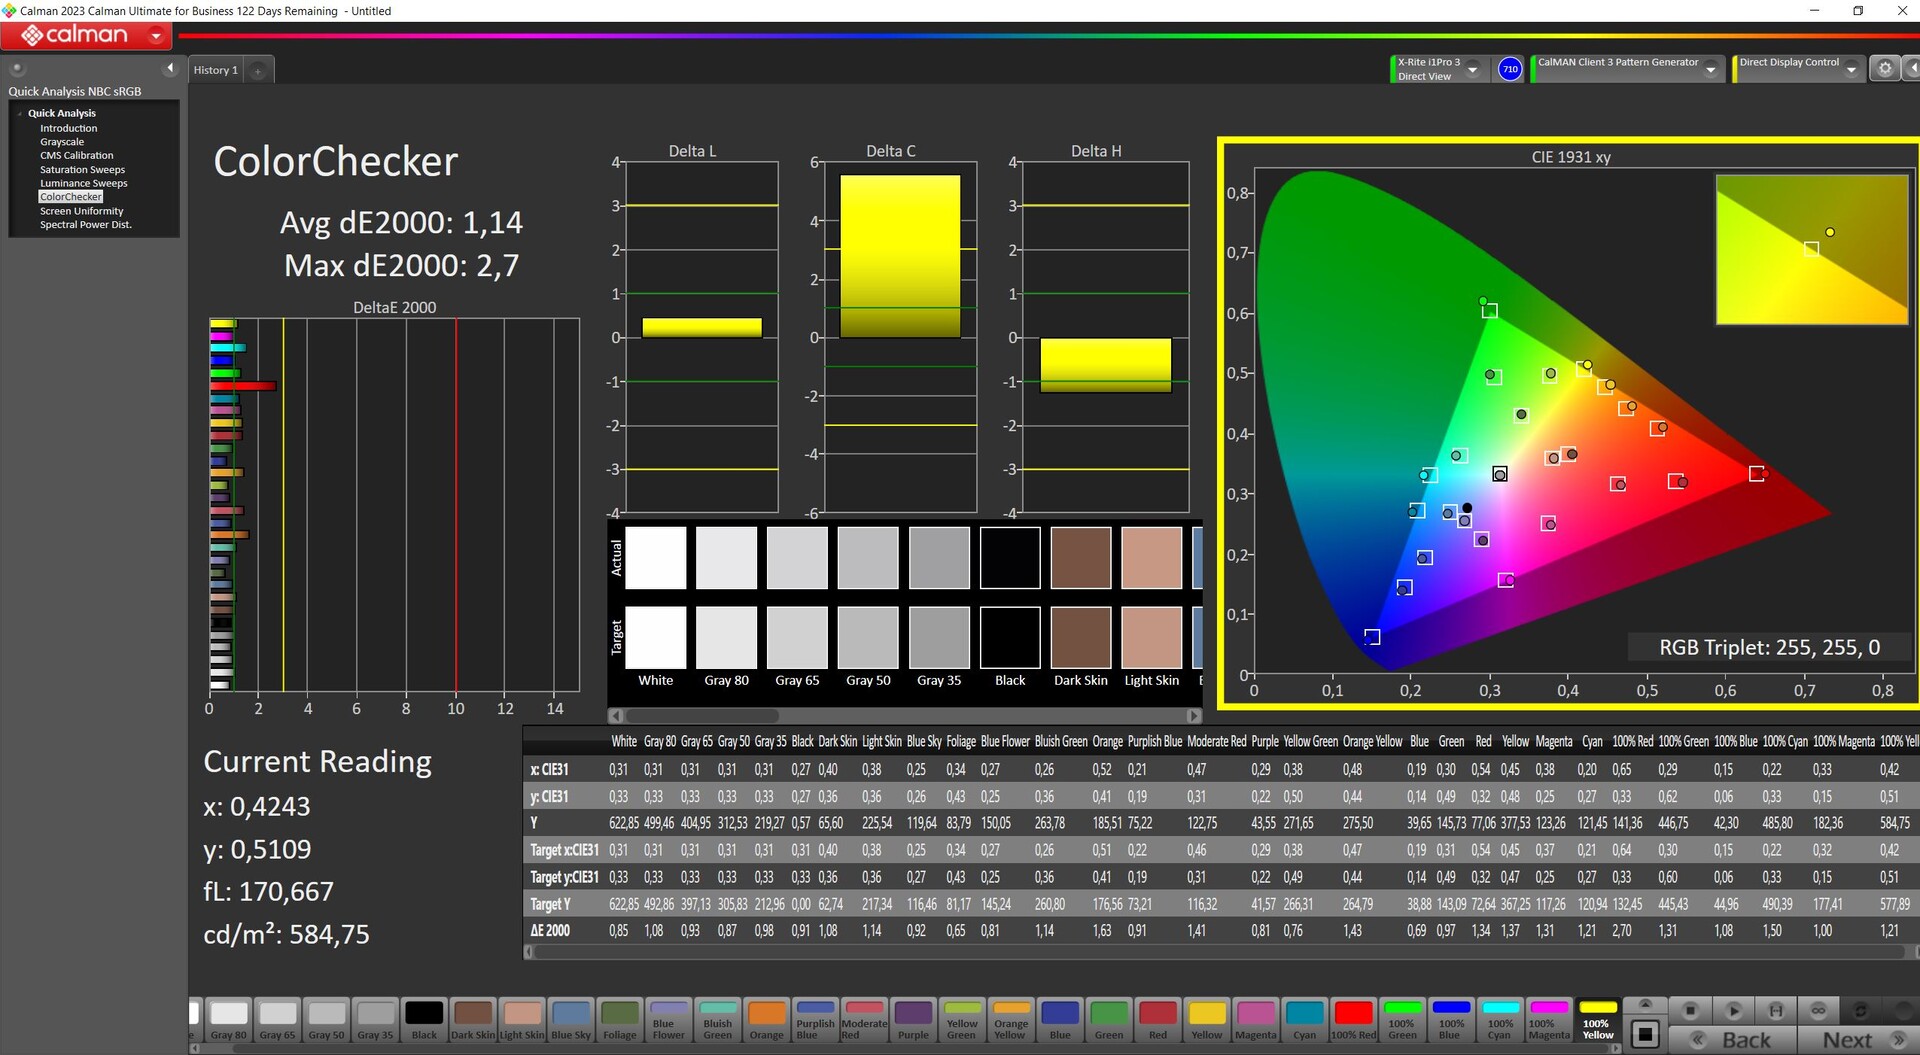
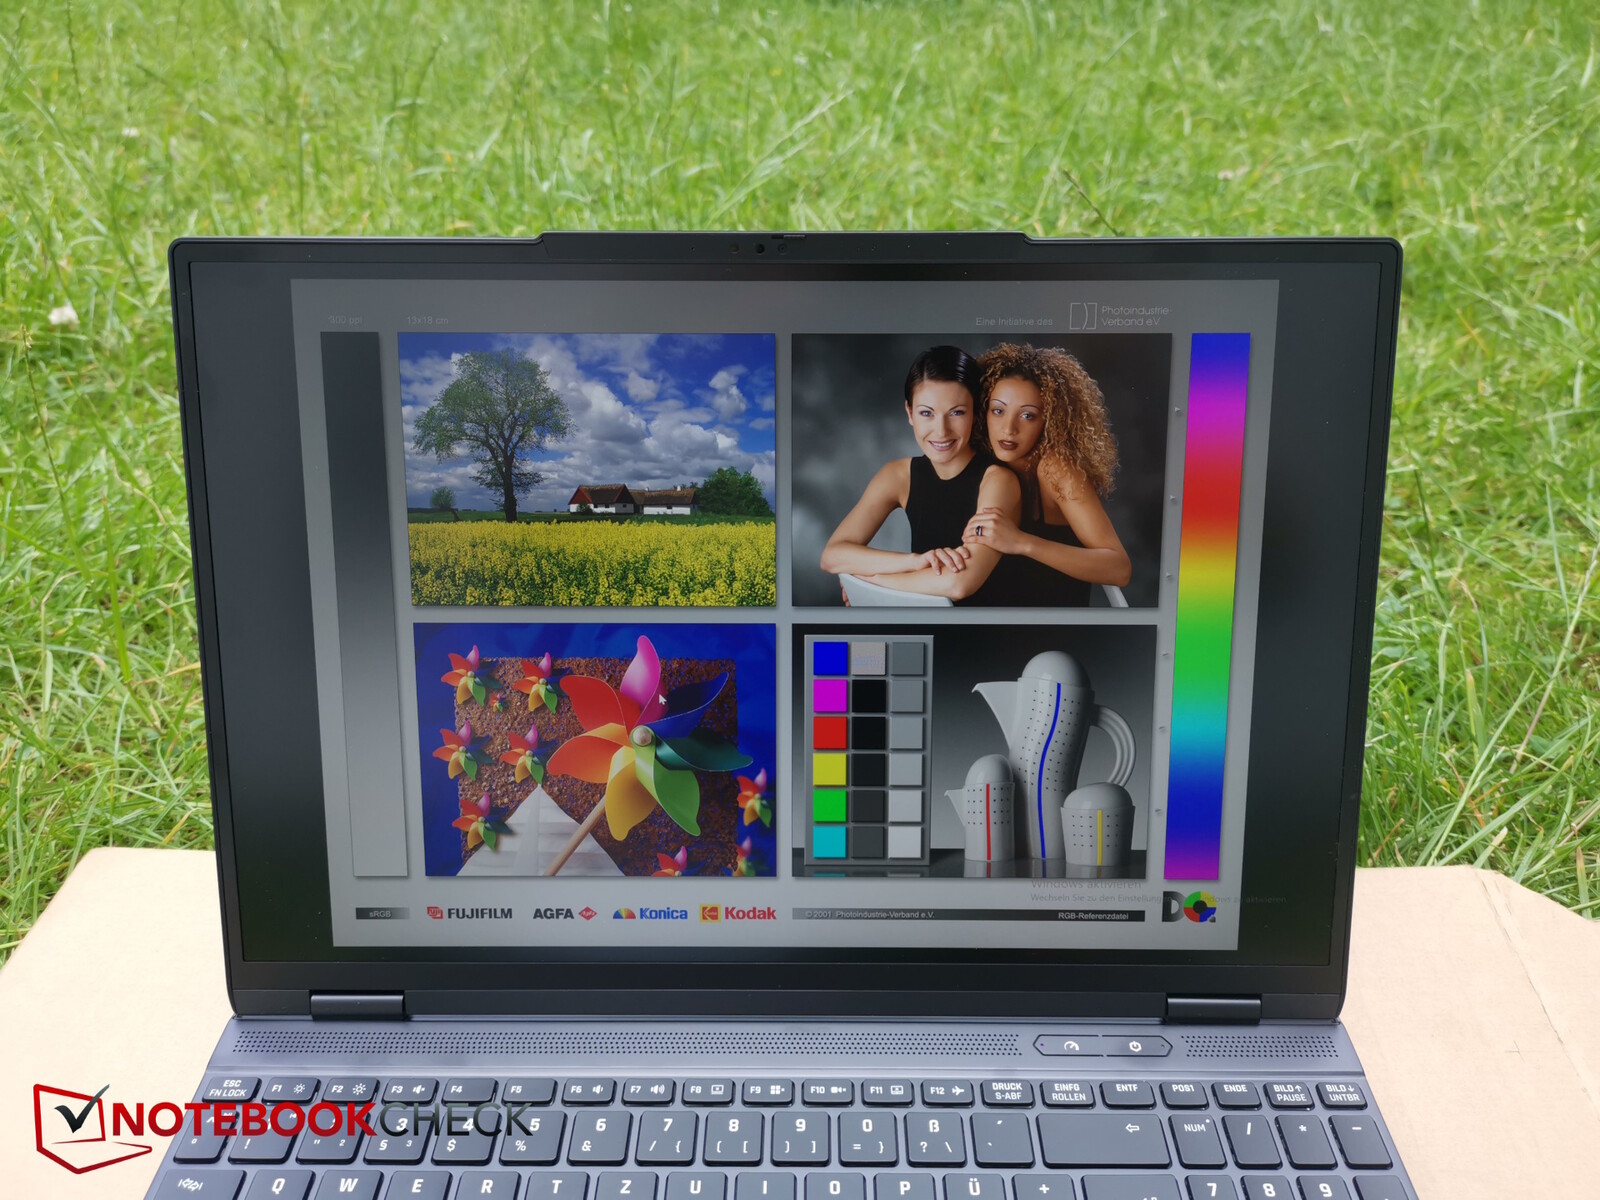
Display - 500 nits, sRGB, 1600p
The Core uses the same panel as the Fusion. Although we measured significantly higher brightness (600 vs. 460 nits) that comes at the cost of the black level with the contrast suffering, as a result.
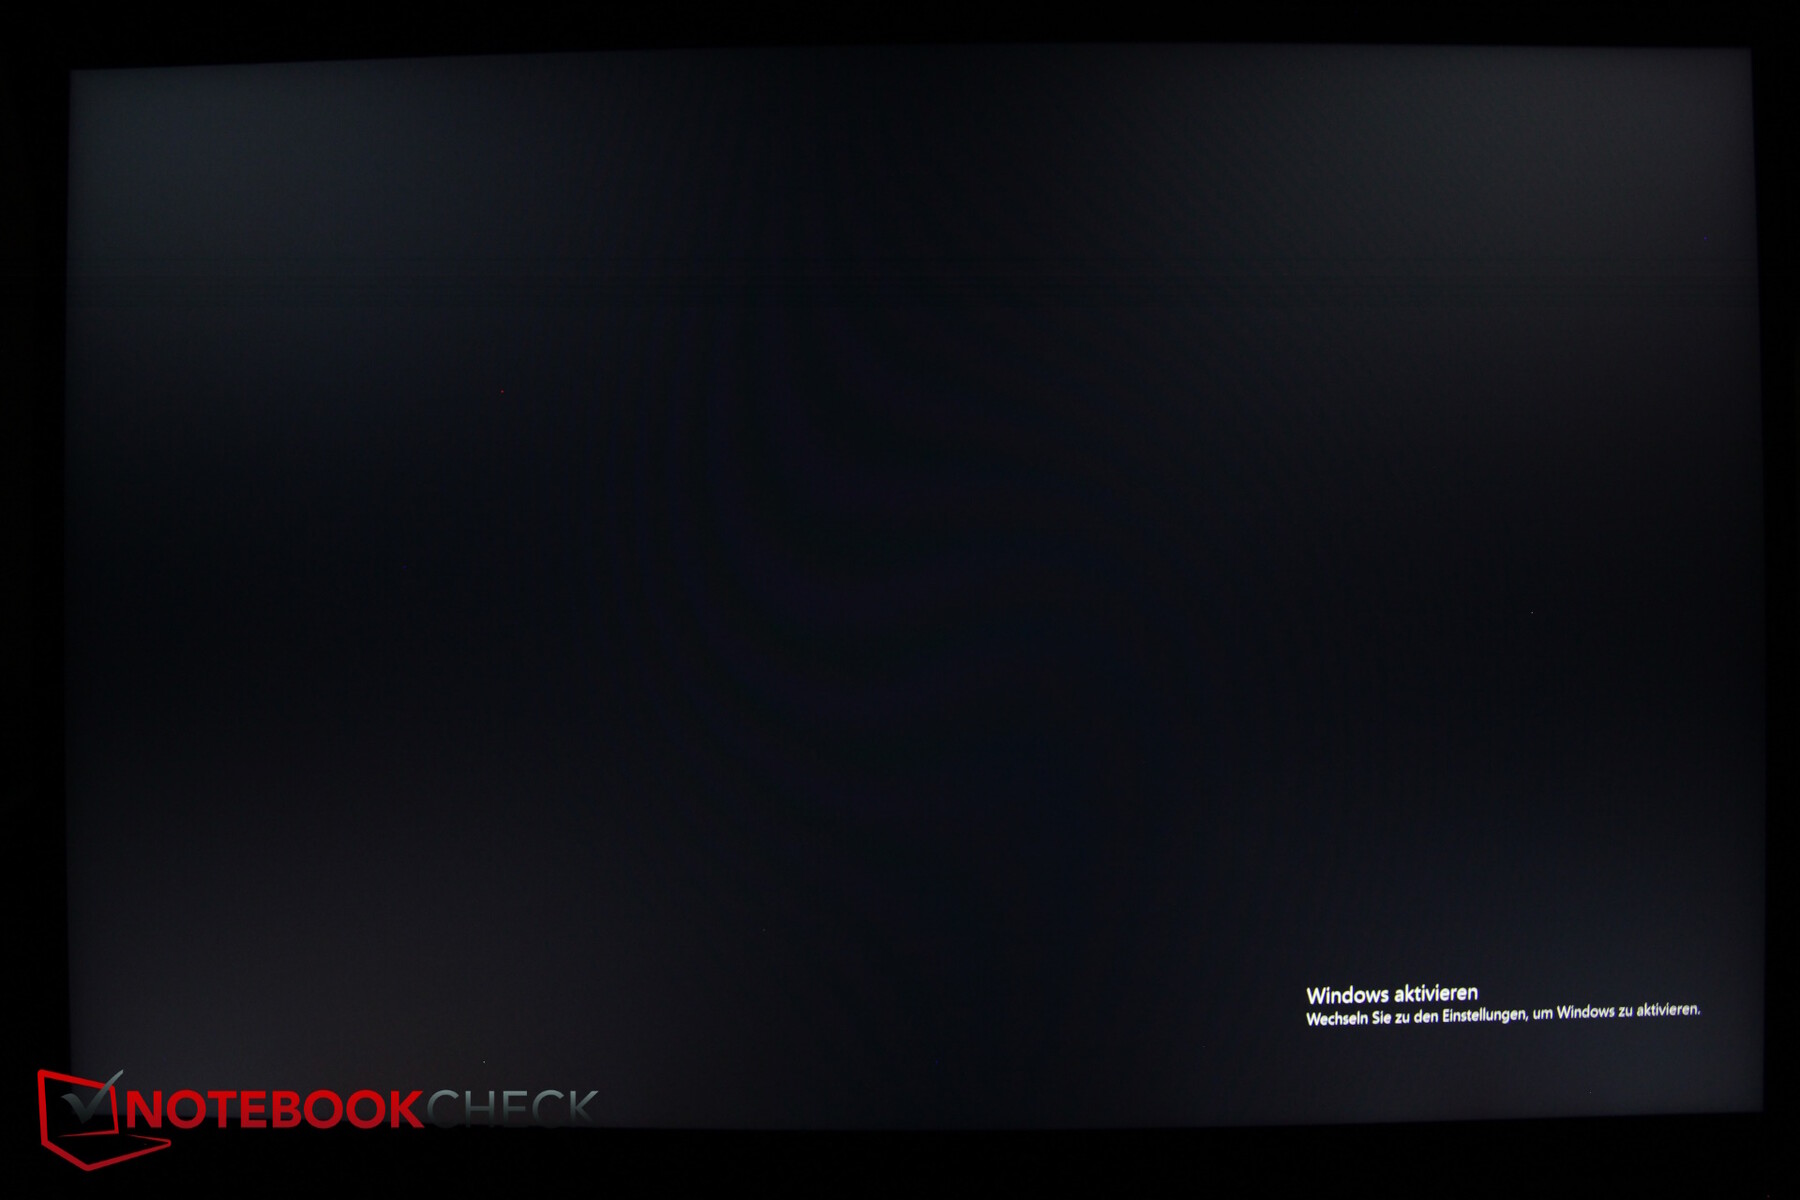
At minimum brightness, the display's backlighting is also too bright but is still illuminated quite evenly.
At around 45 percent brightness (150 nits), we measured 150 nits. With a darker display, the color accuracy and, it goes without saying, the black level are both a tick better
Unfortunately, there are no alternative display options but the display is bright, it has sufficiently fast response times, no PWM and, likewise, backlight bleeding is also not noticeable.
| |||||||||||||||||||||||||
Brightness Distribution: 91 %
Center on Battery: 635 cd/m²
Contrast: 992:1 (Black: 0.64 cd/m²)
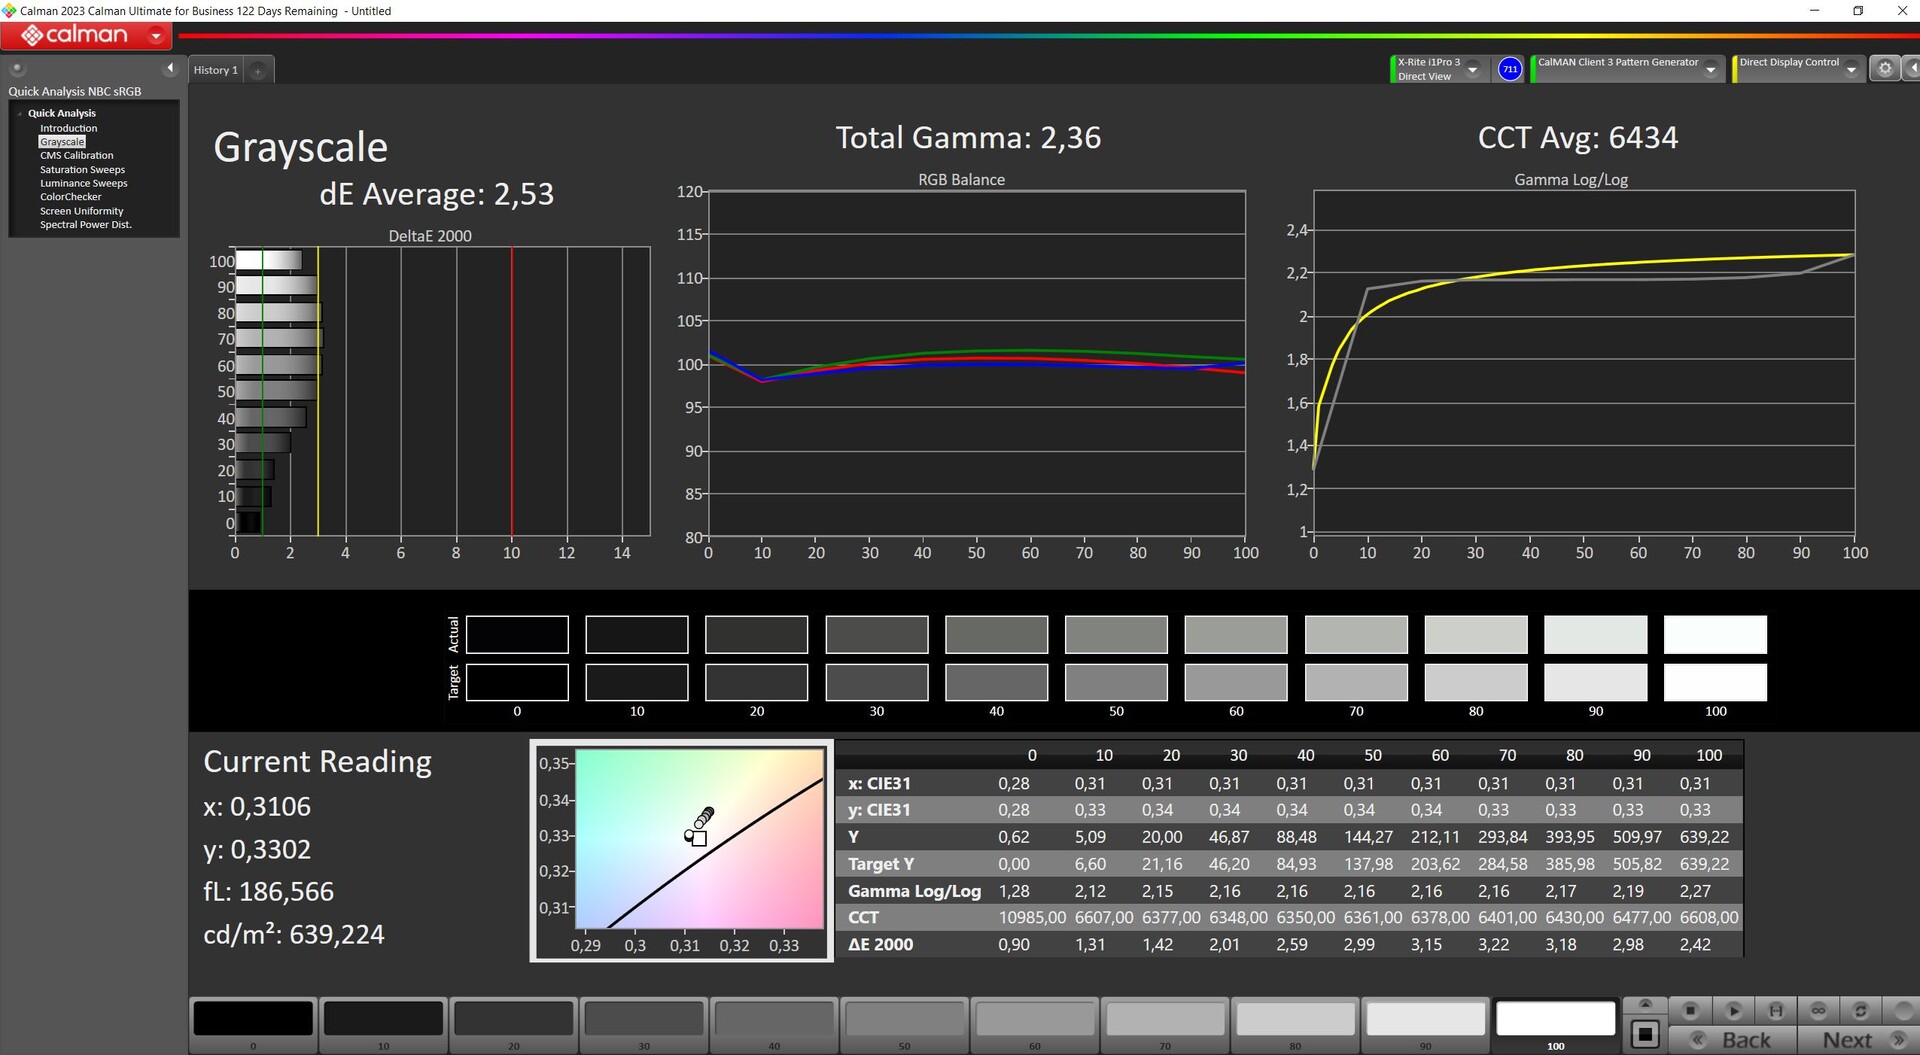
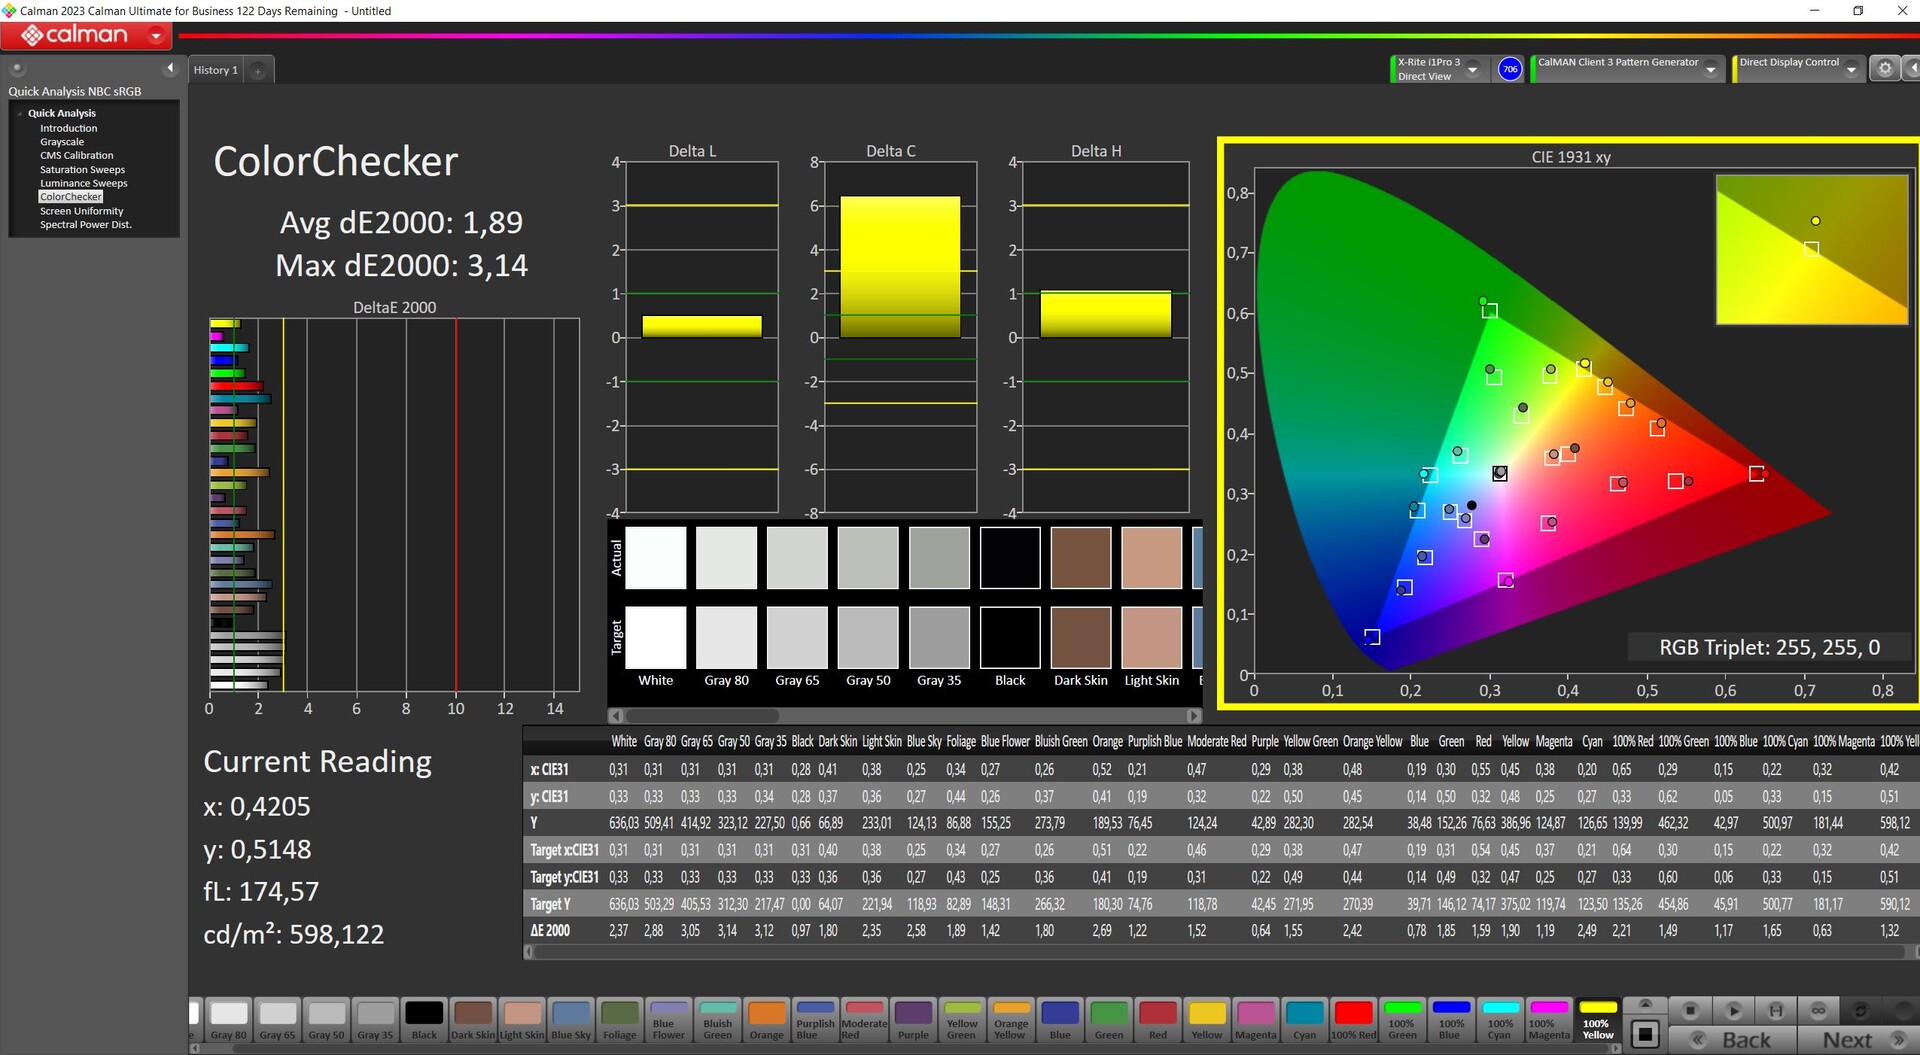
ΔE ColorChecker Calman: 1.89 | ∀{0.5-29.43 Ø4.81}
calibrated: 1.14
ΔE Greyscale Calman: 2.53 | ∀{0.09-98 Ø5.1}
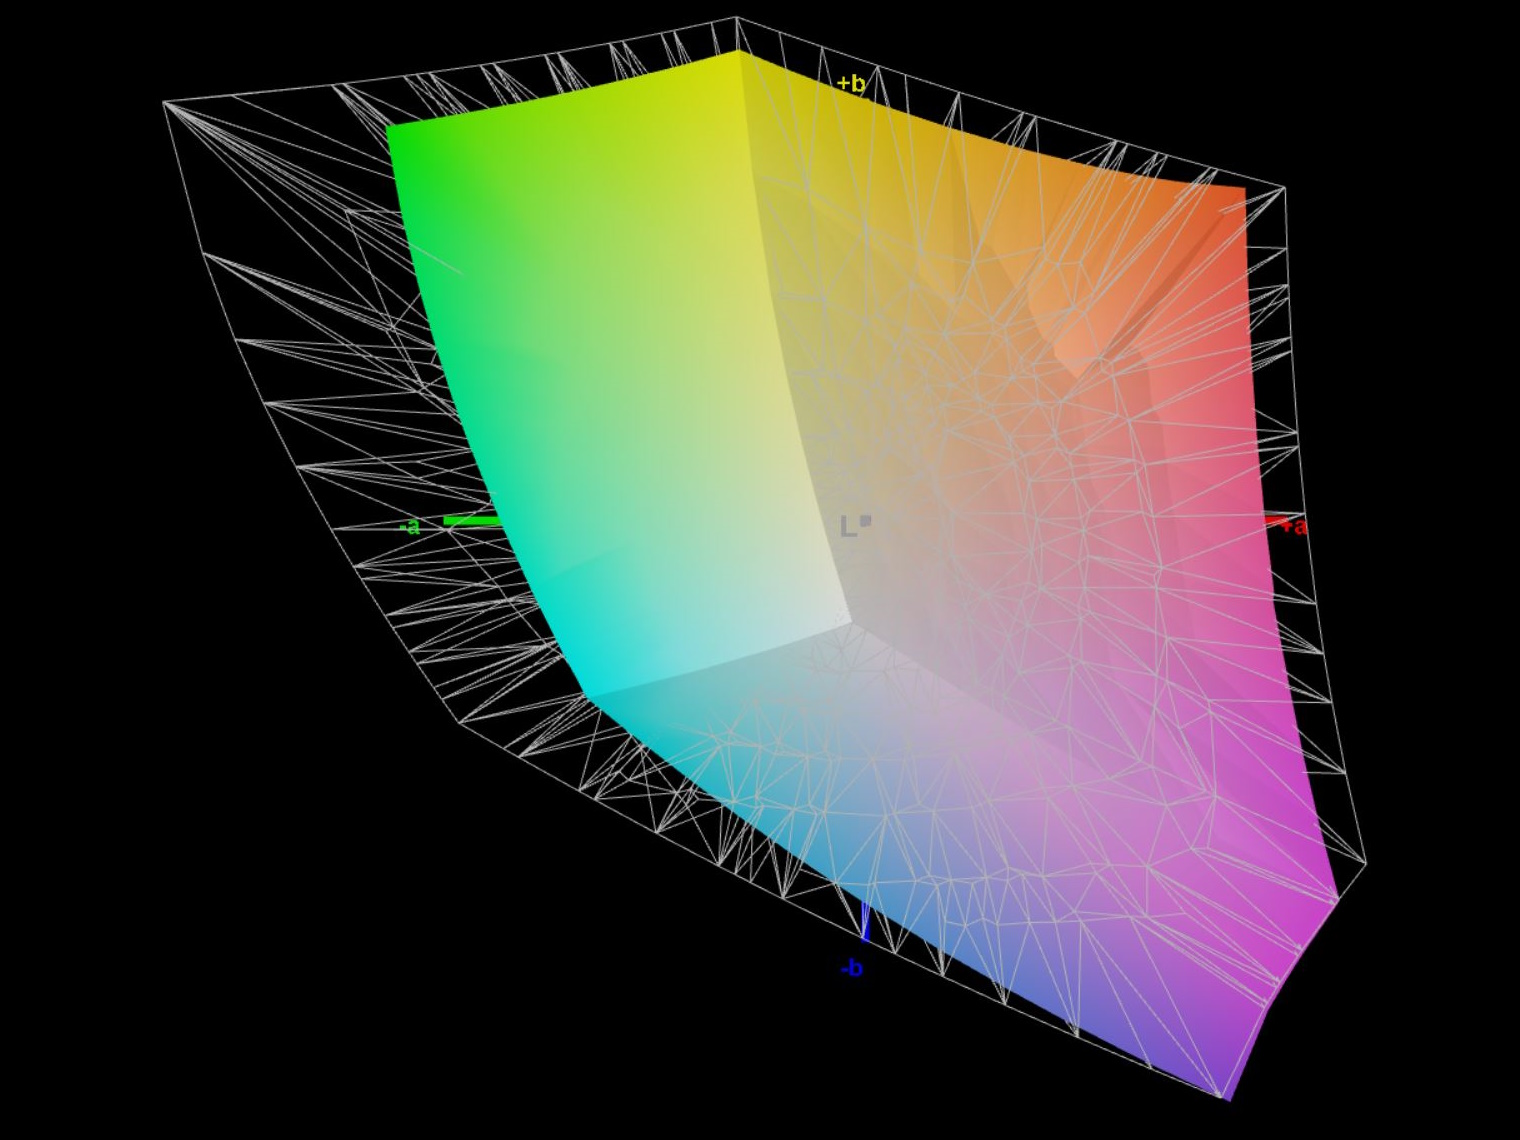
74.6% AdobeRGB 1998 (Argyll 3D)
100% sRGB (Argyll 3D)
73.2% Display P3 (Argyll 3D)
Gamma: 2.36
CCT: 6434 K
| SCHENKER XMG Core 15 (M24) BOE NJ NE153QDM-NZ1 (BOE0C8E), IPS, 2560x1600, 15.3" | Lenovo Legion 5 16IRX G9 NE160QDM-NZ3, IPS, 2560x1600, 16" | HP Victus 16 (2024) Chi Mei CMN163E, IPS, 1920x1080, 16.1" | Dell G16, i7-13650HX, RTX 4060 Chi Mei CMN161D (160GME), IPS, 2560x1600, 16" | SCHENKER XMG Fusion 15 (Early 24) BOE NJ NE153QDM-NZ1, IPS, 2560x1600, 15.3" | SCHENKER XMG Pro 15 (E23) BOE0AD1, IPS, 2560x1440, 15.6" | |
|---|---|---|---|---|---|---|
| Display | -1% | -42% | -5% | 0% | 16% | |
| Display P3 Coverage (%) | 73.2 | 72.4 -1% | 41.3 -44% | 67.5 -8% | 73.5 0% | 97.8 34% |
| sRGB Coverage (%) | 100 | 100 0% | 61.7 -38% | 98.5 -1% | 100 0% | 99.9 0% |
| AdobeRGB 1998 Coverage (%) | 74.6 | 74.1 -1% | 42.7 -43% | 69.3 -7% | 75 1% | 85.4 14% |
| Response Times | -13% | -151% | 4% | 46% | -25% | |
| Response Time Grey 50% / Grey 80% * (ms) | 9.6 ? | 12.5 ? -30% | 28.6 ? -198% | 7.6 ? 21% | 5 ? 48% | 14 ? -46% |
| Response Time Black / White * (ms) | 9.2 ? | 8.7 ? 5% | 18.7 ? -103% | 10.4 ? -13% | 5.2 ? 43% | 9.6 ? -4% |
| PWM Frequency (Hz) | ||||||
| Screen | 22% | -114% | -29% | -11% | -24% | |
| Brightness middle (cd/m²) | 635 | 526 -17% | 287 -55% | 369 -42% | 491 -23% | 322 -49% |
| Brightness (cd/m²) | 604 | 500 -17% | 288 -52% | 344 -43% | 460 -24% | 301 -50% |
| Brightness Distribution (%) | 91 | 87 -4% | 86 -5% | 89 -2% | 89 -2% | 85 -7% |
| Black Level * (cd/m²) | 0.64 | 0.33 48% | 0.19 70% | 0.26 59% | 0.47 27% | 0.36 44% |
| Contrast (:1) | 992 | 1594 61% | 1511 52% | 1419 43% | 1045 5% | 894 -10% |
| Colorchecker dE 2000 * | 1.89 | 1.2 37% | 5.46 -189% | 3.04 -61% | 2.16 -14% | 1.98 -5% |
| Colorchecker dE 2000 max. * | 3.14 | 2.1 33% | 20.36 -548% | 5.56 -77% | 4.44 -41% | 5.24 -67% |
| Colorchecker dE 2000 calibrated * | 1.14 | 1 12% | 3.52 -209% | 2.35 -106% | 1.14 -0% | 1.98 -74% |
| Greyscale dE 2000 * | 2.53 | 1.3 49% | 4.8 -90% | 3.38 -34% | 3.3 -30% | 2.44 4% |
| Gamma | 2.36 93% | 2.23 99% | 2.108 104% | 2.47 89% | 2.204 100% | 2.42 91% |
| CCT | 6434 101% | 6391 102% | 6442 101% | 6040 108% | 6286 103% | 6984 93% |
| Total Average (Program / Settings) | 3% /
13% | -102% /
-104% | -10% /
-19% | 12% /
-1% | -11% /
-15% |
* ... smaller is better
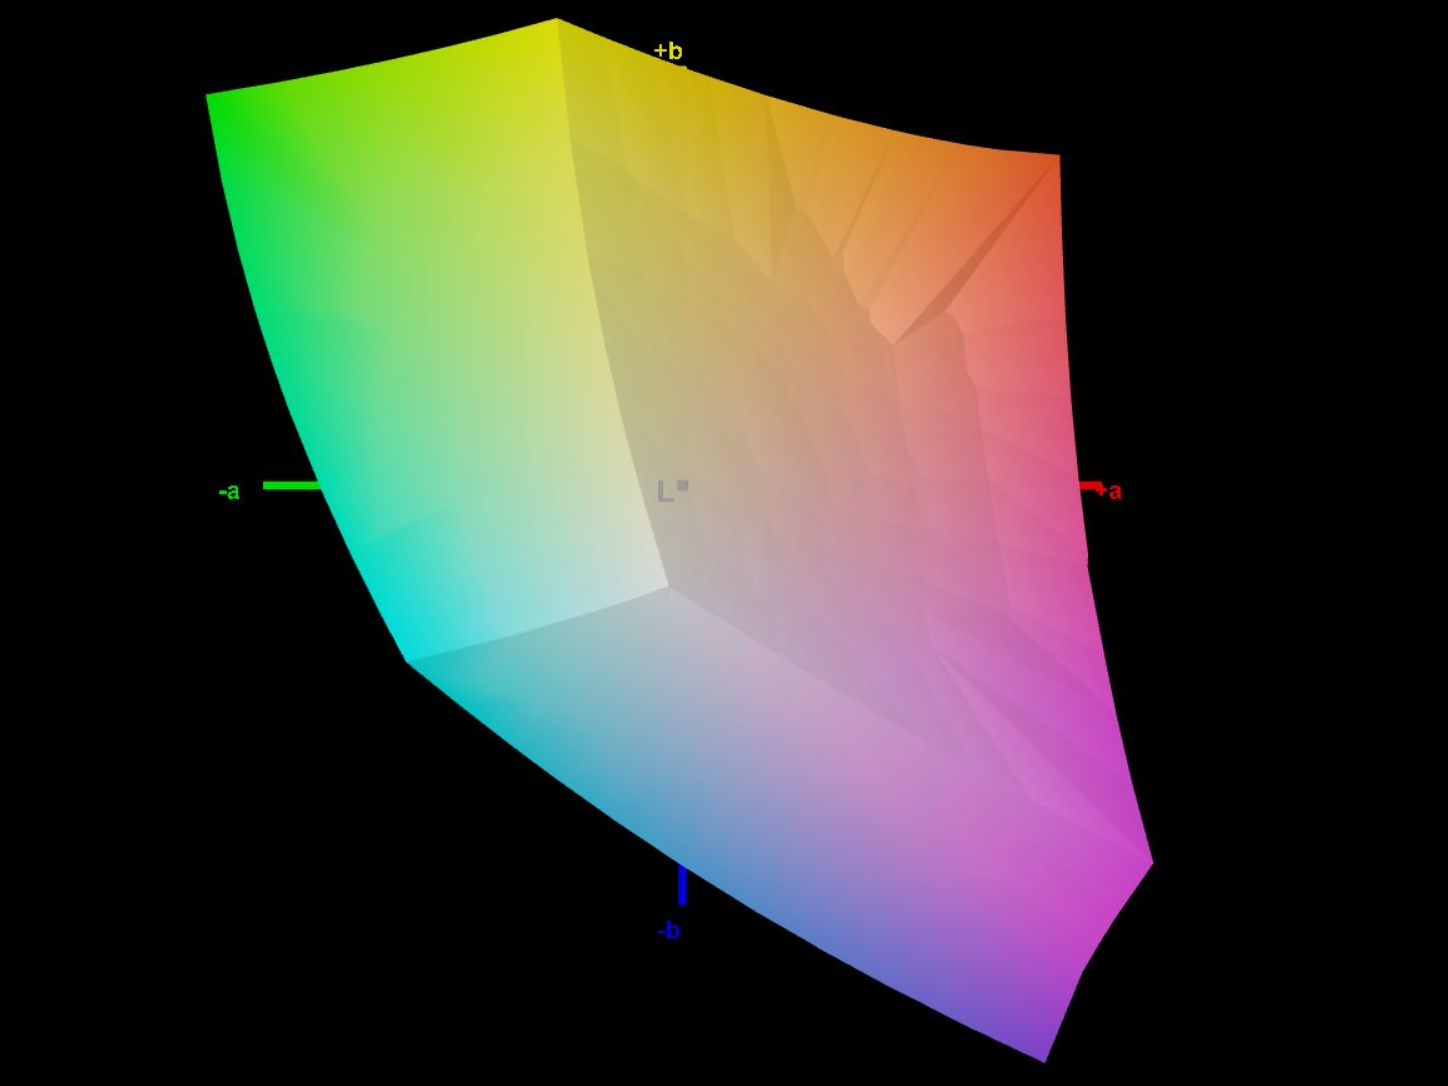
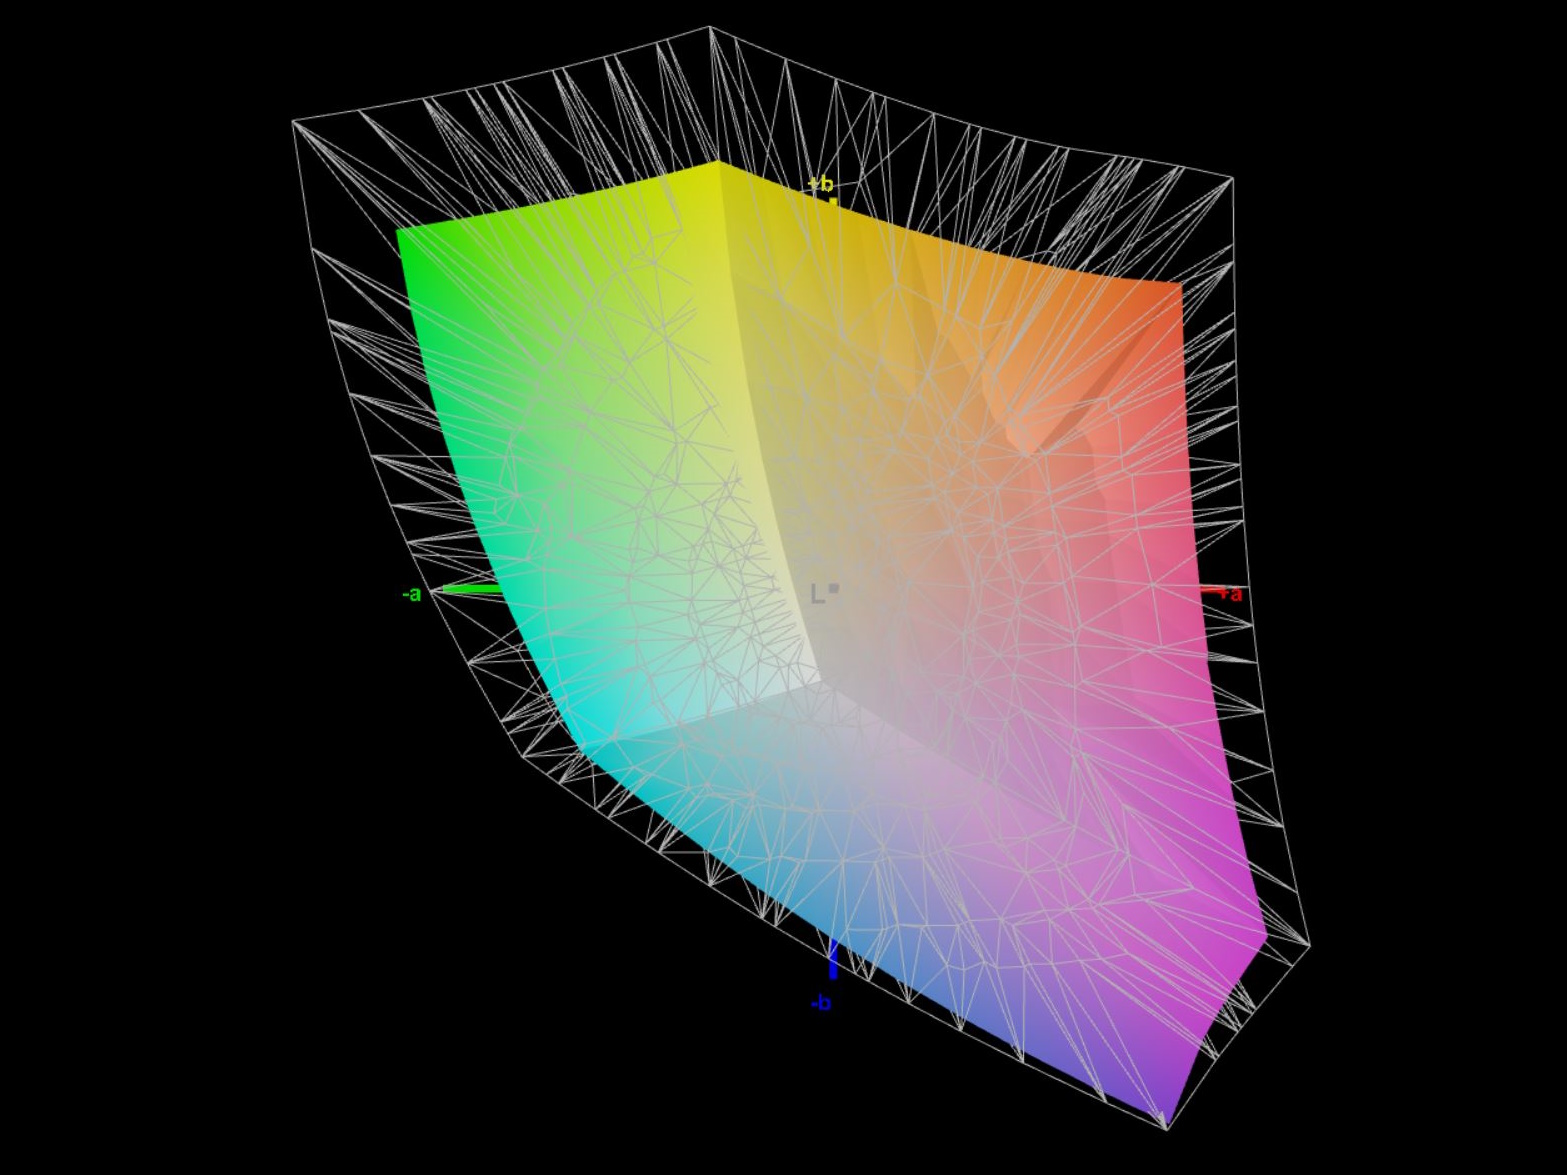
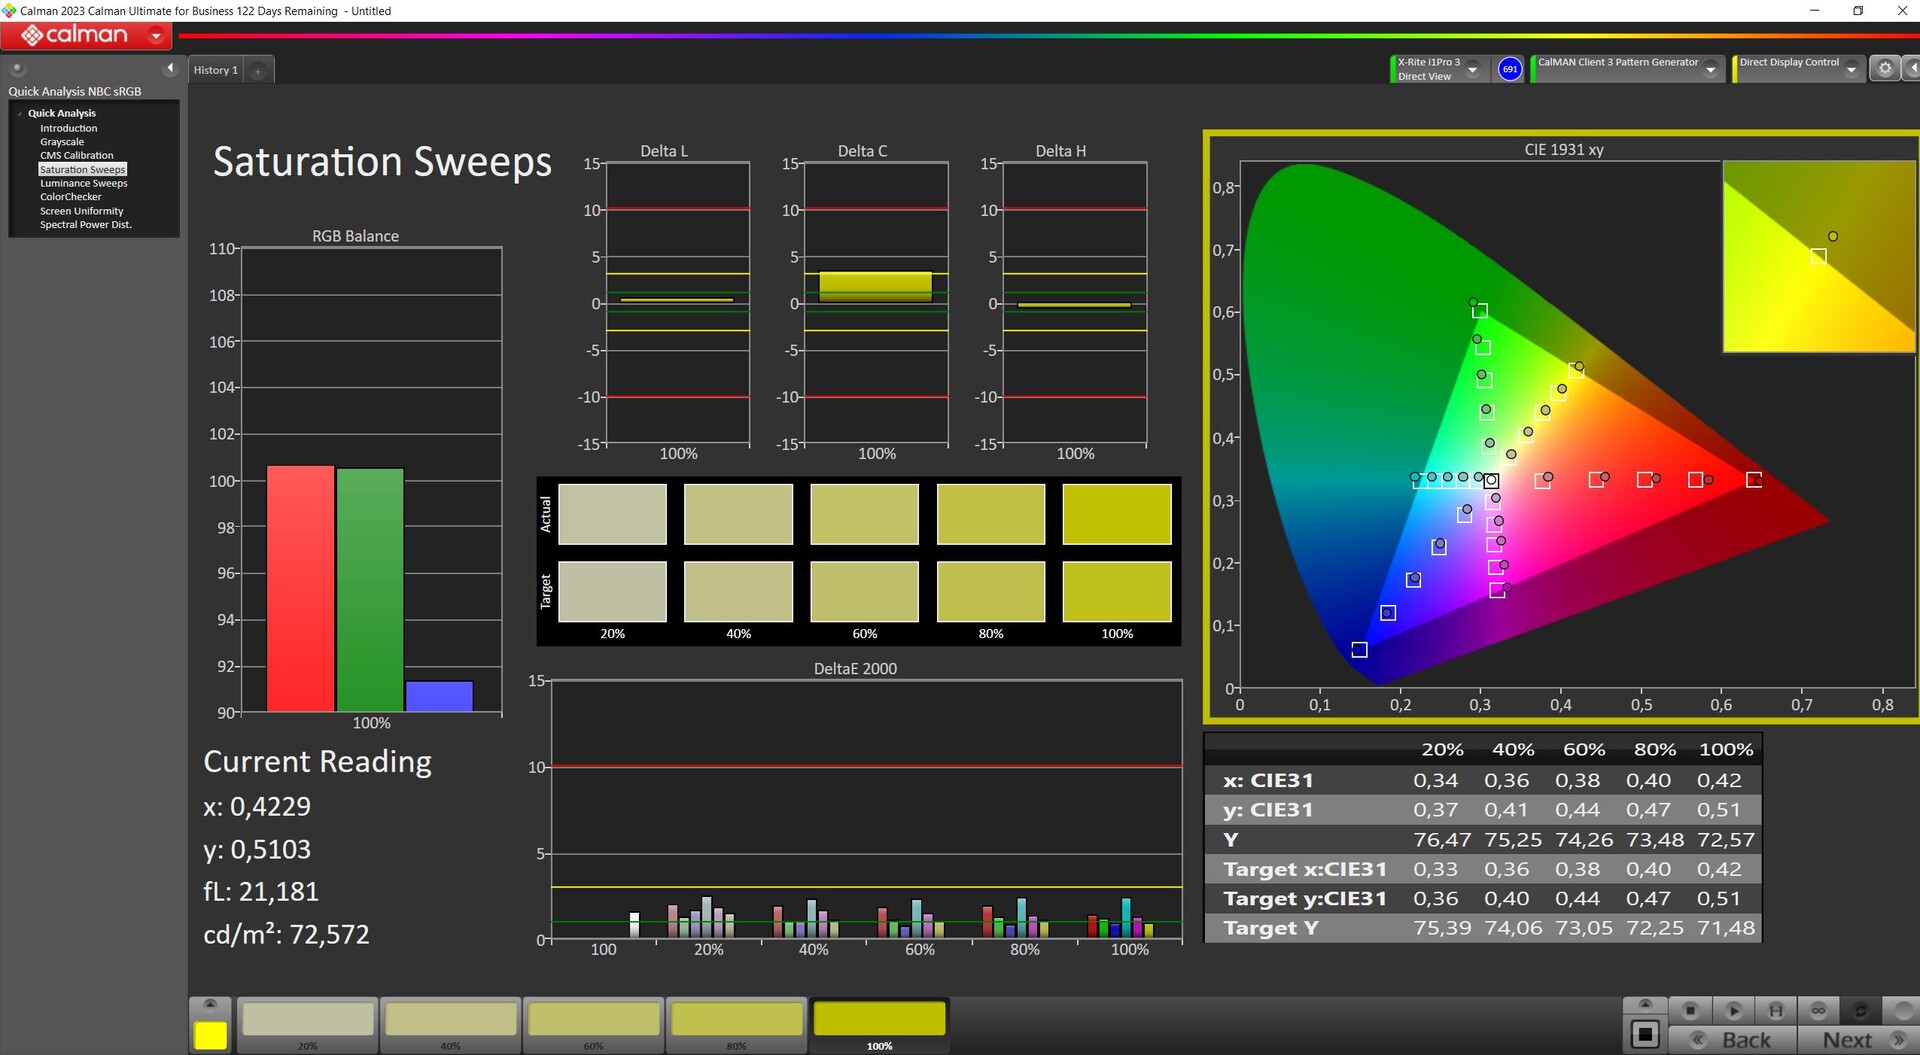
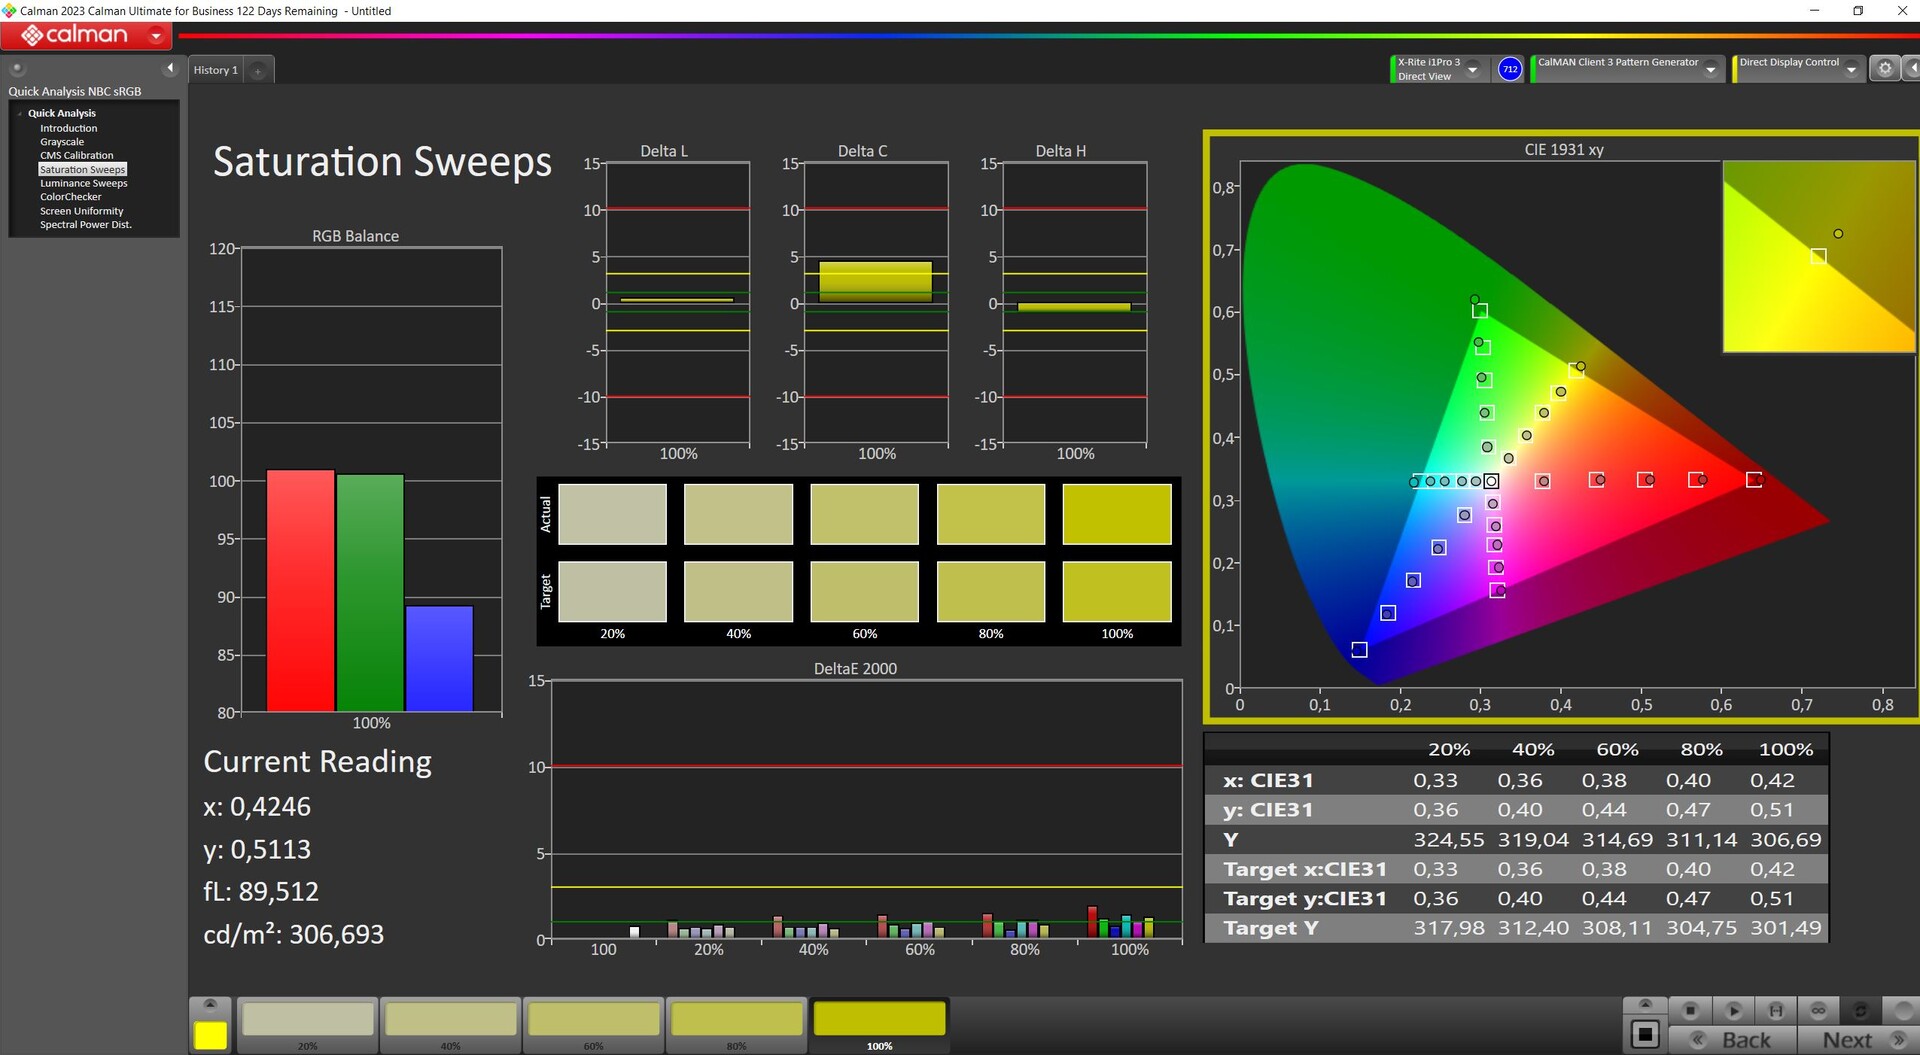
Color space coverage
As with the Fusion 15, sRGB is completely covered, with P3 and AdobeRGB sitting at around 73 to 75 percent.
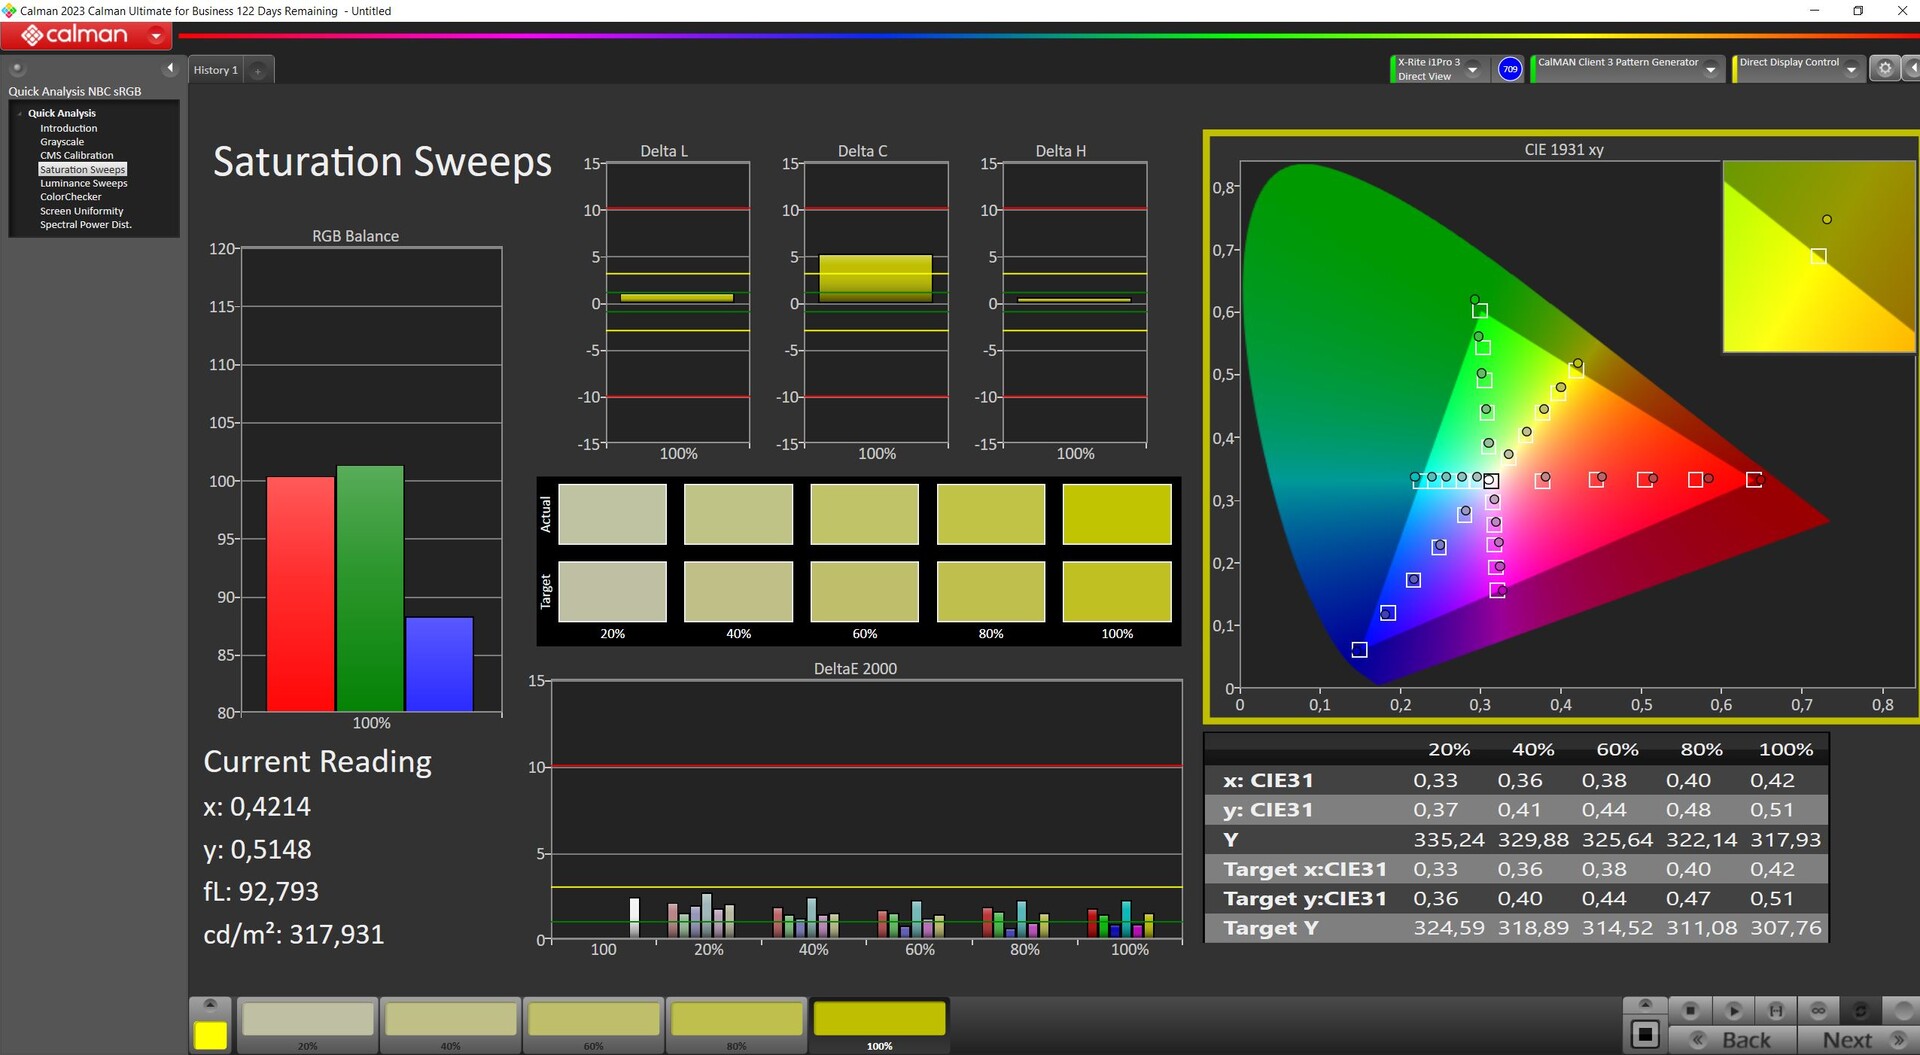
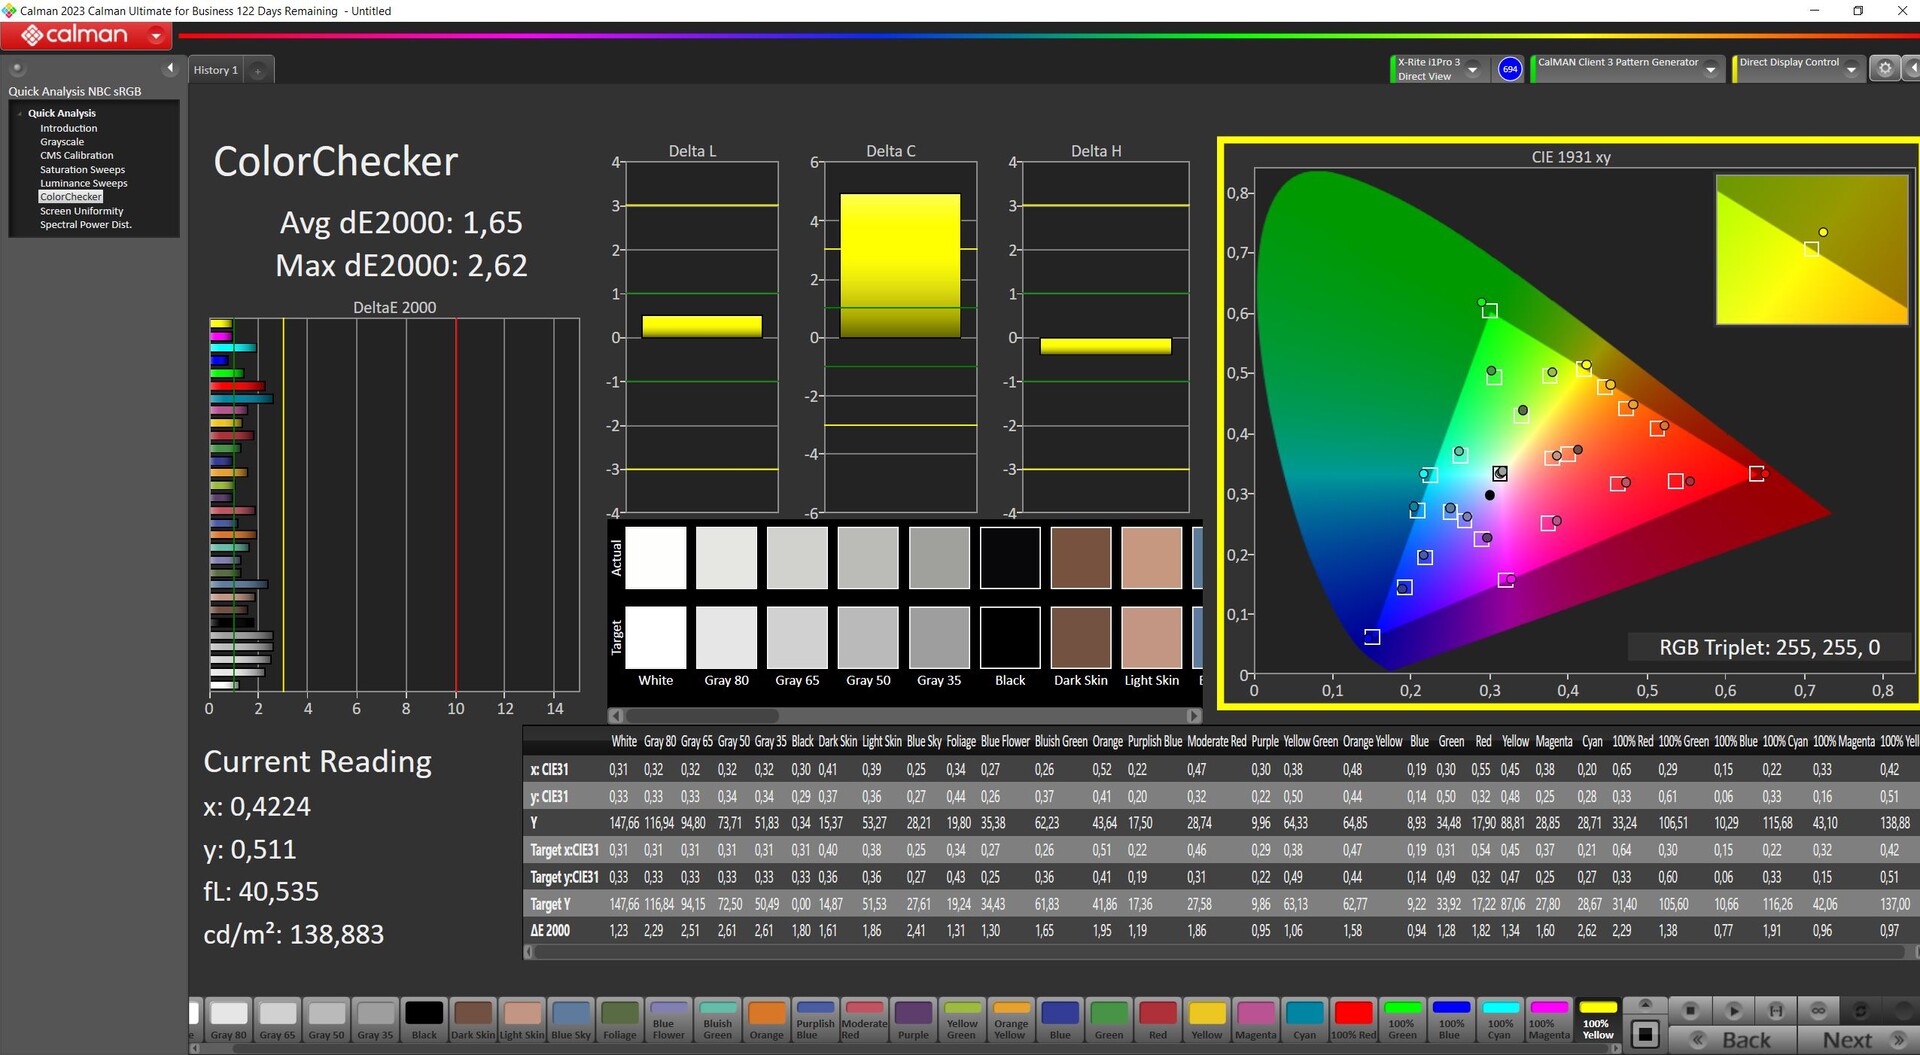
Color accuracy
Ou-of-the-box, the panel is decently calibrated, with DeltaE values of lower than 3. Nevertheless, the black value is considerably too high. Reducing the brightness to 150 nits not only improves the situation but also pushes the DeltaE values down slightly.
Manual calibration at native, maximum brightness works wonders despite the already decent values and noticeably manages to minimize the deviations. Therefore, the panel can be calibrated very well and this leads to very good color accuracy, at least in sRGB. At maximum brightness, the black value continues to be too high and this causes the contrast to suffer.

Display Response Times
| ↔ Response Time Black to White | ||
|---|---|---|
| 9.2 ms ... rise ↗ and fall ↘ combined | ↗ 4.6 ms rise | 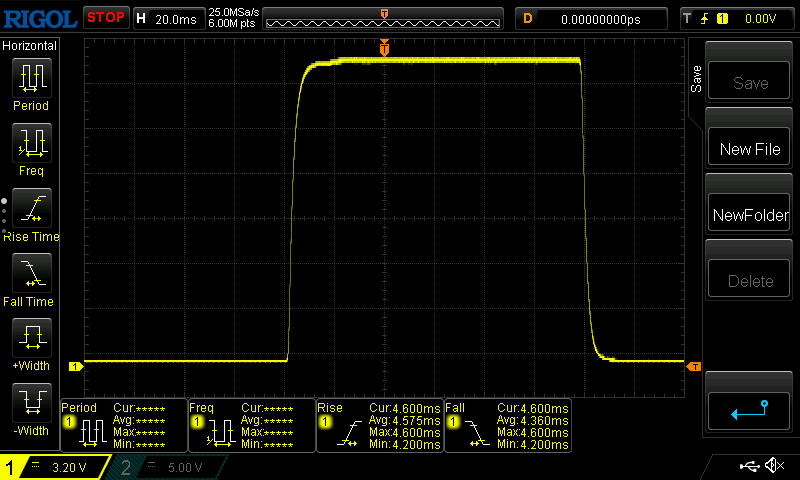 |
| ↘ 4.6 ms fall | ||
| The screen shows fast response rates in our tests and should be suited for gaming. In comparison, all tested devices range from 0.1 (minimum) to 240 (maximum) ms. » 24 % of all devices are better. This means that the measured response time is better than the average of all tested devices (20.4 ms). | ||
| ↔ Response Time 50% Grey to 80% Grey | ||
| 9.6 ms ... rise ↗ and fall ↘ combined | ↗ 4.6 ms rise | 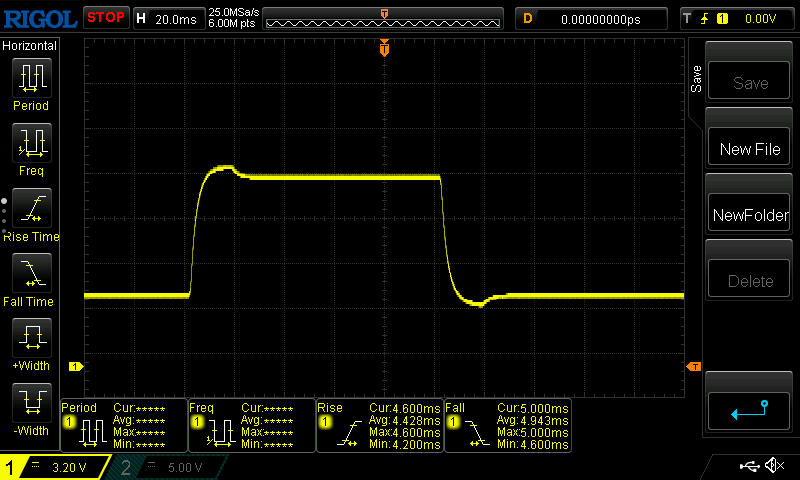 |
| ↘ 5 ms fall | ||
| The screen shows fast response rates in our tests and should be suited for gaming. In comparison, all tested devices range from 0.165 (minimum) to 636 (maximum) ms. » 21 % of all devices are better. This means that the measured response time is better than the average of all tested devices (31.8 ms). | ||
Screen Flickering / PWM (Pulse-Width Modulation)
| Screen flickering / PWM not detected | 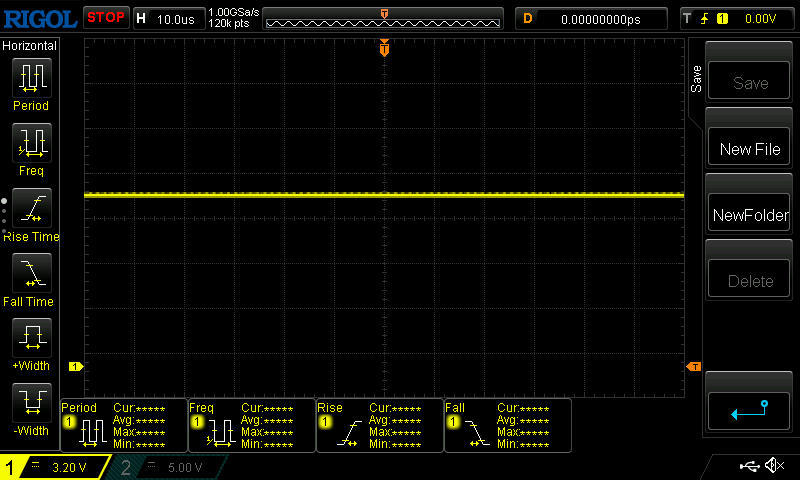 | ||
In comparison: 53 % of all tested devices do not use PWM to dim the display. If PWM was detected, an average of 8224 (minimum: 5 - maximum: 343500) Hz was measured. | |||

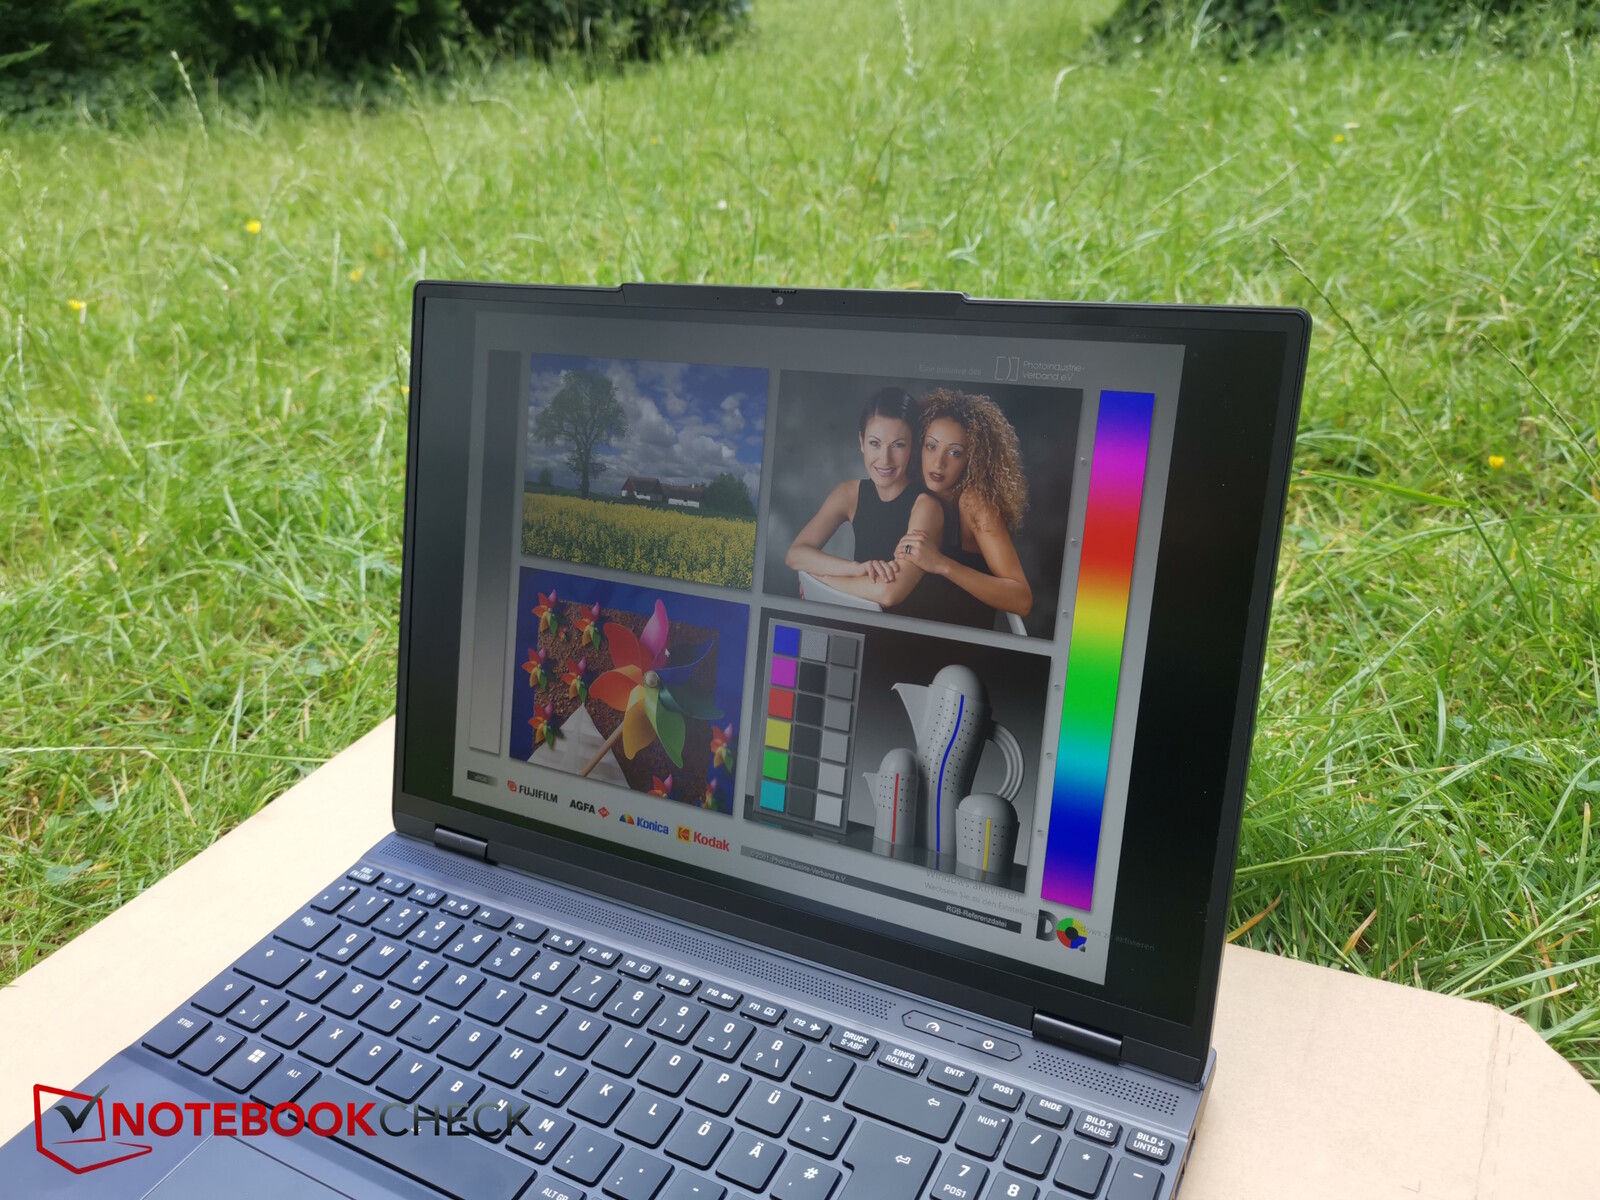
The high brightness and the matte display ensure you won't have many problems using the device in the shade with content remaining highly legible. However, the contrast could be a little higher and you should avoid direct sunlight.

Performance - 20 % slower than the Fusion with HX and RTX 4070
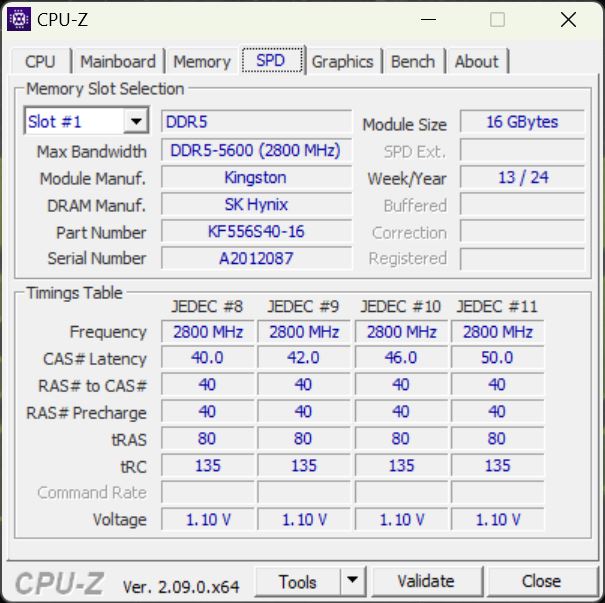
With the Ryzen 7 8845HS, RTX 4060 and 32 GB RAM, the XMG Core 15 positions itself as a mid-tier gaming laptop and is also marketed as such. Its black, relatively slim, stylish and fully aluminum case gives the laptop an understated look that could also make it interesting for content creators. That makes it all the more regrettable that Schenker doesn't offer any additional display options because the well-calibrated screen can "only" display sRGB. This could be an unnecessary deal-breaking criterion for photo and, especially, video editors. That's why we would also like to see DisplayP3 options in future.
Test conditions
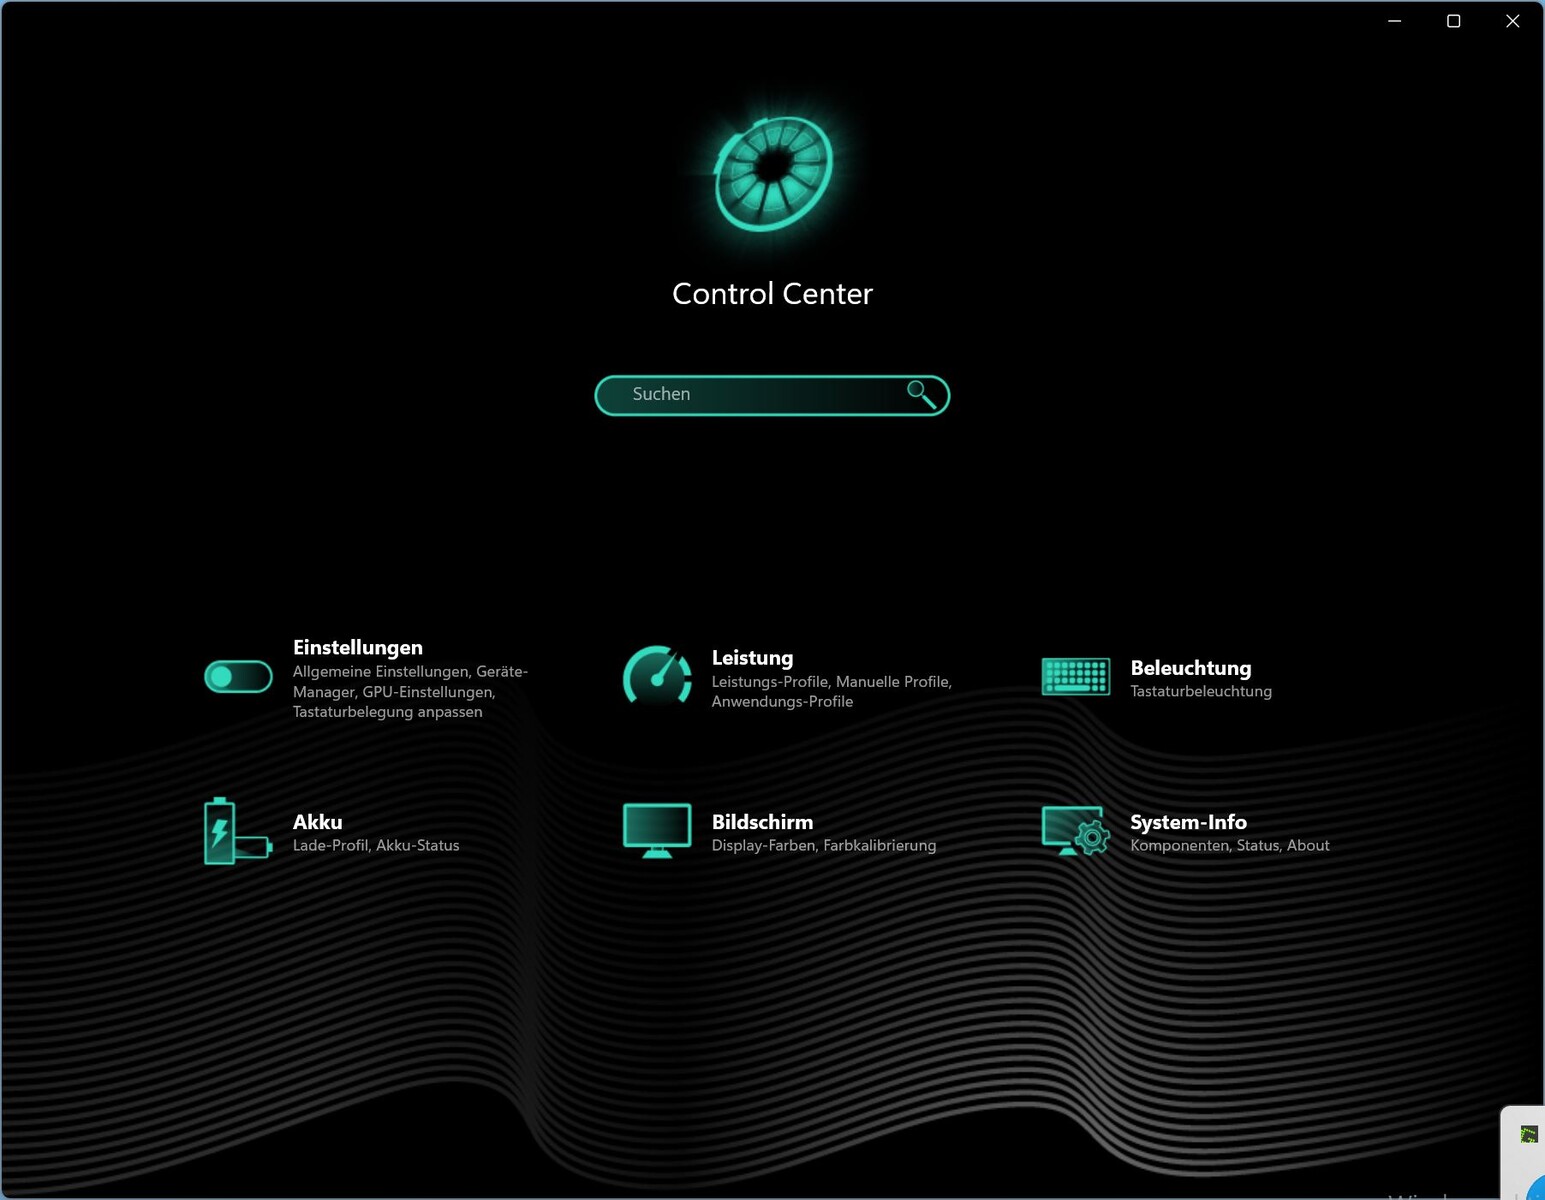
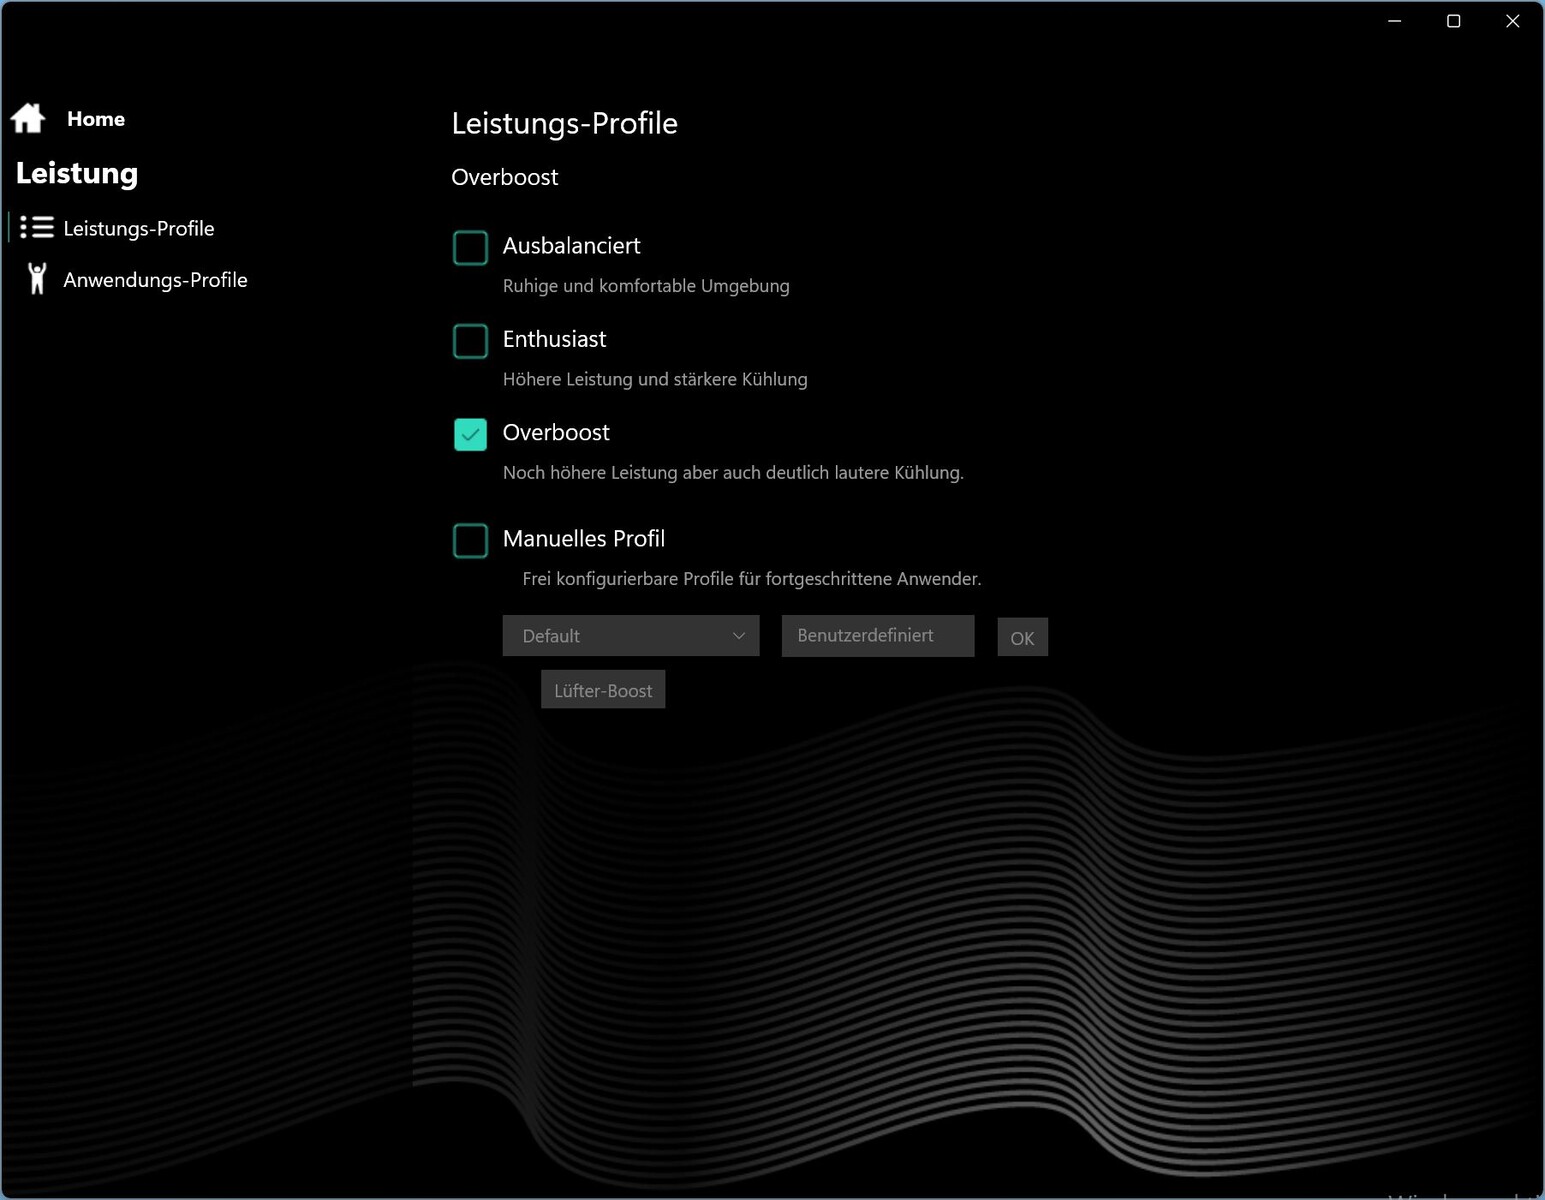
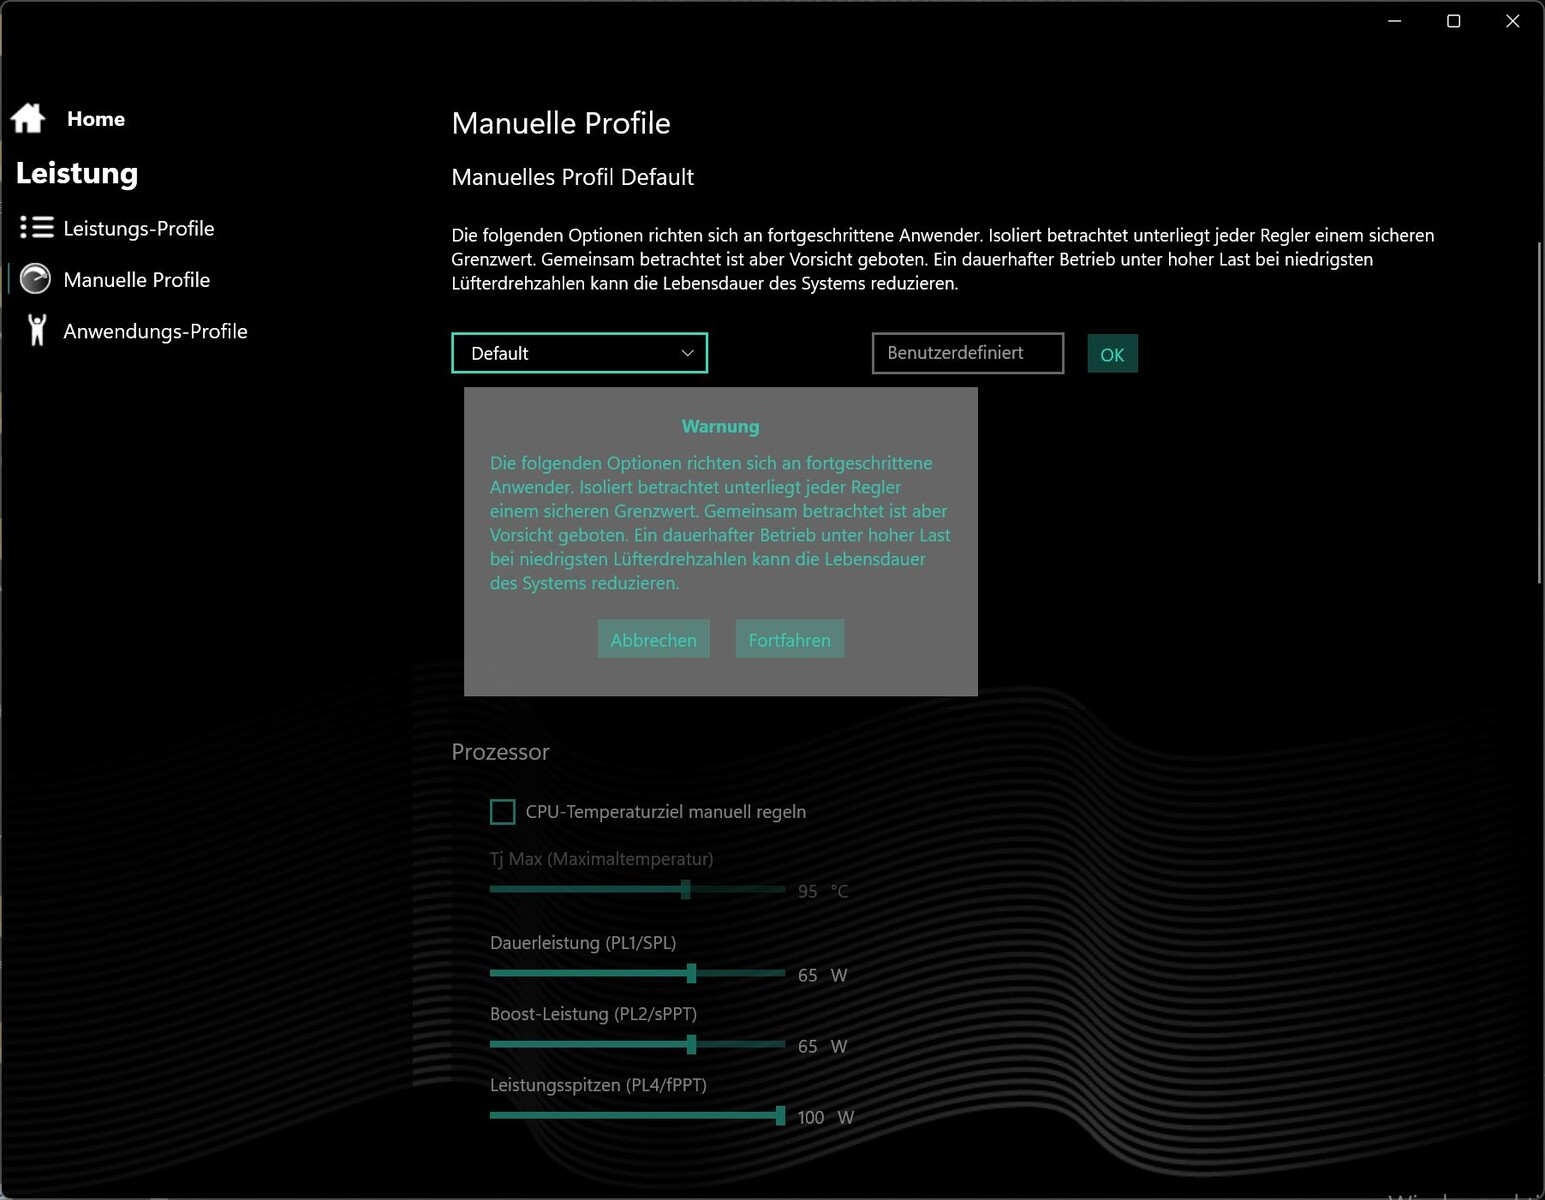
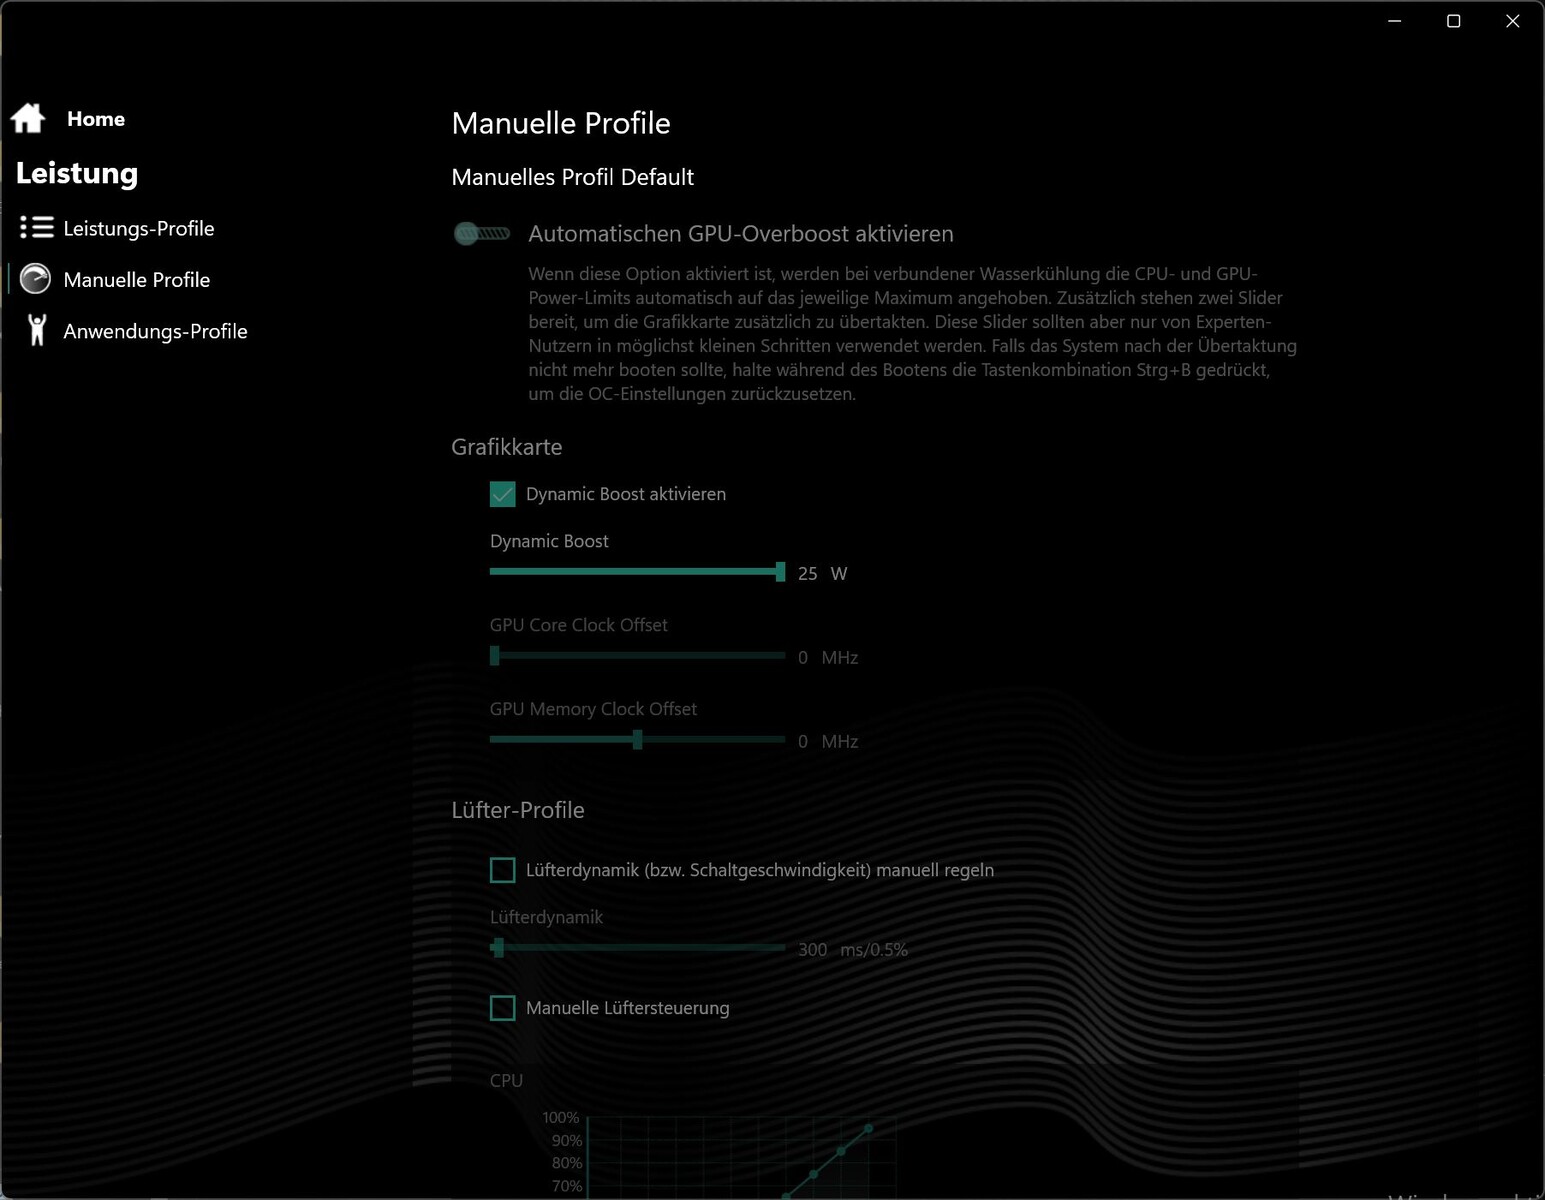
In the generic Control Center (Tulpar uses, for example, the same CC), 3 preset performance profiles (Balanced, Enthusiast, Overboost) and a manual profile are offered. In the latter, a fan boost can be activated and CPU target temperature, fan curves (and more) can be defined. Under general settings via MUX, the GPU can be switched from hybrid to dGPU, which subsequently requires a reboot.
For our performance benchmarks, we chose the Overboost mode and, in the battery test, we used Balanced. We also present the performance values regarding the other modes.
Processor
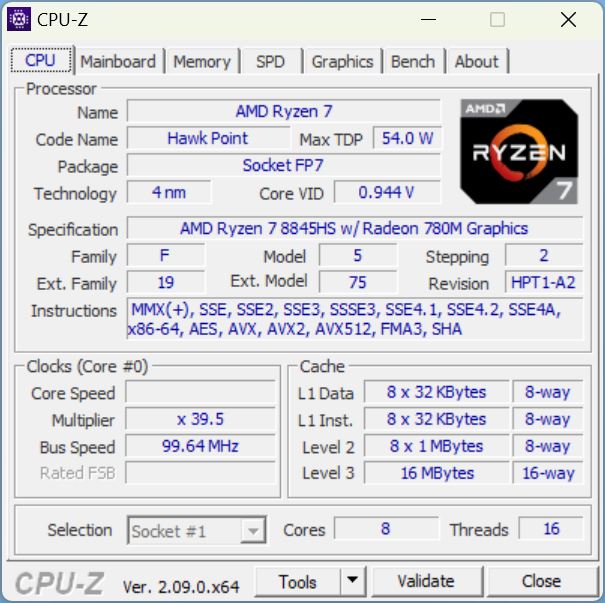
All Core 15 SKUs are equipped with the same processor. The AMD Ryzen 7 8845HS is the second fastest CPU in the Hawk Point series with Zen 4 architecture. It has 8 cores and hyperthreading which means it can process 16 threads simultaneously. The cores have a base clock speed of 3.8 GHz and can be individually overclocked up to 5.1 GHz.
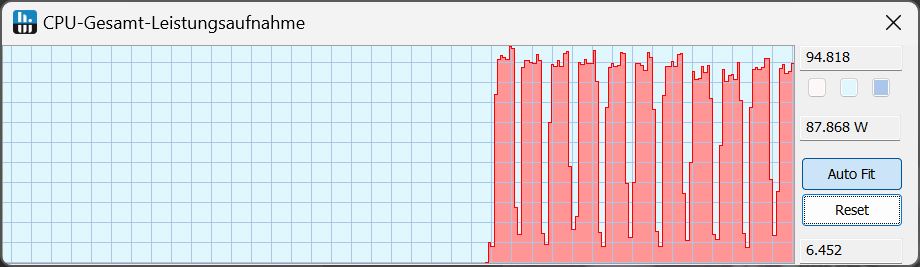
In the Cinebench R15 continuous test, our AMD Core 15 performed very consistently but mostly at a level somewhat below the laptops equipped with an Intel Gen14 HX CPU. That's not really surprising because the AMD CPU only briefly draws a maximum of 90 W and 80 W over a longer period. With the Intel CPU in the Fusion 15, these values are 140 W and 105 W. Only the Dell G16 dips below the Ryzen 7's consistent performance level seen in the Core after a better starting performance.
Across all CPU tests, our Ryzen 7 is completely on target. Unfortunately, however, our Core takes last place again since its Intel HX competitors are simply a bit more powerful. Nevertheless, the gap behind the Dell G16 or HP Victus 16 is really minimal. The Legion 5i or the Intel-powered Fusion 15 enjoy a significant advantage.
Away from the wall, there is a performance dip of around 35 percent in the Cinebench R15 multi-core test.
| Performance profile/measured value | Cinebench R15 score in the first run | CPU power consumption in W |
|---|---|---|
| Overboost | 2,908 | continuously 80 - 94 |
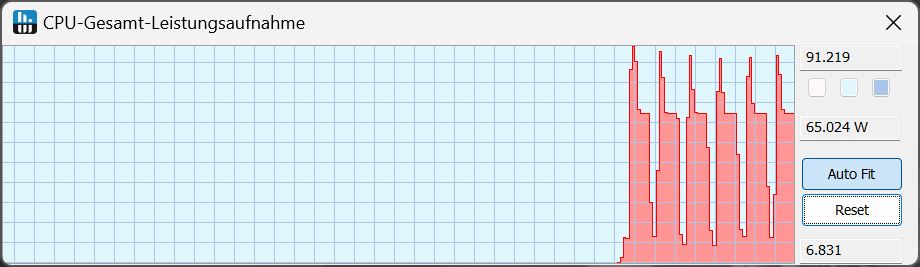
| Enthusiast | 2,749 | short 90, then 65 |
| Balanced | 2,277 | briefly 59, then 35 |
| Battery | 1,909 | briefly 30, then 25 |
Cinebench R15 Multi Continuous Test
Cinebench R23: Multi Core | Single Core
Cinebench R20: CPU (Multi Core) | CPU (Single Core)
Cinebench R15: CPU Multi 64Bit | CPU Single 64Bit
Blender: v2.79 BMW27 CPU
7-Zip 18.03: 7z b 4 | 7z b 4 -mmt1
Geekbench 6.5: Multi-Core | Single-Core
Geekbench 5.5: Multi-Core | Single-Core
HWBOT x265 Benchmark v2.2: 4k Preset
LibreOffice : 20 Documents To PDF
R Benchmark 2.5: Overall mean
| CPU Performance rating | |
| SCHENKER XMG Fusion 15 (Early 24) | |
| Lenovo Legion 5 16IRX G9 | |
| Average of class Gaming | |
| SCHENKER XMG Pro 15 (E23) -2! | |
| HP Victus 16 (2024) | |
| Dell G16, i7-13650HX, RTX 4060 | |
| SCHENKER XMG Core 15 (M24) | |
| Average AMD Ryzen 7 8845HS | |
| Cinebench R23 / Multi Core | |
| Average of class Gaming (5668 - 40970, n=138, last 2 years) | |
| SCHENKER XMG Pro 15 (E23) | |
| Lenovo Legion 5 16IRX G9 | |
| HP Victus 16 (2024) | |
| SCHENKER XMG Fusion 15 (Early 24) | |
| Dell G16, i7-13650HX, RTX 4060 | |
| SCHENKER XMG Core 15 (M24) | |
| Average AMD Ryzen 7 8845HS (14895 - 18037, n=13) | |
| Cinebench R23 / Single Core | |
| SCHENKER XMG Fusion 15 (Early 24) | |
| Average of class Gaming (1136 - 2267, n=138, last 2 years) | |
| Lenovo Legion 5 16IRX G9 | |
| Dell G16, i7-13650HX, RTX 4060 | |
| SCHENKER XMG Pro 15 (E23) | |
| SCHENKER XMG Core 15 (M24) | |
| Average AMD Ryzen 7 8845HS (1623 - 1783, n=13) | |
| HP Victus 16 (2024) | |
| Cinebench R20 / CPU (Multi Core) | |
| Average of class Gaming (2179 - 16108, n=137, last 2 years) | |
| Lenovo Legion 5 16IRX G9 | |
| SCHENKER XMG Pro 15 (E23) | |
| HP Victus 16 (2024) | |
| SCHENKER XMG Fusion 15 (Early 24) | |
| Dell G16, i7-13650HX, RTX 4060 | |
| SCHENKER XMG Core 15 (M24) | |
| Average AMD Ryzen 7 8845HS (5808 - 7026, n=13) | |
| Cinebench R20 / CPU (Single Core) | |
| SCHENKER XMG Fusion 15 (Early 24) | |
| Average of class Gaming (439 - 870, n=137, last 2 years) | |
| Lenovo Legion 5 16IRX G9 | |
| SCHENKER XMG Pro 15 (E23) | |
| Dell G16, i7-13650HX, RTX 4060 | |
| SCHENKER XMG Core 15 (M24) | |
| Average AMD Ryzen 7 8845HS (673 - 698, n=13) | |
| HP Victus 16 (2024) | |
| Cinebench R15 / CPU Multi 64Bit | |
| SCHENKER XMG Pro 15 (E23) | |
| Average of class Gaming (1537 - 6271, n=137, last 2 years) | |
| HP Victus 16 (2024) | |
| Lenovo Legion 5 16IRX G9 | |
| SCHENKER XMG Fusion 15 (Early 24) | |
| Dell G16, i7-13650HX, RTX 4060 | |
| SCHENKER XMG Core 15 (M24) | |
| Average AMD Ryzen 7 8845HS (2342 - 2908, n=13) | |
| Cinebench R15 / CPU Single 64Bit | |
| Average of class Gaming (191.9 - 343, n=136, last 2 years) | |
| Lenovo Legion 5 16IRX G9 | |
| SCHENKER XMG Fusion 15 (Early 24) | |
| SCHENKER XMG Core 15 (M24) | |
| Average AMD Ryzen 7 8845HS (269 - 283, n=13) | |
| Dell G16, i7-13650HX, RTX 4060 | |
| SCHENKER XMG Pro 15 (E23) | |
| HP Victus 16 (2024) | |
| Blender / v2.79 BMW27 CPU | |
| Average AMD Ryzen 7 8845HS (179 - 216, n=13) | |
| SCHENKER XMG Core 15 (M24) | |
| HP Victus 16 (2024) | |
| Dell G16, i7-13650HX, RTX 4060 | |
| Average of class Gaming (80 - 517, n=133, last 2 years) | |
| SCHENKER XMG Pro 15 (E23) | |
| Lenovo Legion 5 16IRX G9 | |
| SCHENKER XMG Fusion 15 (Early 24) | |
| 7-Zip 18.03 / 7z b 4 | |
| SCHENKER XMG Fusion 15 (Early 24) | |
| Lenovo Legion 5 16IRX G9 | |
| Average of class Gaming (23795 - 148086, n=135, last 2 years) | |
| SCHENKER XMG Pro 15 (E23) | |
| HP Victus 16 (2024) | |
| Dell G16, i7-13650HX, RTX 4060 | |
| SCHENKER XMG Core 15 (M24) | |
| Average AMD Ryzen 7 8845HS (62669 - 74664, n=13) | |
| 7-Zip 18.03 / 7z b 4 -mmt1 | |
| SCHENKER XMG Fusion 15 (Early 24) | |
| Lenovo Legion 5 16IRX G9 | |
| SCHENKER XMG Core 15 (M24) | |
| Average of class Gaming (4199 - 7508, n=135, last 2 years) | |
| SCHENKER XMG Pro 15 (E23) | |
| Average AMD Ryzen 7 8845HS (5197 - 6714, n=13) | |
| Dell G16, i7-13650HX, RTX 4060 | |
| HP Victus 16 (2024) | |
| Geekbench 6.5 / Multi-Core | |
| SCHENKER XMG Fusion 15 (Early 24) | |
| Lenovo Legion 5 16IRX G9 | |
| Average of class Gaming (5340 - 22104, n=135, last 2 years) | |
| HP Victus 16 (2024) | |
| SCHENKER XMG Core 15 (M24) | |
| Dell G16, i7-13650HX, RTX 4060 | |
| Average AMD Ryzen 7 8845HS (11073 - 14014, n=18) | |
| Geekbench 6.5 / Single-Core | |
| SCHENKER XMG Fusion 15 (Early 24) | |
| Average of class Gaming (1490 - 3253, n=135, last 2 years) | |
| Lenovo Legion 5 16IRX G9 | |
| SCHENKER XMG Core 15 (M24) | |
| Average AMD Ryzen 7 8845HS (2510 - 2698, n=16) | |
| Dell G16, i7-13650HX, RTX 4060 | |
| HP Victus 16 (2024) | |
| Geekbench 5.5 / Multi-Core | |
| SCHENKER XMG Pro 15 (E23) | |
| SCHENKER XMG Fusion 15 (Early 24) | |
| Lenovo Legion 5 16IRX G9 | |
| Average of class Gaming (4557 - 27010, n=134, last 2 years) | |
| HP Victus 16 (2024) | |
| SCHENKER XMG Core 15 (M24) | |
| Dell G16, i7-13650HX, RTX 4060 | |
| Average AMD Ryzen 7 8845HS (11256 - 12726, n=15) | |
| Geekbench 5.5 / Single-Core | |
| SCHENKER XMG Fusion 15 (Early 24) | |
| Average of class Gaming (986 - 2423, n=134, last 2 years) | |
| SCHENKER XMG Core 15 (M24) | |
| Lenovo Legion 5 16IRX G9 | |
| Average AMD Ryzen 7 8845HS (1765 - 2004, n=15) | |
| Dell G16, i7-13650HX, RTX 4060 | |
| SCHENKER XMG Pro 15 (E23) | |
| HP Victus 16 (2024) | |
| HWBOT x265 Benchmark v2.2 / 4k Preset | |
| Average of class Gaming (7.7 - 44.3, n=135, last 2 years) | |
| Lenovo Legion 5 16IRX G9 | |
| SCHENKER XMG Fusion 15 (Early 24) | |
| SCHENKER XMG Pro 15 (E23) | |
| SCHENKER XMG Core 15 (M24) | |
| HP Victus 16 (2024) | |
| Dell G16, i7-13650HX, RTX 4060 | |
| Average AMD Ryzen 7 8845HS (18.6 - 22.7, n=13) | |
| LibreOffice / 20 Documents To PDF | |
| HP Victus 16 (2024) | |
| Dell G16, i7-13650HX, RTX 4060 | |
| SCHENKER XMG Pro 15 (E23) | |
| Average AMD Ryzen 7 8845HS (44.4 - 77, n=13) | |
| SCHENKER XMG Core 15 (M24) | |
| Average of class Gaming (19 - 88.8, n=134, last 2 years) | |
| Lenovo Legion 5 16IRX G9 | |
| SCHENKER XMG Fusion 15 (Early 24) | |
| R Benchmark 2.5 / Overall mean | |
| HP Victus 16 (2024) | |
| SCHENKER XMG Pro 15 (E23) | |
| Average AMD Ryzen 7 8845HS (0.4304 - 0.4935, n=13) | |
| SCHENKER XMG Core 15 (M24) | |
| Average of class Gaming (0.3551 - 0.759, n=136, last 2 years) | |
| Dell G16, i7-13650HX, RTX 4060 | |
| Dell G16, i7-13650HX, RTX 4060 | |
| Lenovo Legion 5 16IRX G9 | |
| SCHENKER XMG Fusion 15 (Early 24) | |
* ... smaller is better
AIDA64: FP32 Ray-Trace | FPU Julia | CPU SHA3 | CPU Queen | FPU SinJulia | FPU Mandel | CPU AES | CPU ZLib | FP64 Ray-Trace | CPU PhotoWorxx
| Performance rating | |
| Average of class Gaming | |
| SCHENKER XMG Fusion 15 (Early 24) | |
| SCHENKER XMG Core 15 (M24) | |
| Average AMD Ryzen 7 8845HS | |
| SCHENKER XMG Pro 15 (E23) | |
| Lenovo Legion 5 16IRX G9 | |
| Dell G16, i7-13650HX, RTX 4060 | |
| HP Victus 16 (2024) | |
| AIDA64 / FP32 Ray-Trace | |
| SCHENKER XMG Core 15 (M24) | |
| Average of class Gaming (7192 - 85542, n=134, last 2 years) | |
| Average AMD Ryzen 7 8845HS (23708 - 29544, n=13) | |
| SCHENKER XMG Fusion 15 (Early 24) | |
| Lenovo Legion 5 16IRX G9 | |
| Dell G16, i7-13650HX, RTX 4060 | |
| SCHENKER XMG Pro 15 (E23) | |
| HP Victus 16 (2024) | |
| AIDA64 / FPU Julia | |
| Average of class Gaming (35040 - 252486, n=134, last 2 years) | |
| SCHENKER XMG Core 15 (M24) | |
| Average AMD Ryzen 7 8845HS (99659 - 125873, n=13) | |
| SCHENKER XMG Fusion 15 (Early 24) | |
| SCHENKER XMG Pro 15 (E23) | |
| Lenovo Legion 5 16IRX G9 | |
| Dell G16, i7-13650HX, RTX 4060 | |
| HP Victus 16 (2024) | |
| AIDA64 / CPU SHA3 | |
| Average of class Gaming (1728 - 10389, n=134, last 2 years) | |
| SCHENKER XMG Fusion 15 (Early 24) | |
| SCHENKER XMG Core 15 (M24) | |
| SCHENKER XMG Pro 15 (E23) | |
| Average AMD Ryzen 7 8845HS (4332 - 5180, n=13) | |
| Dell G16, i7-13650HX, RTX 4060 | |
| Lenovo Legion 5 16IRX G9 | |
| HP Victus 16 (2024) | |
| AIDA64 / CPU Queen | |
| SCHENKER XMG Pro 15 (E23) | |
| SCHENKER XMG Fusion 15 (Early 24) | |
| HP Victus 16 (2024) | |
| SCHENKER XMG Core 15 (M24) | |
| Average of class Gaming (50699 - 200651, n=134, last 2 years) | |
| Average AMD Ryzen 7 8845HS (109458 - 124695, n=13) | |
| Dell G16, i7-13650HX, RTX 4060 | |
| Lenovo Legion 5 16IRX G9 | |
| AIDA64 / FPU SinJulia | |
| SCHENKER XMG Core 15 (M24) | |
| Average AMD Ryzen 7 8845HS (14062 - 15519, n=13) | |
| Average of class Gaming (5020 - 33636, n=134, last 2 years) | |
| SCHENKER XMG Fusion 15 (Early 24) | |
| SCHENKER XMG Pro 15 (E23) | |
| Lenovo Legion 5 16IRX G9 | |
| HP Victus 16 (2024) | |
| Dell G16, i7-13650HX, RTX 4060 | |
| AIDA64 / FPU Mandel | |
| SCHENKER XMG Core 15 (M24) | |
| Average of class Gaming (17585 - 134044, n=134, last 2 years) | |
| Average AMD Ryzen 7 8845HS (53436 - 67367, n=13) | |
| SCHENKER XMG Fusion 15 (Early 24) | |
| Lenovo Legion 5 16IRX G9 | |
| Dell G16, i7-13650HX, RTX 4060 | |
| SCHENKER XMG Pro 15 (E23) | |
| HP Victus 16 (2024) | |
| AIDA64 / CPU AES | |
| SCHENKER XMG Fusion 15 (Early 24) | |
| Average of class Gaming (19065 - 247074, n=134, last 2 years) | |
| Average AMD Ryzen 7 8845HS (64515 - 172642, n=13) | |
| SCHENKER XMG Pro 15 (E23) | |
| SCHENKER XMG Core 15 (M24) | |
| Lenovo Legion 5 16IRX G9 | |
| Dell G16, i7-13650HX, RTX 4060 | |
| HP Victus 16 (2024) | |
| AIDA64 / CPU ZLib | |
| Average of class Gaming (373 - 2531, n=134, last 2 years) | |
| SCHENKER XMG Fusion 15 (Early 24) | |
| SCHENKER XMG Pro 15 (E23) | |
| Lenovo Legion 5 16IRX G9 | |
| Dell G16, i7-13650HX, RTX 4060 | |
| HP Victus 16 (2024) | |
| Average AMD Ryzen 7 8845HS (627 - 1080, n=13) | |
| SCHENKER XMG Core 15 (M24) | |
| AIDA64 / FP64 Ray-Trace | |
| SCHENKER XMG Core 15 (M24) | |
| Average of class Gaming (3856 - 45446, n=134, last 2 years) | |
| Average AMD Ryzen 7 8845HS (12361 - 15911, n=13) | |
| SCHENKER XMG Fusion 15 (Early 24) | |
| Dell G16, i7-13650HX, RTX 4060 | |
| Lenovo Legion 5 16IRX G9 | |
| SCHENKER XMG Pro 15 (E23) | |
| HP Victus 16 (2024) | |
| AIDA64 / CPU PhotoWorxx | |
| SCHENKER XMG Pro 15 (E23) | |
| SCHENKER XMG Fusion 15 (Early 24) | |
| Average of class Gaming (10805 - 62916, n=134, last 2 years) | |
| SCHENKER XMG Core 15 (M24) | |
| HP Victus 16 (2024) | |
| Average AMD Ryzen 7 8845HS (33192 - 41668, n=13) | |
| Dell G16, i7-13650HX, RTX 4060 | |
| Lenovo Legion 5 16IRX G9 | |
System performance
While our review system lags just a little behind regarding its pure CPU score, it leads the HX competition in PCMark 10. When it comes to the essentials, the score is in the middle of the pack but, in terms of productivity, it pulls ahead and is among the front runners in the area of content creation.
In CrossMark, the Dell G16 is a touch worse, with the other competitors slightly in front of our AMD Core 15.
CrossMark: Overall | Productivity | Creativity | Responsiveness
WebXPRT 3: Overall
WebXPRT 4: Overall
Mozilla Kraken 1.1: Total
| PCMark 10 / Score | |
| SCHENKER XMG Core 15 (M24) | |
| SCHENKER XMG Fusion 15 (Early 24) | |
| Average AMD Ryzen 7 8845HS, NVIDIA GeForce RTX 4060 Laptop GPU (7538 - 8822, n=2) | |
| Average of class Gaming (5776 - 9852, n=116, last 2 years) | |
| Lenovo Legion 5 16IRX G9 | |
| HP Victus 16 (2024) | |
| SCHENKER XMG Pro 15 (E23) | |
| Dell G16, i7-13650HX, RTX 4060 | |
| PCMark 10 / Essentials | |
| SCHENKER XMG Fusion 15 (Early 24) | |
| SCHENKER XMG Pro 15 (E23) | |
| Lenovo Legion 5 16IRX G9 | |
| HP Victus 16 (2024) | |
| Average of class Gaming (9057 - 12600, n=118, last 2 years) | |
| SCHENKER XMG Core 15 (M24) | |
| Average AMD Ryzen 7 8845HS, NVIDIA GeForce RTX 4060 Laptop GPU (9936 - 10061, n=2) | |
| Dell G16, i7-13650HX, RTX 4060 | |
| PCMark 10 / Productivity | |
| SCHENKER XMG Core 15 (M24) | |
| Average AMD Ryzen 7 8845HS, NVIDIA GeForce RTX 4060 Laptop GPU (9789 - 14612, n=2) | |
| SCHENKER XMG Fusion 15 (Early 24) | |
| SCHENKER XMG Pro 15 (E23) | |
| Dell G16, i7-13650HX, RTX 4060 | |
| HP Victus 16 (2024) | |
| Average of class Gaming (6662 - 14612, n=116, last 2 years) | |
| Lenovo Legion 5 16IRX G9 | |
| PCMark 10 / Digital Content Creation | |
| Average of class Gaming (7440 - 19351, n=116, last 2 years) | |
| SCHENKER XMG Fusion 15 (Early 24) | |
| SCHENKER XMG Core 15 (M24) | |
| Average AMD Ryzen 7 8845HS, NVIDIA GeForce RTX 4060 Laptop GPU (11953 - 12674, n=2) | |
| Lenovo Legion 5 16IRX G9 | |
| Dell G16, i7-13650HX, RTX 4060 | |
| HP Victus 16 (2024) | |
| SCHENKER XMG Pro 15 (E23) | |
| CrossMark / Overall | |
| SCHENKER XMG Fusion 15 (Early 24) | |
| Lenovo Legion 5 16IRX G9 | |
| Average of class Gaming (1247 - 2344, n=108, last 2 years) | |
| SCHENKER XMG Pro 15 (E23) | |
| HP Victus 16 (2024) | |
| SCHENKER XMG Core 15 (M24) | |
| Average AMD Ryzen 7 8845HS, NVIDIA GeForce RTX 4060 Laptop GPU (n=1) | |
| Dell G16, i7-13650HX, RTX 4060 | |
| CrossMark / Productivity | |
| SCHENKER XMG Fusion 15 (Early 24) | |
| Lenovo Legion 5 16IRX G9 | |
| Average of class Gaming (1299 - 2211, n=108, last 2 years) | |
| SCHENKER XMG Pro 15 (E23) | |
| SCHENKER XMG Core 15 (M24) | |
| Average AMD Ryzen 7 8845HS, NVIDIA GeForce RTX 4060 Laptop GPU (n=1) | |
| HP Victus 16 (2024) | |
| Dell G16, i7-13650HX, RTX 4060 | |
| CrossMark / Creativity | |
| SCHENKER XMG Fusion 15 (Early 24) | |
| Lenovo Legion 5 16IRX G9 | |
| Average of class Gaming (1275 - 2729, n=108, last 2 years) | |
| SCHENKER XMG Pro 15 (E23) | |
| HP Victus 16 (2024) | |
| SCHENKER XMG Core 15 (M24) | |
| Average AMD Ryzen 7 8845HS, NVIDIA GeForce RTX 4060 Laptop GPU (n=1) | |
| Dell G16, i7-13650HX, RTX 4060 | |
| CrossMark / Responsiveness | |
| SCHENKER XMG Fusion 15 (Early 24) | |
| Lenovo Legion 5 16IRX G9 | |
| HP Victus 16 (2024) | |
| SCHENKER XMG Pro 15 (E23) | |
| Average of class Gaming (1030 - 2330, n=108, last 2 years) | |
| Dell G16, i7-13650HX, RTX 4060 | |
| SCHENKER XMG Core 15 (M24) | |
| Average AMD Ryzen 7 8845HS, NVIDIA GeForce RTX 4060 Laptop GPU (n=1) | |
| WebXPRT 3 / Overall | |
| SCHENKER XMG Fusion 15 (Early 24) | |
| SCHENKER XMG Pro 15 (E23) | |
| Average of class Gaming (237 - 532, n=109, last 2 years) | |
| Lenovo Legion 5 16IRX G9 | |
| SCHENKER XMG Core 15 (M24) | |
| Average AMD Ryzen 7 8845HS, NVIDIA GeForce RTX 4060 Laptop GPU (305 - 305, n=2) | |
| HP Victus 16 (2024) | |
| Dell G16, i7-13650HX, RTX 4060 | |
| WebXPRT 4 / Overall | |
| SCHENKER XMG Fusion 15 (Early 24) | |
| Lenovo Legion 5 16IRX G9 | |
| Average of class Gaming (176.4 - 341, n=106, last 2 years) | |
| SCHENKER XMG Pro 15 (E23) | |
| SCHENKER XMG Core 15 (M24) | |
| HP Victus 16 (2024) | |
| Average AMD Ryzen 7 8845HS, NVIDIA GeForce RTX 4060 Laptop GPU (176.4 - 264, n=2) | |
| Mozilla Kraken 1.1 / Total | |
| HP Victus 16 (2024) | |
| SCHENKER XMG Pro 15 (E23) | |
| Average AMD Ryzen 7 8845HS, NVIDIA GeForce RTX 4060 Laptop GPU (496 - 523, n=2) | |
| Dell G16, i7-13650HX, RTX 4060 | |
| SCHENKER XMG Core 15 (M24) | |
| Lenovo Legion 5 16IRX G9 | |
| Average of class Gaming (397 - 674, n=120, last 2 years) | |
| SCHENKER XMG Fusion 15 (Early 24) | |
* ... smaller is better
| PCMark 10 Score | 8822 points | |
Help | ||
| AIDA64 / Memory Copy | |
| SCHENKER XMG Fusion 15 (Early 24) | |
| SCHENKER XMG Pro 15 (E23) | |
| Average of class Gaming (21750 - 104987, n=134, last 2 years) | |
| SCHENKER XMG Core 15 (M24) | |
| Average AMD Ryzen 7 8845HS (61459 - 71873, n=13) | |
| HP Victus 16 (2024) | |
| Lenovo Legion 5 16IRX G9 | |
| Dell G16, i7-13650HX, RTX 4060 | |
| AIDA64 / Memory Read | |
| SCHENKER XMG Fusion 15 (Early 24) | |
| SCHENKER XMG Pro 15 (E23) | |
| HP Victus 16 (2024) | |
| Average of class Gaming (22956 - 104349, n=134, last 2 years) | |
| Lenovo Legion 5 16IRX G9 | |
| Dell G16, i7-13650HX, RTX 4060 | |
| SCHENKER XMG Core 15 (M24) | |
| Average AMD Ryzen 7 8845HS (49866 - 61976, n=13) | |
| AIDA64 / Memory Write | |
| SCHENKER XMG Core 15 (M24) | |
| Average AMD Ryzen 7 8845HS (68425 - 93239, n=13) | |
| SCHENKER XMG Pro 15 (E23) | |
| Average of class Gaming (22297 - 133486, n=134, last 2 years) | |
| SCHENKER XMG Fusion 15 (Early 24) | |
| HP Victus 16 (2024) | |
| Dell G16, i7-13650HX, RTX 4060 | |
| Lenovo Legion 5 16IRX G9 | |
| AIDA64 / Memory Latency | |
| Average of class Gaming (59.5 - 259, n=134, last 2 years) | |
| Average AMD Ryzen 7 8845HS (82.5 - 117, n=13) | |
| HP Victus 16 (2024) | |
| Dell G16, i7-13650HX, RTX 4060 | |
| Lenovo Legion 5 16IRX G9 | |
| SCHENKER XMG Core 15 (M24) | |
| SCHENKER XMG Pro 15 (E23) | |
| SCHENKER XMG Fusion 15 (Early 24) | |
* ... smaller is better
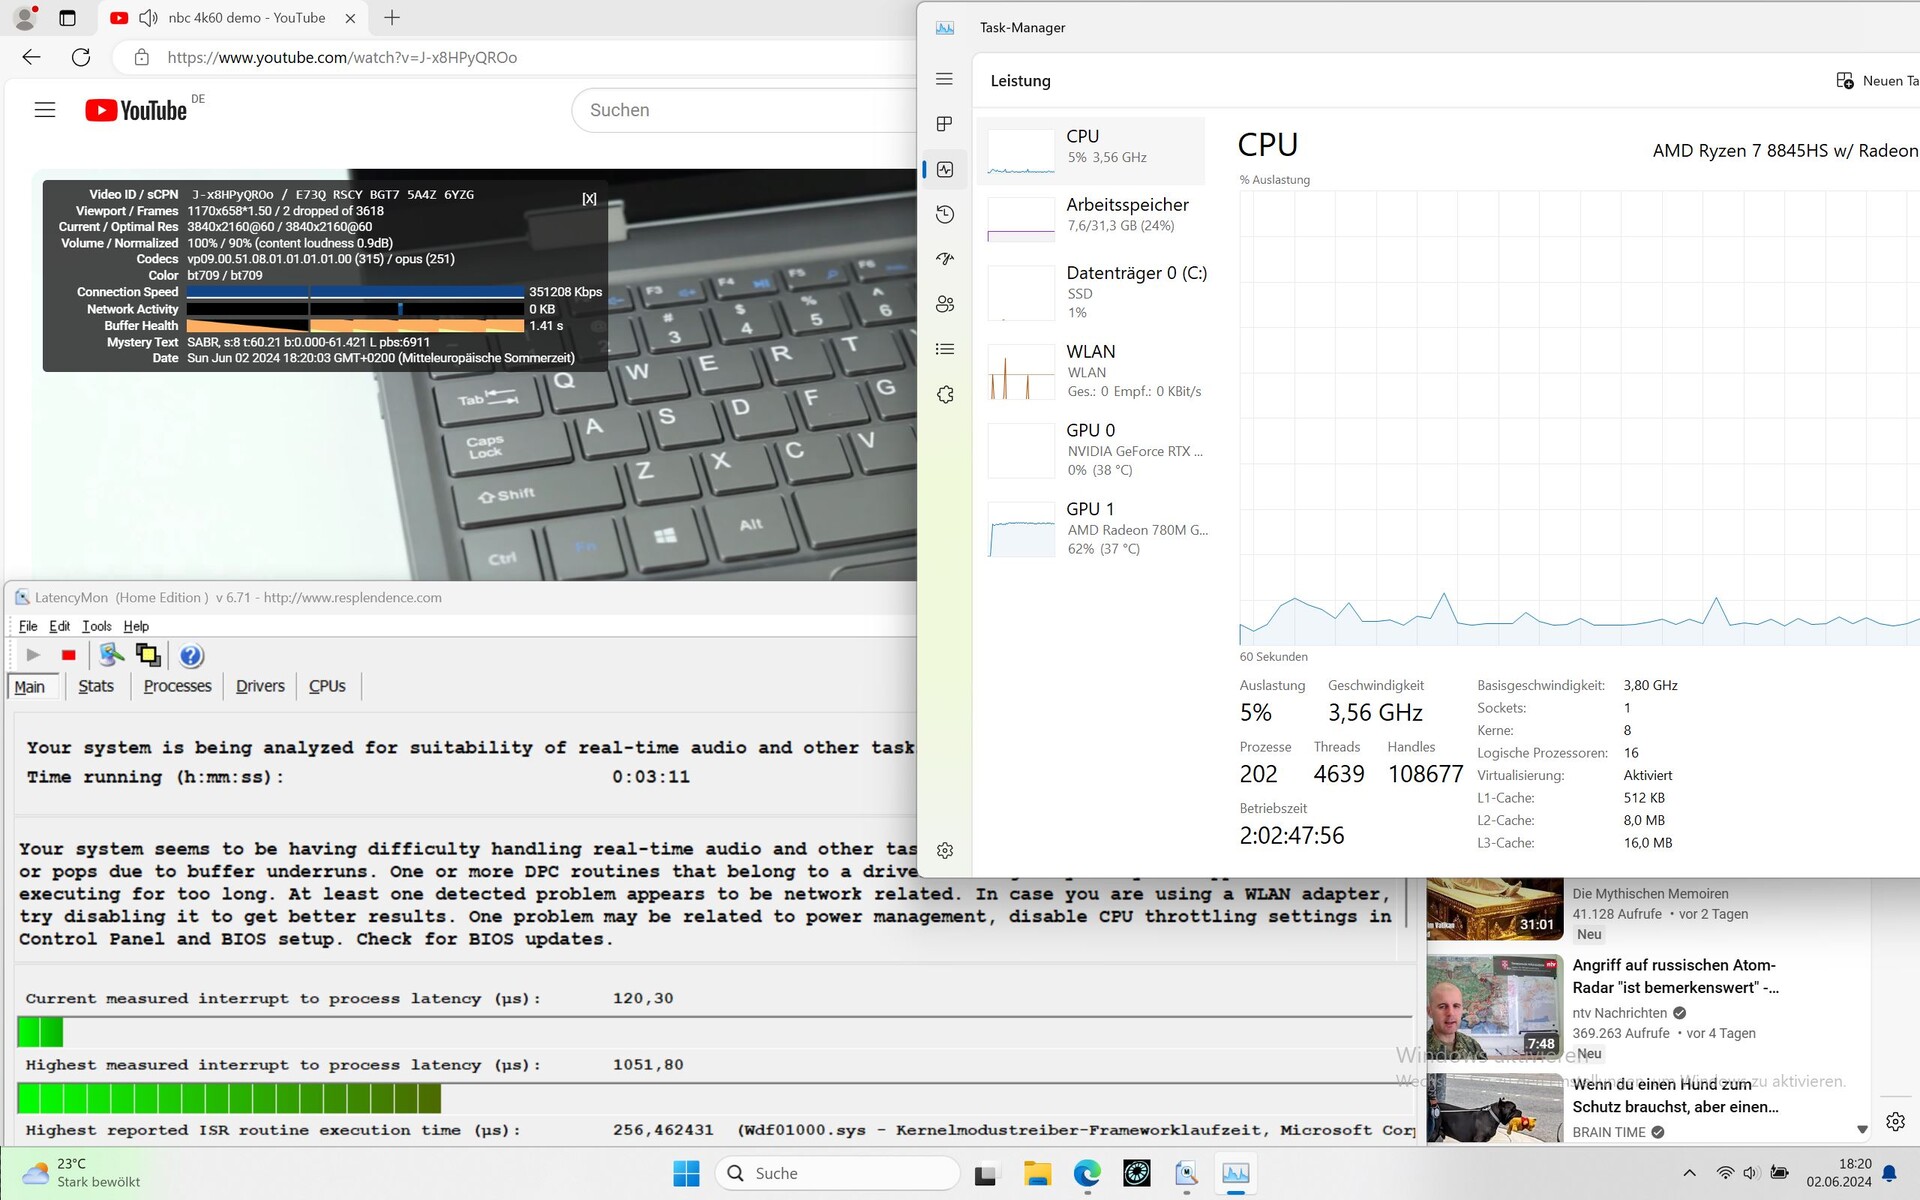
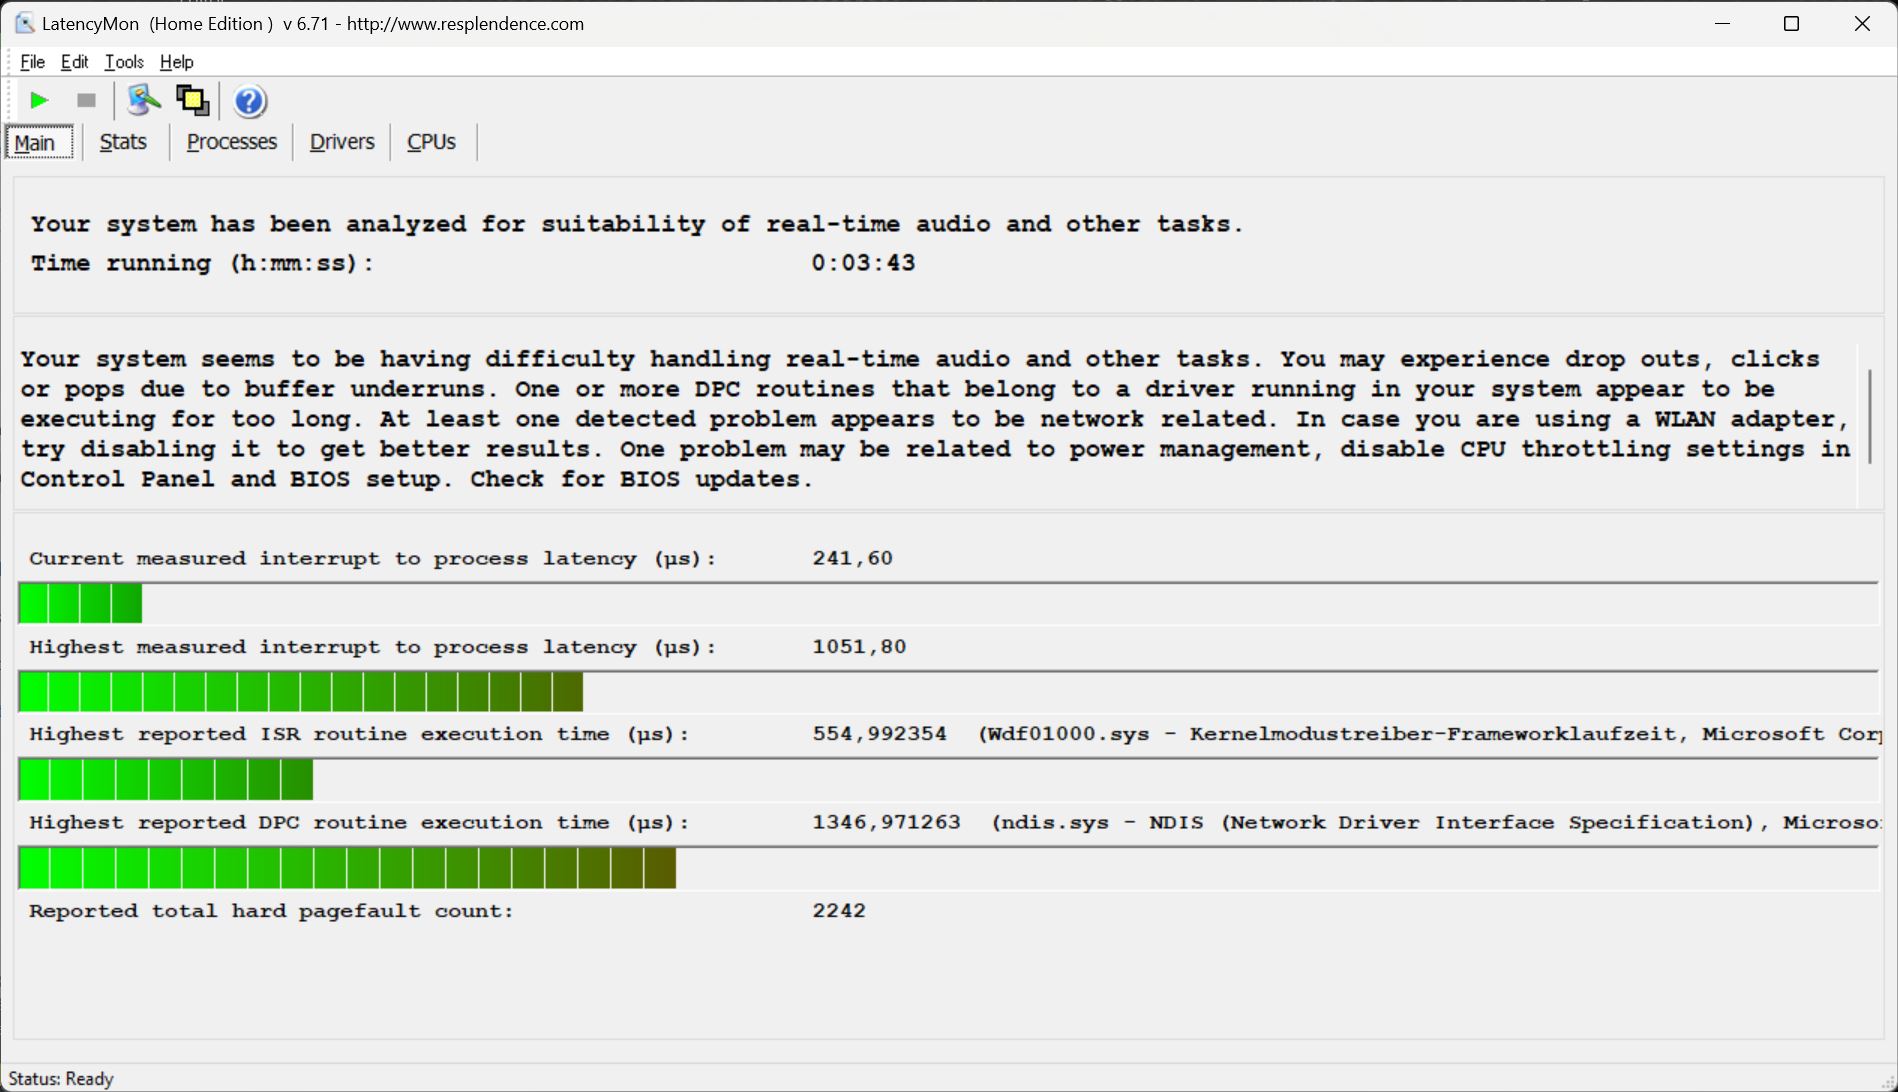
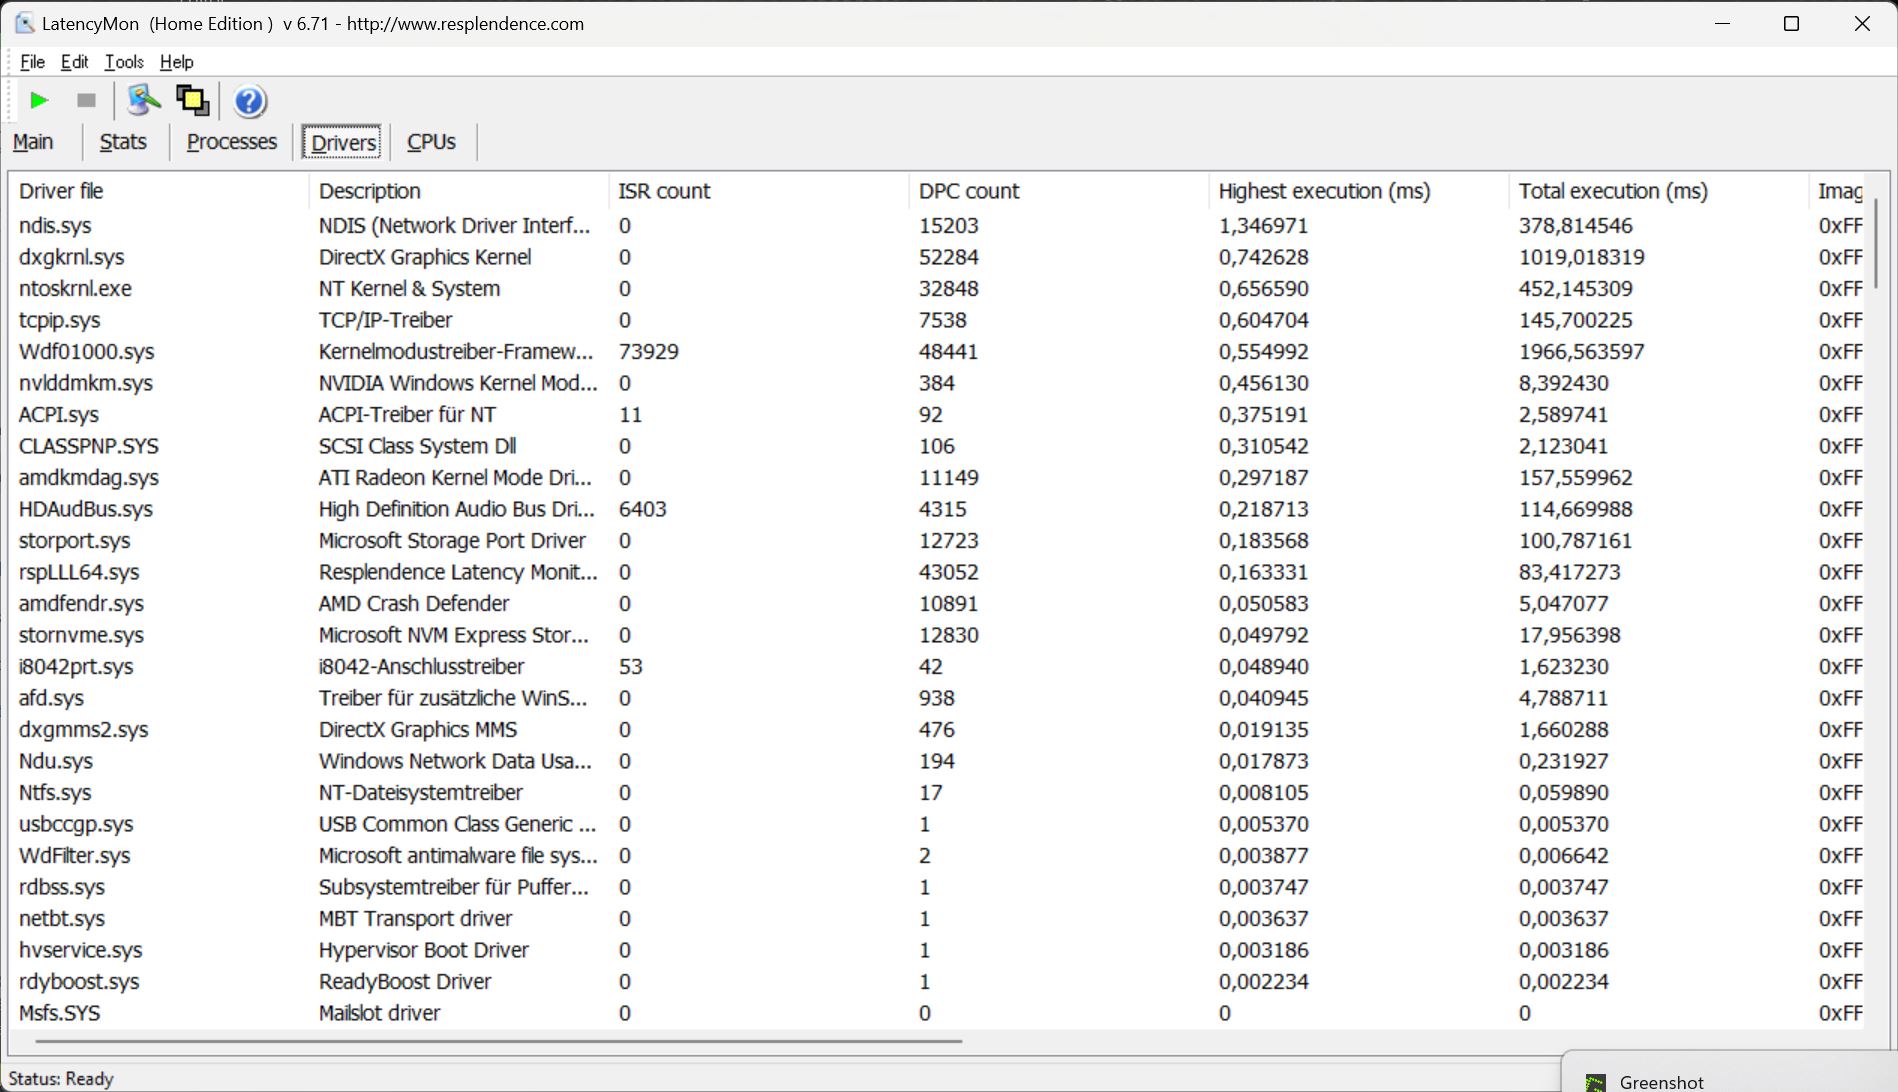
DPC latencies
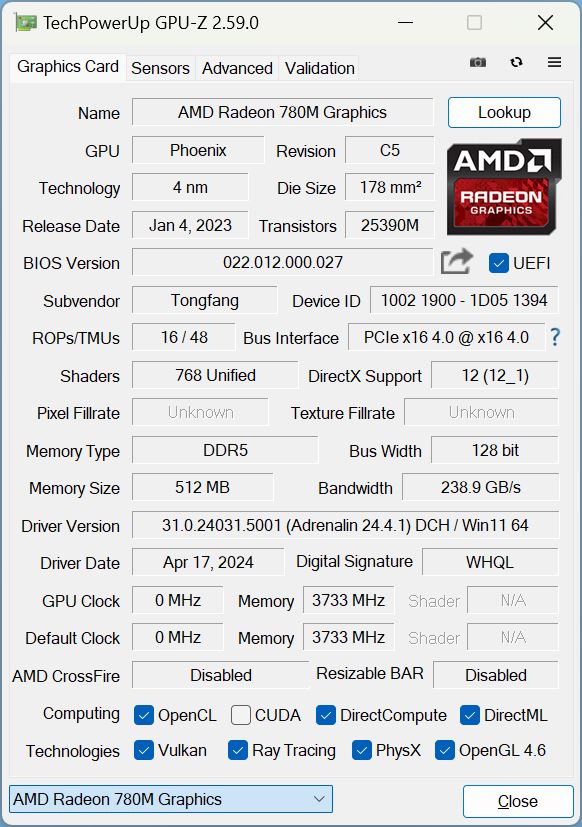
When opening the browser, there are minimal latencies which don't pose any problems - yet. When multiple browser tabs are opened, the latency value increases somewhat. This also applies to our 4K/60fps YouTube video playback and, at 62 percent, the load factor of the internal GPU seems to be quite high. The result is two dropped frames as well as an inglorious second place in the latency ranking.
| DPC Latencies / LatencyMon - interrupt to process latency (max), Web, Youtube, Prime95 | |
| Lenovo Legion 5 16IRX G9 | |
| SCHENKER XMG Core 15 (M24) | |
| Dell G16, i7-13650HX, RTX 4060 | |
| SCHENKER XMG Pro 15 (E23) | |
| HP Victus 16 (2024) | |
| SCHENKER XMG Fusion 15 (Early 24) | |
* ... smaller is better
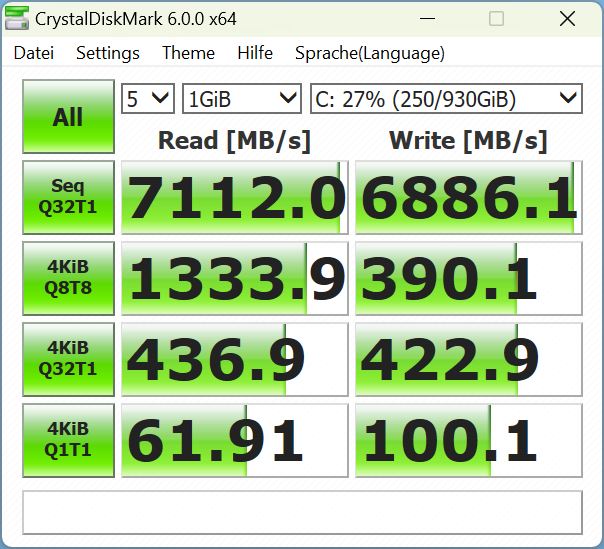
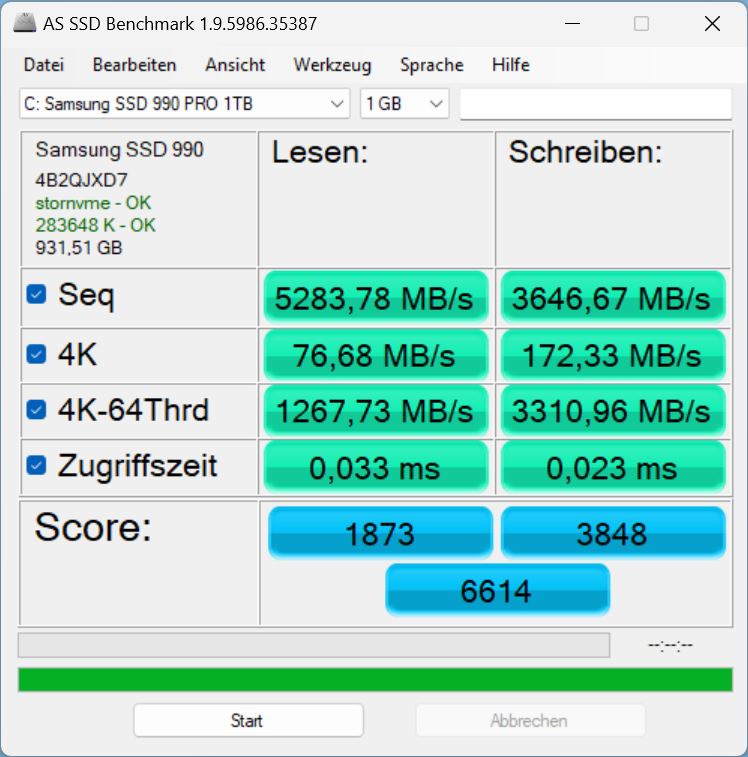
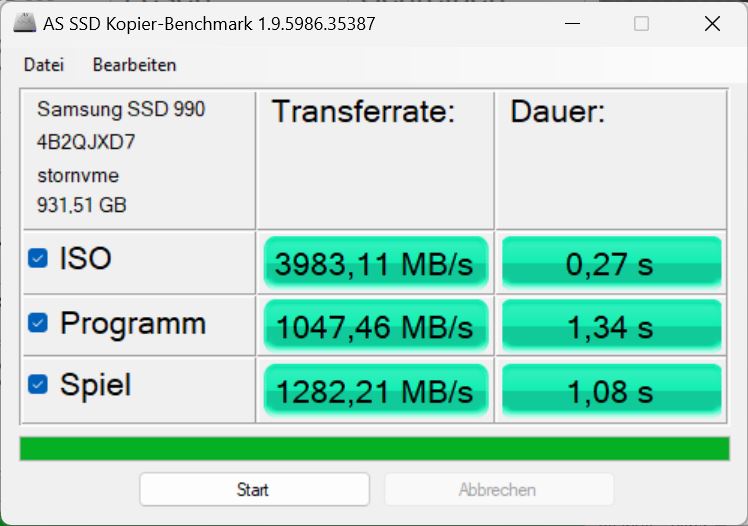
Mass storage
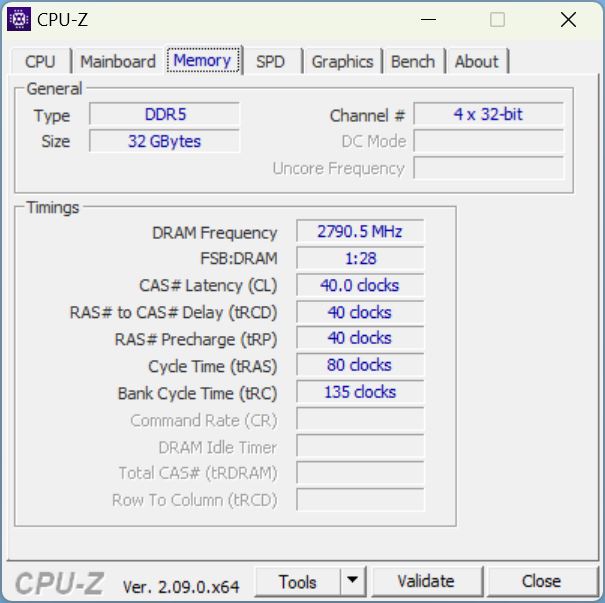
In our review model, Schenker has fitted a speedy Samsung 990 Pro with 1 TB of storage and the Core 15 can be equipped with SSDs from six different companies including diverse models from this manufacturer.
Depending on the test software used (CrystalDiskMark 6, AS SSD, Disksdp) the SSD does better or worse but, all in all, the 990 Pro remains a very fast PCIe 4.0 NVMe SSD that also demonstrated very consistent high levels of performance in our review model running the Diskspd loop.

* ... smaller is better
Continuous Performance Read: DiskSpd Read Loop, Queue Depth 8
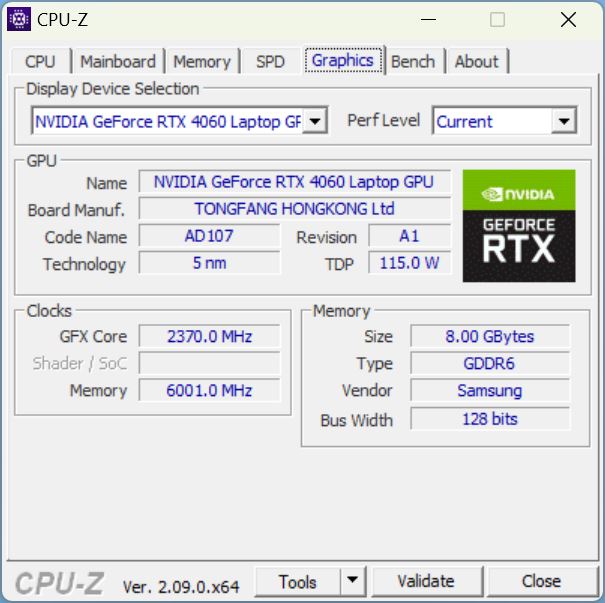
Graphics card
An Nvidia Geforce RTX 4060 serves as the GPU, however, for an additional $200, the Core 15 also comes with an RTX 4070 such as the one in the Fusion 15.
In the 3DMark tests, the Core 15 does exceptionally well. Across all of the tests, even the RTX 4070-equipped Fusion only enjoys an 8 percent advantage with the Core 15 sitting closely behind in second place, in front of the 4060-based competition.
Gaming performance isn't quite as good as the 3DMark results but this is entirely to do with the CPU-intensive titles such as DOTA 2 Reborn or X-Plane. Setting these titles to one side, when it comes to CPU-intensive games, the Core 15 sees eye-to-eye with the best RTX 4060 comparison devices. The latter runs all titles in Full HD at over 60fps and doesn't even present any problems at its native QHD resolution, even though titles such as Cyberpunk 2077 occasionally dip below the 60fps mark.
The Witcher 3 graph shows very stable performance over more than one hour with the game's usual day/night rhythm. In this area, the performance is also on the same level as the RTX 4060 competition. The table below shows the scores relating to the various performance profiles with the only inconsistency to be found in the balanced mode. For the first few minutes, it displays the same performance as in the enthusiast mode with the frame rate and consumption then dipping briefly and only managing to sit at battery mode level.
In battery mode, the 3D performance drops in Fire Strike by around 39 percent.
| Performance profile/value | Witcher 3 FPS (Start - after 5 min) | GPU speed | GPU power consumption | volume | consumption |
|---|---|---|---|---|---|
| Overboost | 103 - 101 | 2,720 MHz | 108.5 W | 50.96 dB | 167 W |
| Enthusiast | 97 - 92 | 2,640 MHz | 102.7 | 49 dB | 156 W |
| Balanced | 97 - 65 | 1,880 MHz | 47.86 W | Initially 39.75, then after a few minutes a consisitent 31 dB | Initially 154, then 67 W |
| 3DMark 11 Performance | 34005 points | |
| 3DMark Cloud Gate Standard Score | 69309 points | |
| 3DMark Fire Strike Score | 26988 points | |
| 3DMark Time Spy Score | 11597 points | |
Help | ||
* ... smaller is better
| The Witcher 3 - 1920x1080 Ultra Graphics & Postprocessing (HBAO+) | |
| SCHENKER XMG Pro 15 (E23) | |
| Average of class Gaming (18.4 - 240, n=62, last 2 years) | |
| SCHENKER XMG Fusion 15 (Early 24) | |
| SCHENKER XMG Core 15 (M24) | |
| Dell G16, i7-13650HX, RTX 4060 | |
| HP Victus 16 (2024) | |
| Lenovo Legion 5 16IRX G9 | |
| GTA V - 1920x1080 Highest Settings possible AA:4xMSAA + FX AF:16x | |
| SCHENKER XMG Fusion 15 (Early 24) | |
| Average of class Gaming (12.1 - 186.9, n=122, last 2 years) | |
| Lenovo Legion 5 16IRX G9 | |
| Dell G16, i7-13650HX, RTX 4060 | |
| SCHENKER XMG Core 15 (M24) | |
| HP Victus 16 (2024) | |
| SCHENKER XMG Pro 15 (E23) | |
| Final Fantasy XV Benchmark - 1920x1080 High Quality | |
| Average of class Gaming (19.2 - 215, n=133, last 2 years) | |
| SCHENKER XMG Fusion 15 (Early 24) | |
| SCHENKER XMG Core 15 (M24) | |
| Lenovo Legion 5 16IRX G9 | |
| Dell G16, i7-13650HX, RTX 4060 | |
| HP Victus 16 (2024) | |
| Dota 2 Reborn - 1920x1080 ultra (3/3) best looking | |
| SCHENKER XMG Fusion 15 (Early 24) | |
| Lenovo Legion 5 16IRX G9 | |
| Average of class Gaming (65.1 - 248, n=136, last 2 years) | |
| SCHENKER XMG Pro 15 (E23) | |
| HP Victus 16 (2024) | |
| Dell G16, i7-13650HX, RTX 4060 | |
| SCHENKER XMG Core 15 (M24) | |
Witcher 3 FPS diagram
| low | med. | high | ultra | QHD | 4K | |
|---|---|---|---|---|---|---|
| GTA V (2015) | 185 | 180.5 | 174.7 | 116.7 | 91.7 | |
| The Witcher 3 (2015) | 402.5 | 337.4 | 215.5 | 111.7 | 83.4 | |
| Dota 2 Reborn (2015) | 165.2 | 150.9 | 145.4 | 135.2 | 131.5 | |
| Final Fantasy XV Benchmark (2018) | 225 | 153.7 | 107.2 | 79.4 | ||
| X-Plane 11.11 (2018) | 143.5 | 125.1 | 97.2 | 90.7 | ||
| Far Cry 5 (2018) | 162 | 142 | 137 | 128 | 108 | |
| Strange Brigade (2018) | 434 | 305 | 242 | 204 | 136.3 | |
| Baldur's Gate 3 (2023) | 160.3 | 125.7 | 110.7 | 105.5 | 72.2 | |
| Cyberpunk 2077 2.2 Phantom Liberty (2023) | 136.1 | 107.2 | 91 | 93.1 | 48.2 | |
| Skull & Bones (2024) | 146 | 127 | 101 | 73 | 57 |
Emissions & Energy - A hot potato but economical
Noise emissions
While running idle on the desktop, the fans remain mostly inactive. However, with even the slightest everyday load, such as opening a browser and surfing the net, they are activated and then hum away at a quiet 27 dB. This is normally the kind of volume you will be dealing with.
Under heavy load, the fan volume can increase to up to 52 dB but, when the load period is over, they calm down very quickly again. But then things aren't silent again for quite some time, even when running idle.
By comparison, the HP Victus as well as the Dell G16 are a little quieter when gaming and, with the Legion 5 getting louder, the Core 15 sits somewhere in between both devices.
Noise level
| Idle |
| 23 / 23 / 23 dB(A) |
| Load |
| 38.92 / 52.09 dB(A) |
 | ||
30 dB silent 40 dB(A) audible 50 dB(A) loud |
||
min: | ||
| SCHENKER XMG Core 15 (M24) NVIDIA GeForce RTX 4060 Laptop GPU, R7 8845HS, Samsung 990 Pro 1 TB | Lenovo Legion 5 16IRX G9 NVIDIA GeForce RTX 4060 Laptop GPU, i7-14650HX, Samsung PM9A1 MZVL21T0HCLR | HP Victus 16 (2024) NVIDIA GeForce RTX 4060 Laptop GPU, i7-14700HX, Kioxia XG8 KXG80ZNV512G | Dell G16, i7-13650HX, RTX 4060 NVIDIA GeForce RTX 4060 Laptop GPU, i7-13650HX, WD PC SN740 SDDPNQD-1T00 | SCHENKER XMG Fusion 15 (Early 24) NVIDIA GeForce RTX 4070 Laptop GPU, i9-14900HX, Samsung 990 Pro 1 TB | SCHENKER XMG Pro 15 (E23) NVIDIA GeForce RTX 4060 Laptop GPU, i9-13900HX, Crucial P5 Plus 1TB CT1000P5PSSD8 | |
|---|---|---|---|---|---|---|
| Noise | -14% | -13% | 3% | -18% | -9% | |
| off / environment * (dB) | 23 | 24 -4% | 25 -9% | 23 -0% | 25 -9% | 24 -4% |
| Idle Minimum * (dB) | 23 | 24 -4% | 28 -22% | 23 -0% | 27 -17% | 24 -4% |
| Idle Average * (dB) | 23 | 28.8 -25% | 29 -26% | 23 -0% | 28 -22% | 24 -4% |
| Idle Maximum * (dB) | 23 | 32 -39% | 33 -43% | 27.96 -22% | 33 -43% | 24 -4% |
| Load Average * (dB) | 38.92 | 45.5 -17% | 45 -16% | 27.96 28% | 52 -34% | 53.65 -38% |
| Witcher 3 ultra * (dB) | 50.96 | 53.1 -4% | 43 16% | 47.89 6% | 51 -0% | 53.53 -5% |
| Cyberpunk 2077 ultra * (dB) | 52.06 | |||||
| Load Maximum * (dB) | 52.09 | 55.7 -7% | 48 8% | 47.89 8% | 53 -2% | 53.65 -3% |
* ... smaller is better
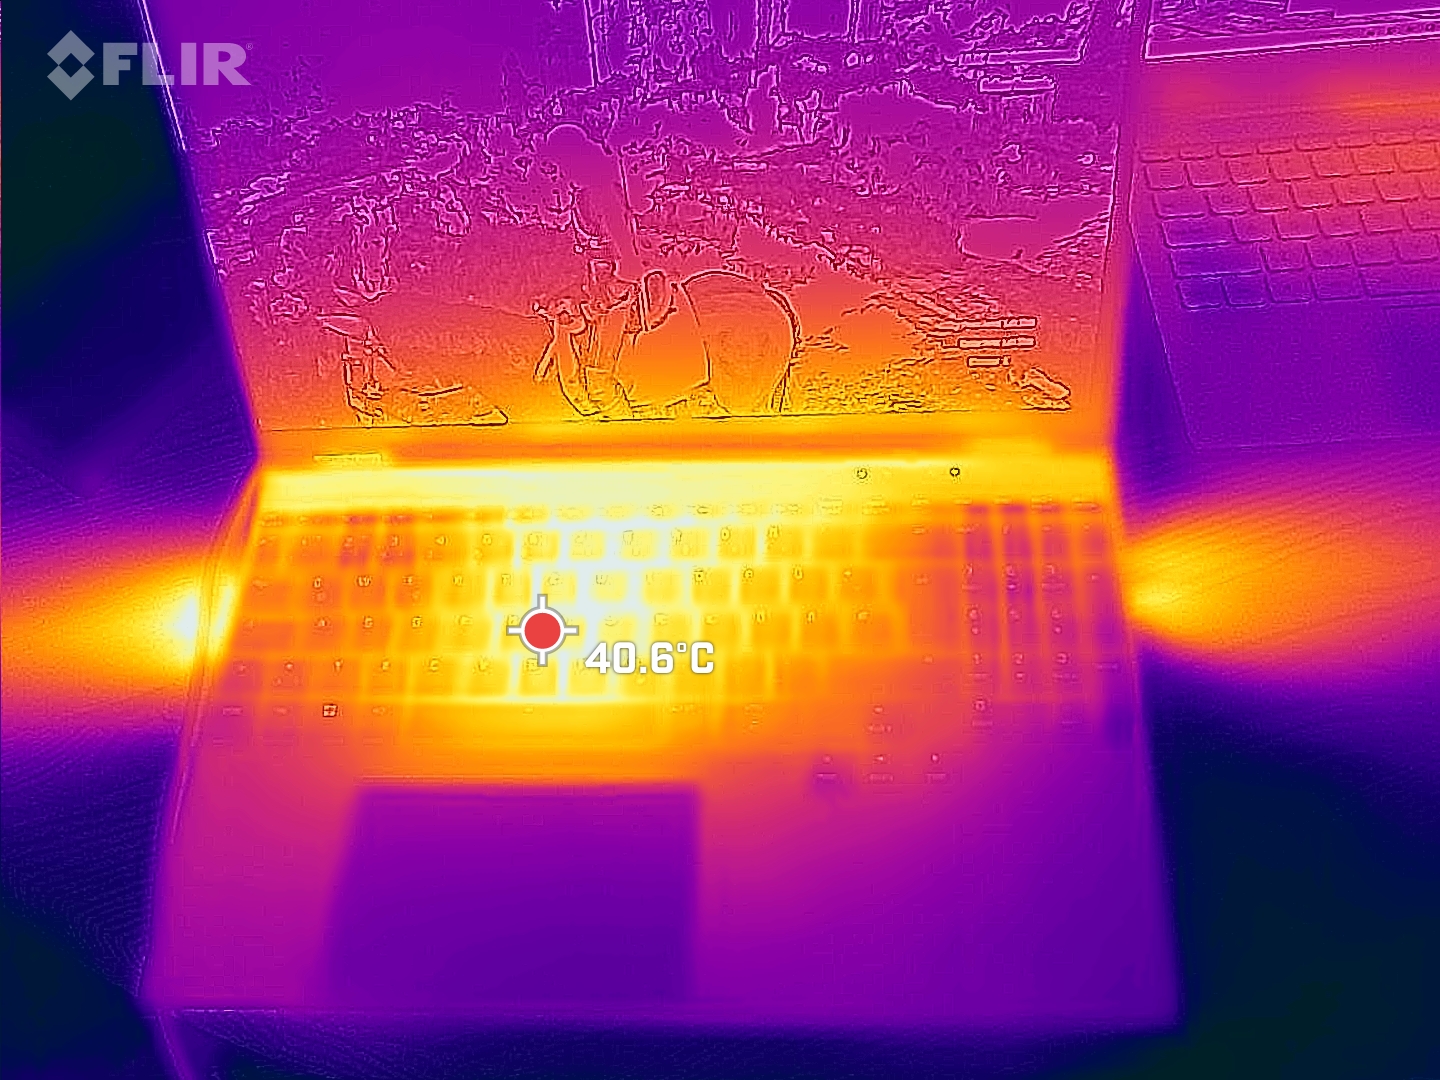
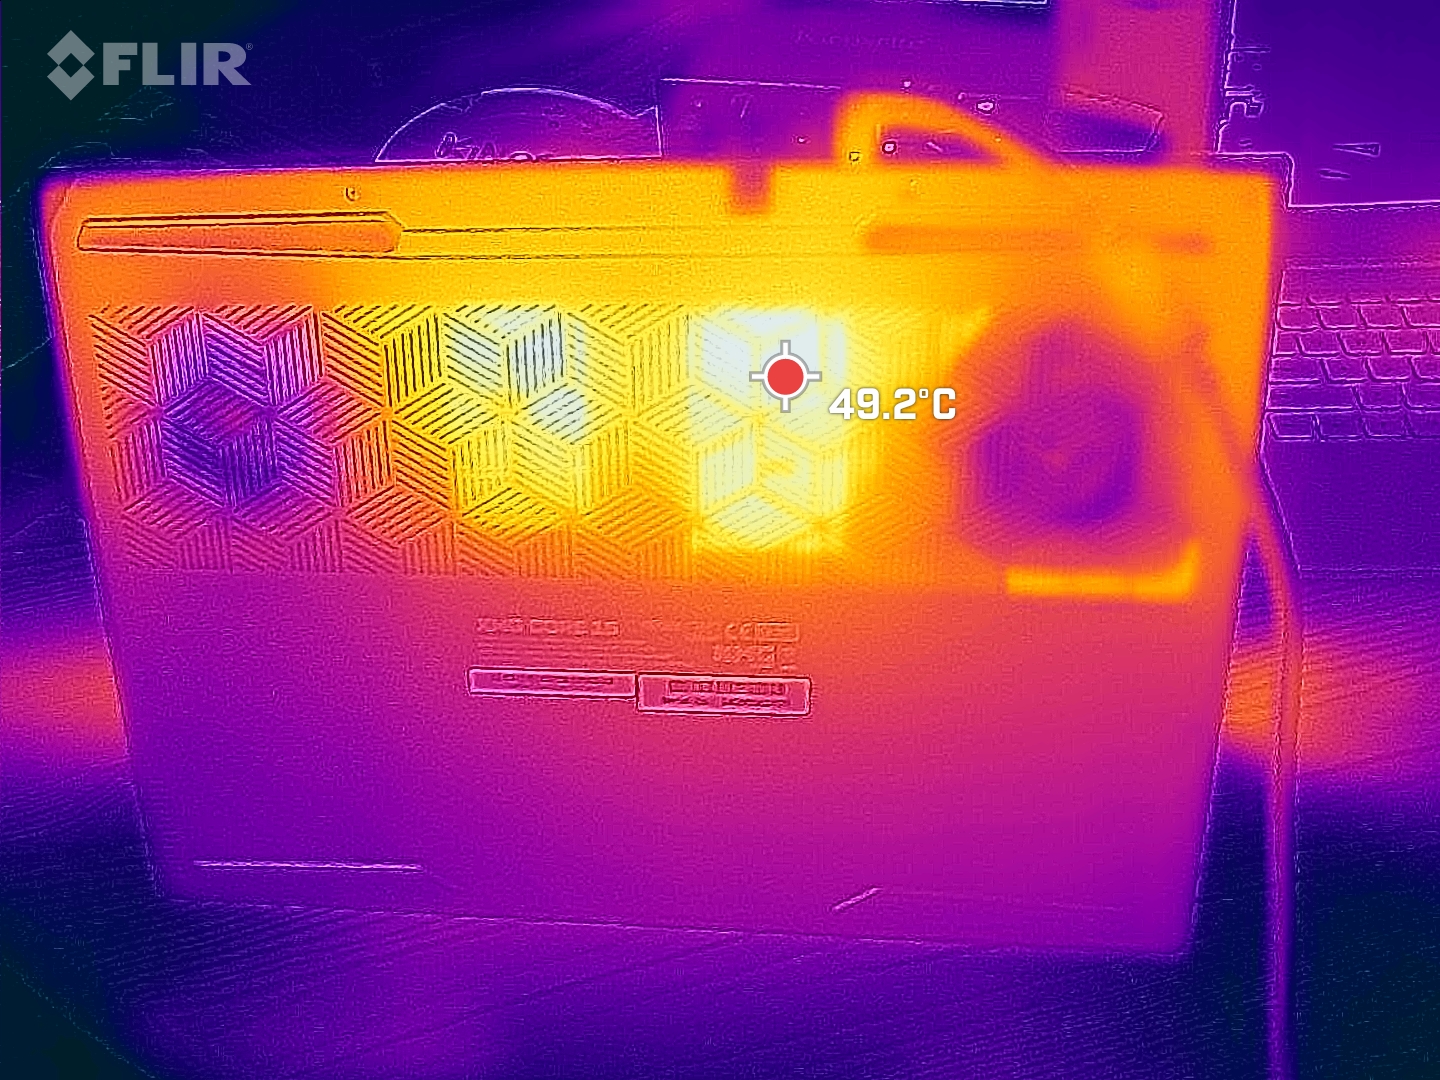
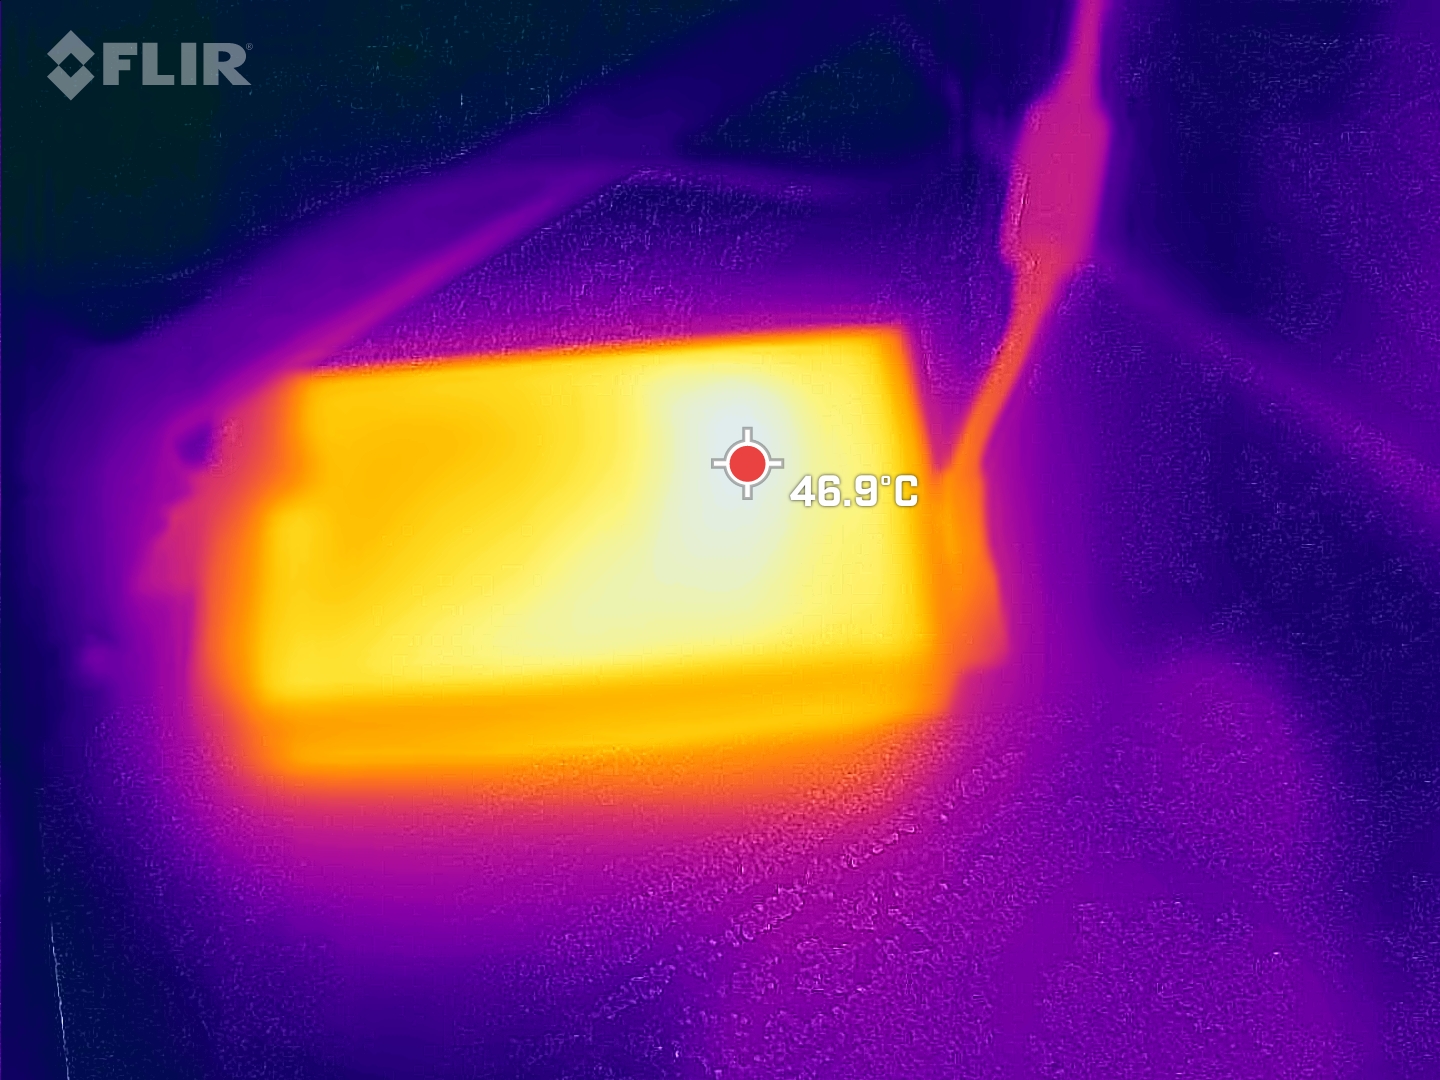
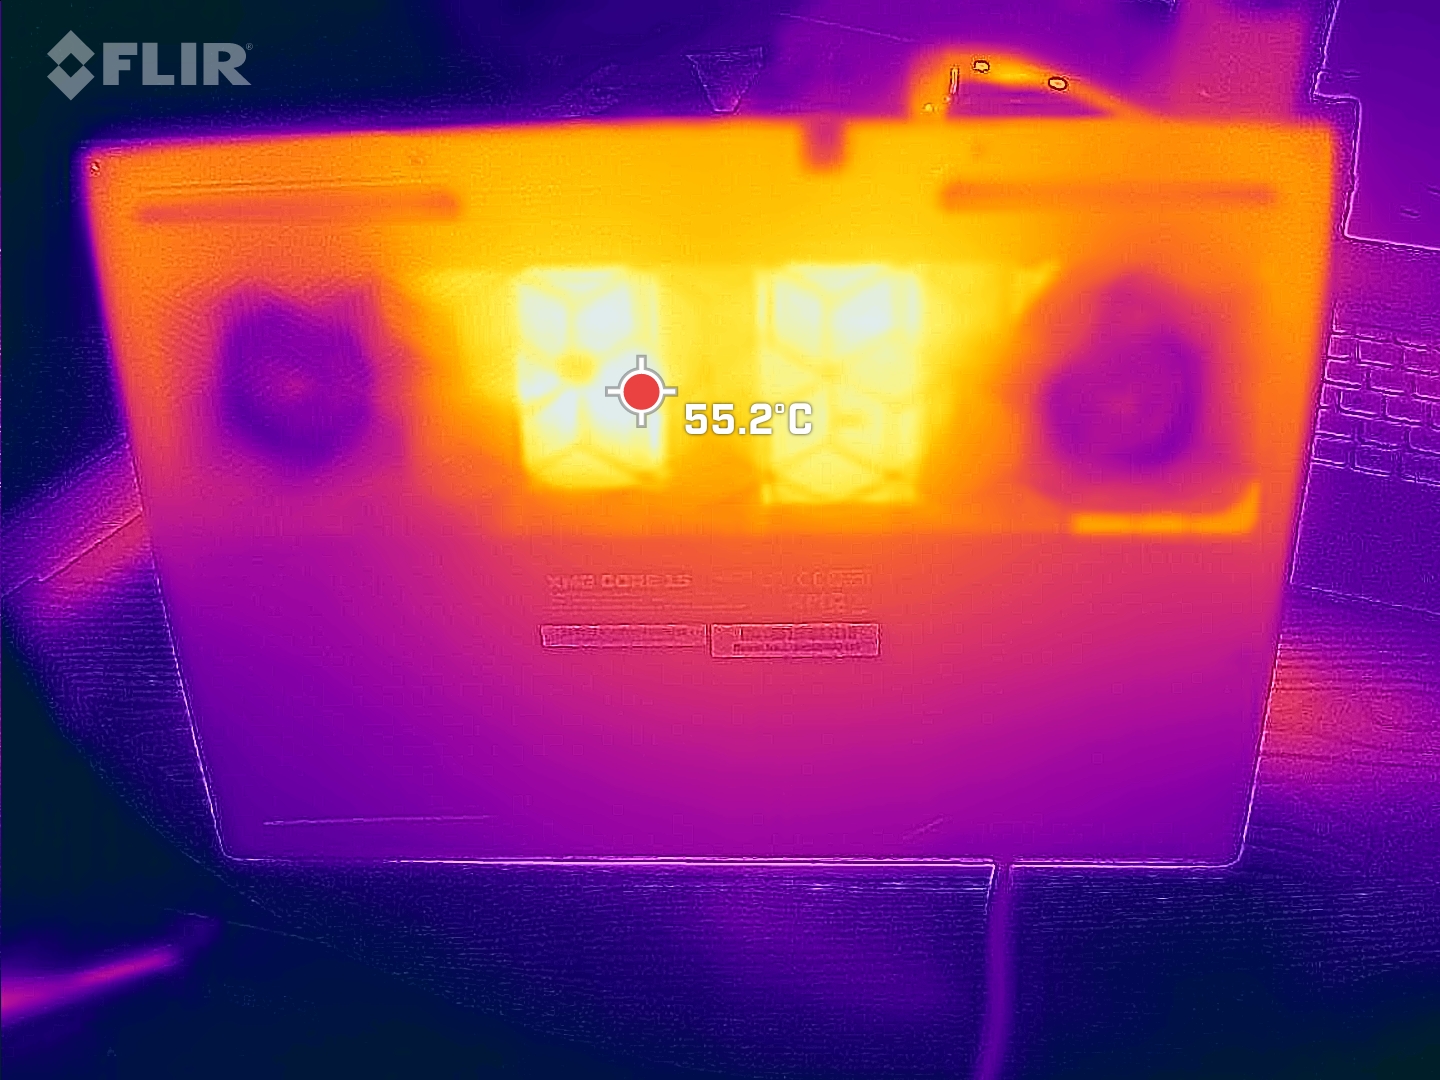
Temperature
The Core 15 doesn't really remain cool, with the metal case heating up quite a lot to become an additional source of warmth, especially on the base of the unit. The palm rests remain comparatively cool.
Even running idle with the fans switched off, at around 35 °C, it gets quite warm but within reasonable bounds. When gaming, the hotspot on the base of the device, central to the display, warms up to 55°C and reaches just over 60 °C in the stress test. It's in this area that the competition manages to remain quite a bit cooler, even the Fusion 15 with its more powerful GPU. This may also have an impact on the RTX 4070 configuration resulting in possible thermal throttling.
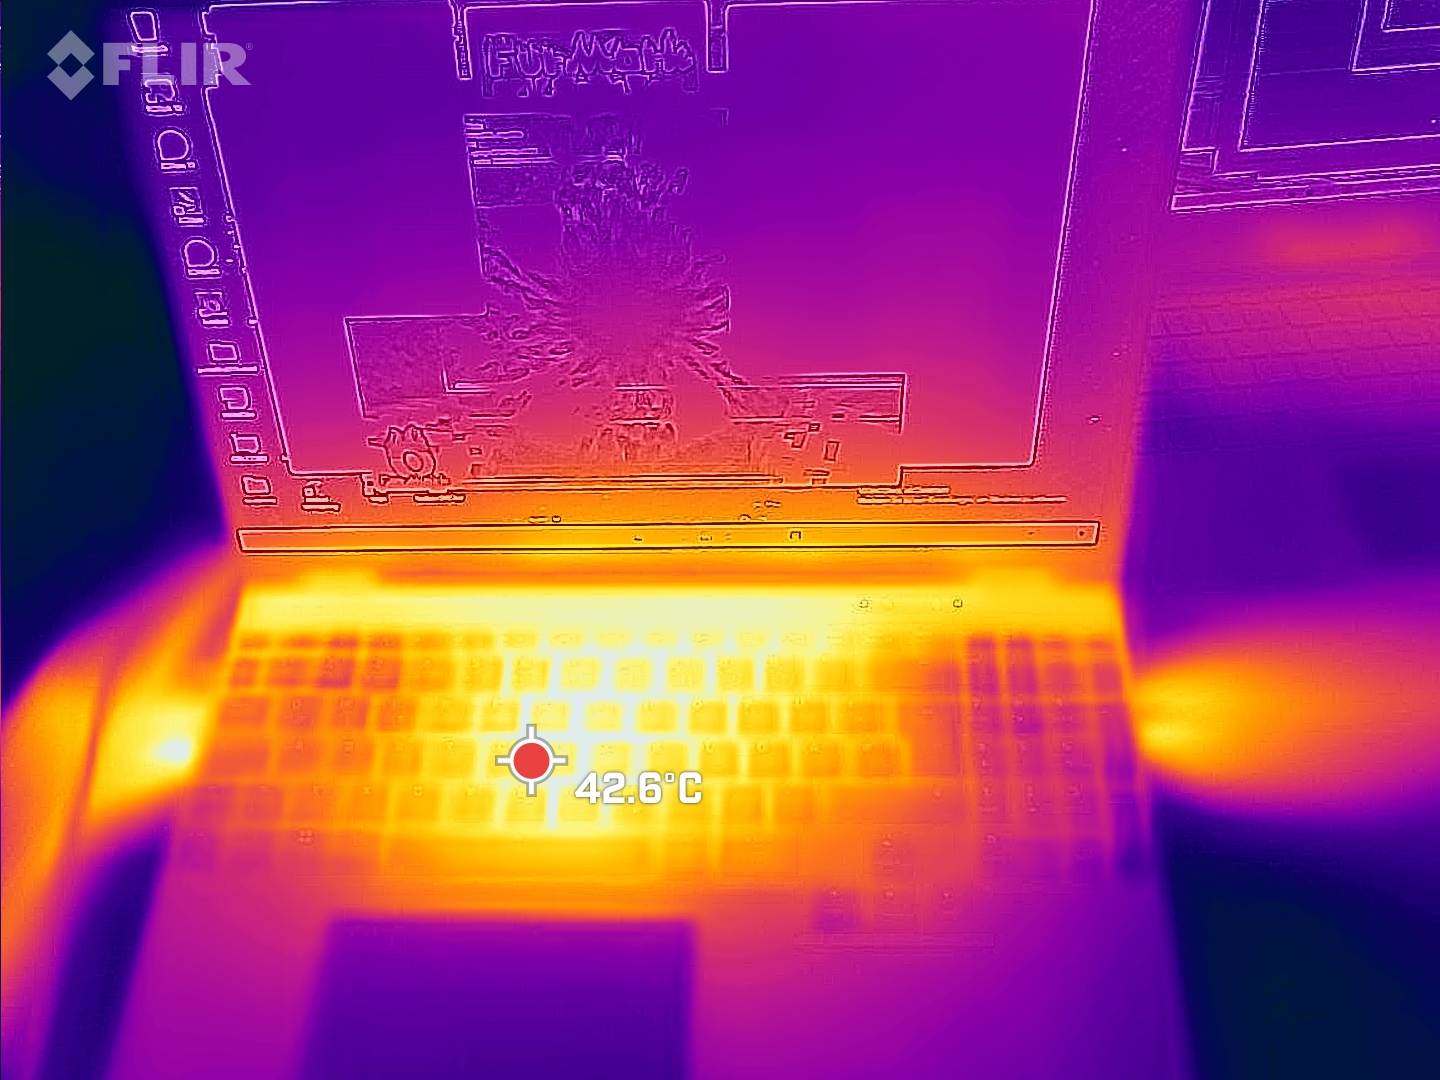
(-) The maximum temperature on the upper side is 52 °C / 126 F, compared to the average of 40.5 °C / 105 F, ranging from 21.2 to 68.8 °C for the class Gaming.
(-) The bottom heats up to a maximum of 61 °C / 142 F, compared to the average of 43.3 °C / 110 F
(±) In idle usage, the average temperature for the upper side is 32.7 °C / 91 F, compared to the device average of 33.9 °C / 93 F.
(-) Playing The Witcher 3, the average temperature for the upper side is 39.2 °C / 103 F, compared to the device average of 33.9 °C / 93 F.
(+) The palmrests and touchpad are reaching skin temperature as a maximum (34 °C / 93.2 F) and are therefore not hot.
(-) The average temperature of the palmrest area of similar devices was 28.9 °C / 84 F (-5.1 °C / -9.2 F).
| SCHENKER XMG Core 15 (M24) AMD Ryzen 7 8845HS, NVIDIA GeForce RTX 4060 Laptop GPU | Lenovo Legion 5 16IRX G9 Intel Core i7-14650HX, NVIDIA GeForce RTX 4060 Laptop GPU | HP Victus 16 (2024) Intel Core i7-14700HX, NVIDIA GeForce RTX 4060 Laptop GPU | Dell G16, i7-13650HX, RTX 4060 Intel Core i7-13650HX, NVIDIA GeForce RTX 4060 Laptop GPU | SCHENKER XMG Fusion 15 (Early 24) Intel Core i9-14900HX, NVIDIA GeForce RTX 4070 Laptop GPU | SCHENKER XMG Pro 15 (E23) Intel Core i9-13900HX, NVIDIA GeForce RTX 4060 Laptop GPU | |
|---|---|---|---|---|---|---|
| Heat | 18% | 21% | 5% | 16% | 12% | |
| Maximum Upper Side * (°C) | 52 | 40.4 22% | 50 4% | 49 6% | 48 8% | 50 4% |
| Maximum Bottom * (°C) | 61 | 43.8 28% | 50 18% | 58 5% | 56 8% | 50 18% |
| Idle Upper Side * (°C) | 35 | 30.3 13% | 25 29% | 35 -0% | 28 20% | 33 6% |
| Idle Bottom * (°C) | 39 | 35.3 9% | 26 33% | 35 10% | 29 26% | 32 18% |
* ... smaller is better
Speakers
Highs and mids are linear and balanced but bass is hardly audible and the speakers could also be louder. Connecting analogue audio equipment can be achieved via the 3.5 mm headset port.
SCHENKER XMG Core 15 (M24) audio analysis
(±) | speaker loudness is average but good (79.12 dB)
Bass 100 - 315 Hz
(-) | nearly no bass - on average 16.7% lower than median
(-) | bass is not linear (15.7% delta to prev. frequency)
Mids 400 - 2000 Hz
(+) | balanced mids - only 4.5% away from median
(+) | mids are linear (4.4% delta to prev. frequency)
Highs 2 - 16 kHz
(+) | balanced highs - only 1% away from median
(+) | highs are linear (2.7% delta to prev. frequency)
Overall 100 - 16.000 Hz
(+) | overall sound is linear (13.7% difference to median)
Compared to same class
» 21% of all tested devices in this class were better, 6% similar, 73% worse
» The best had a delta of 6%, average was 18%, worst was 132%
Compared to all devices tested
» 14% of all tested devices were better, 4% similar, 82% worse
» The best had a delta of 4%, average was 24%, worst was 134%
Apple MacBook Pro 16 2021 M1 Pro audio analysis
(+) | speakers can play relatively loud (84.7 dB)
Bass 100 - 315 Hz
(+) | good bass - only 3.8% away from median
(+) | bass is linear (5.2% delta to prev. frequency)
Mids 400 - 2000 Hz
(+) | balanced mids - only 1.3% away from median
(+) | mids are linear (2.1% delta to prev. frequency)
Highs 2 - 16 kHz
(+) | balanced highs - only 1.9% away from median
(+) | highs are linear (2.7% delta to prev. frequency)
Overall 100 - 16.000 Hz
(+) | overall sound is linear (4.6% difference to median)
Compared to same class
» 0% of all tested devices in this class were better, 0% similar, 100% worse
» The best had a delta of 5%, average was 18%, worst was 45%
Compared to all devices tested
» 0% of all tested devices were better, 0% similar, 100% worse
» The best had a delta of 4%, average was 24%, worst was 134%
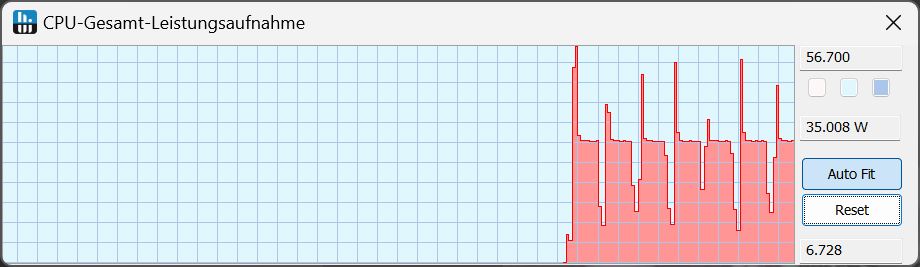
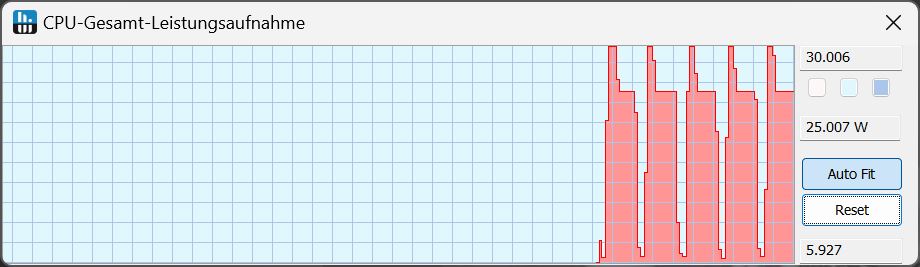
Power consumption
The Core 15 is slightly more economical than the competition, especially when running idle - all very good. The consumption also remains moderate when gaming.
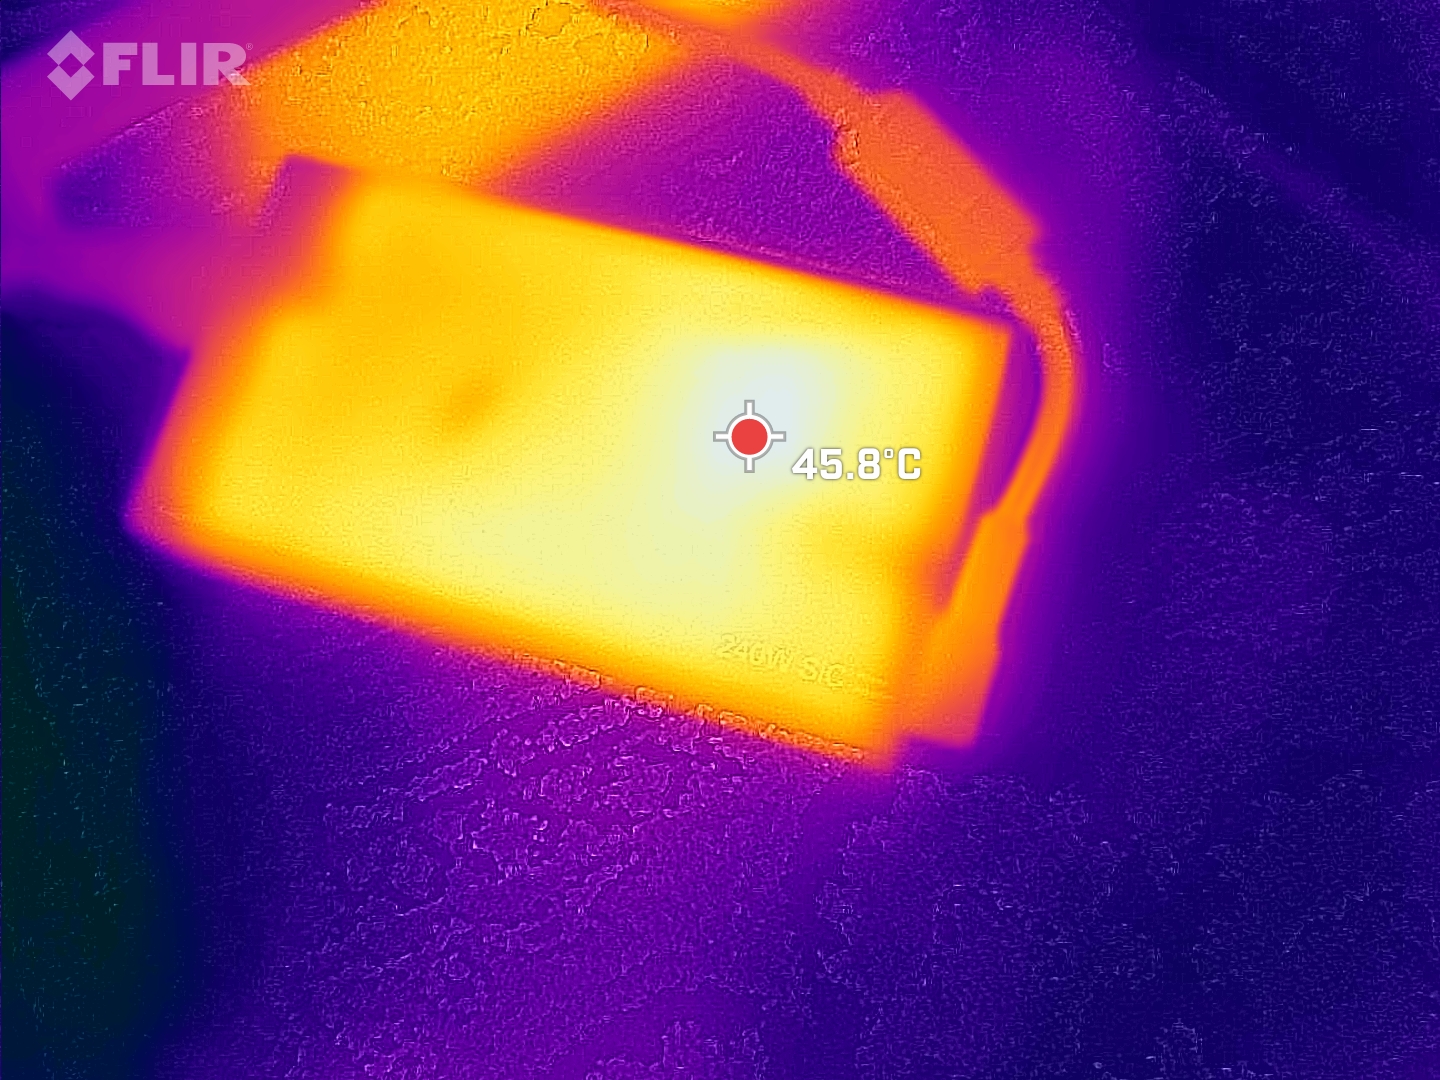
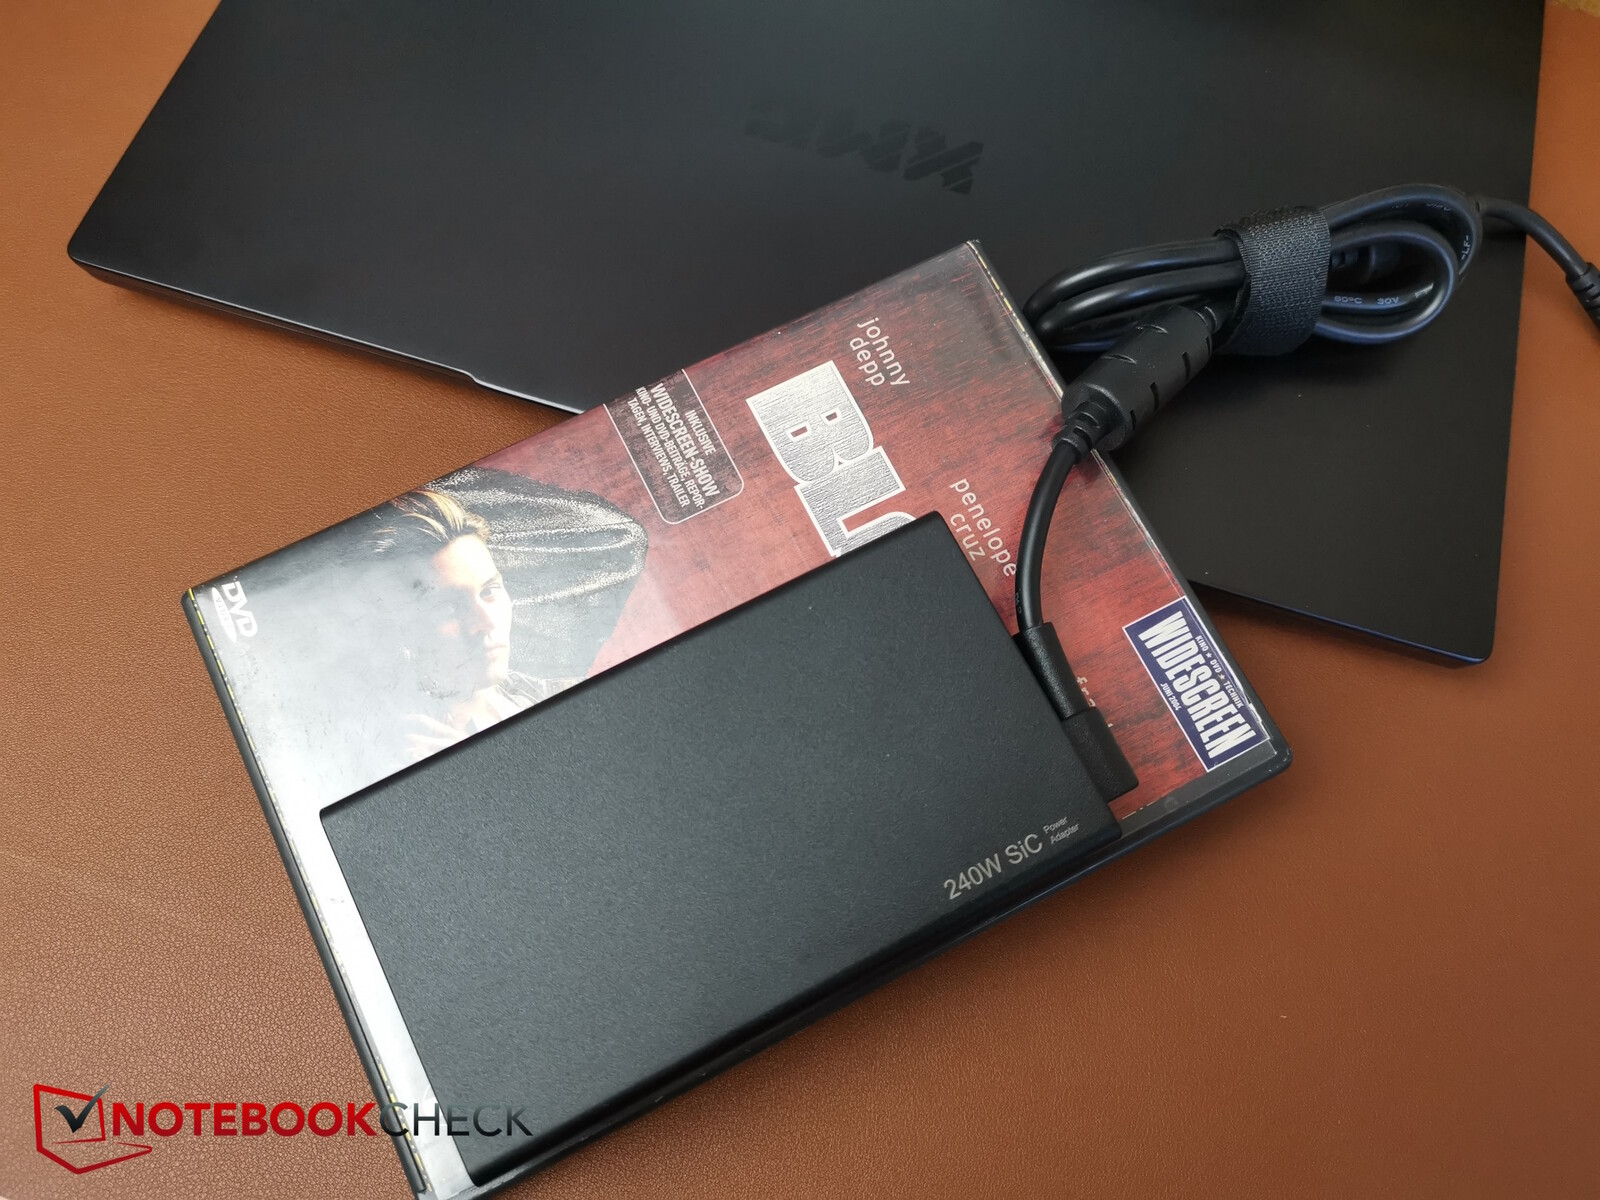
In the stress test, we temporarily measured consumption values of up to 286 W which could theoretically somewhat overwhelm the 240 W PSU. Nevertheless, these load peaks are really only temporary. When gaming, we measured an average consumption of only 167 W and this is something the PSU should be able to handle at all times.
Speaking of the PSU, Schenker appears to have made improvements here having shrunk its dimensions. Instead of the chunky 240 W Chicony PSU, the manufacturer has also gone for a 240 W unit but in a significantly smaller form factor. This is very beneficial for mobility.
| Off / Standby | |
| Idle | |
| Load |
|
Key:
min: | |
| SCHENKER XMG Core 15 (M24) R7 8845HS, NVIDIA GeForce RTX 4060 Laptop GPU, Samsung 990 Pro 1 TB, IPS, 2560x1600, 15.3" | Lenovo Legion 5 16IRX G9 i7-14650HX, NVIDIA GeForce RTX 4060 Laptop GPU, Samsung PM9A1 MZVL21T0HCLR, IPS, 2560x1600, 16" | HP Victus 16 (2024) i7-14700HX, NVIDIA GeForce RTX 4060 Laptop GPU, Kioxia XG8 KXG80ZNV512G, IPS, 1920x1080, 16.1" | Dell G16, i7-13650HX, RTX 4060 i7-13650HX, NVIDIA GeForce RTX 4060 Laptop GPU, WD PC SN740 SDDPNQD-1T00, IPS, 2560x1600, 16" | SCHENKER XMG Fusion 15 (Early 24) i9-14900HX, NVIDIA GeForce RTX 4070 Laptop GPU, Samsung 990 Pro 1 TB, IPS, 2560x1600, 15.3" | SCHENKER XMG Pro 15 (E23) i9-13900HX, NVIDIA GeForce RTX 4060 Laptop GPU, Crucial P5 Plus 1TB CT1000P5PSSD8, IPS, 2560x1440, 15.6" | Average NVIDIA GeForce RTX 4060 Laptop GPU | Average of class Gaming | |
|---|---|---|---|---|---|---|---|---|
| Power Consumption | -36% | -13% | -13% | -20% | -100% | -20% | -54% | |
| Idle Minimum * (Watt) | 9.3 | 15.4 -66% | 9 3% | 11 -18% | 8 14% | 21.6 -132% | 11.5 ? -24% | 14.2 ? -53% |
| Idle Average * (Watt) | 12.9 | 19.7 -53% | 15 -16% | 14.8 -15% | 14 -9% | 29 -125% | 16 ? -24% | 20.2 ? -57% |
| Idle Maximum * (Watt) | 12.8 | 20.7 -62% | 23 -80% | 16.8 -31% | 26 -103% | 42.7 -234% | 20.3 ? -59% | 27.3 ? -113% |
| Witcher 3 ultra * (Watt) | 167 | 191.3 -15% | 143.7 14% | 185 -11% | 192.7 -15% | 189 -13% | ||
| Load Maximum * (Watt) | 286 | 246.6 14% | 241 16% | 255 11% | 244 15% | 269 6% | 210 ? 27% | 263 ? 8% |
| Load Average * (Watt) | 102.6 | 123 | 103.7 | 118 | 190 | 92.9 ? | 111 ? |
* ... smaller is better
Power consumption Witcher 3 / stress test
Power consumption with an external monitor
Battery life
As standard, Schenker has installed an 80 Wh battery. However, for an additional surcharge of around $70, the device can be configured with a larger 99.8 Wh battery which is the one found in our review model.
The Core 15 keeps going for around 7 hours either in the Wi-Fi or video test at 150 Nits reduced brightness. If you set the brightness to maximum, the lights go out after less than 5 hours in the Wi-Fi test. Overall, we are dealing with very good battery life here, even though the Legion appears to be able to deliver similar performance with an 80 Wh battery.
| SCHENKER XMG Core 15 (M24) R7 8845HS, NVIDIA GeForce RTX 4060 Laptop GPU, 99.8 Wh | Lenovo Legion 5 16IRX G9 i7-14650HX, NVIDIA GeForce RTX 4060 Laptop GPU, 80 Wh | HP Victus 16 (2024) i7-14700HX, NVIDIA GeForce RTX 4060 Laptop GPU, 83 Wh | Dell G16, i7-13650HX, RTX 4060 i7-13650HX, NVIDIA GeForce RTX 4060 Laptop GPU, 86 Wh | SCHENKER XMG Fusion 15 (Early 24) i9-14900HX, NVIDIA GeForce RTX 4070 Laptop GPU, 99.8 Wh | SCHENKER XMG Pro 15 (E23) i9-13900HX, NVIDIA GeForce RTX 4060 Laptop GPU, 80 Wh | Average of class Gaming | |
|---|---|---|---|---|---|---|---|
| Battery runtime | -41% | -43% | -47% | -13% | -43% | -40% | |
| H.264 (h) | 10.1 | 9.6 -5% | 6.4 -37% | 10 -1% | 7.85 ? -22% | ||
| WiFi v1.3 (h) | 14.8 | 7.4 -50% | 8.5 -43% | 6.3 -57% | 8 -46% | 5.7 -61% | 6.65 ? -55% |
| Load (h) | 2.5 | 0.8 -68% | 1.3 -48% | 2.7 8% | 1.9 -24% | 1.432 ? -43% | |
| Reader / Idle (h) | 15.2 | 9.9 ? |
Pros
Cons
Verdict - Good and affordable with potentially improved cooling

The Core 15 costs at least 200 dollars less than the Fusion 15. This comes at the cost of having to do without Thunderbolt and a more powerful CPU. The latter results in a noticeable CPU performance difference of almost 20 percent. However, this is not something you will really notice in most 3D games. The Fusion might be 20 percent faster in this area but that is due to its RTX 4070. The RTX 4060 variant ought to be just as fast.
We liked the Core's craftsmanship with its metal case as well as good expandability options in terms of RAM and SSDs. The keyboard and 3D performance are also decent and the battery life is extraordinary.
The "only" criticism is the large amount of heat produced on the base's metal surface under heavy load. This is an area in which the manufacturer should make future improvements and maybe optimize the cooling system.
The XMG Core 15 is a potent 3D gamer with good build quality which includes a metal case that gets slightly too hot under load.
An alternative worth taking a look at is last year's XMG Pro 15. The previous year's HX CPU is still faster than the AMD processor found here and, on top of that, the Pro also has Thunderbolt 4. The Legion 5i is also a possible alternative, especially in its cheaper Campuspoint variant.
Price and availability
In the Schenker shop in Germany, prices for the Core 15 start at around $1,500 (current conversion rate). Due to its bigger battery, Wi-Fi 6E, more RAM and Samsung 990 Pro SSD, our review model costs around $1,700. By contrast, prices for the Fusion 15 start at around $1,600.
Note: We have recently updated our rating system and the results of version 8 are not comparable with the results of version 7. More information is available here .
SCHENKER XMG Core 15 (M24)
- 09/22/2025 v8
Christian Hintze
 Total Sustainability Score:
 More articles related to this device
SCHENKER XMG Core 15 (M24) (XMG Core 15 Series)Related Articles


Transparency
The selection of devices to be reviewed is made by our editorial team. The test sample was provided to the author as a loan by the manufacturer or retailer for the purpose of this review. The lender had no influence on this review, nor did the manufacturer receive a copy of this review before publication. There was no obligation to publish this review. As an independent media company, Notebookcheck is not subjected to the authority of manufacturers, retailers or publishers.
This is how Notebookcheck is testing
Every year, Notebookcheck independently reviews hundreds of laptops and smartphones using standardized procedures to ensure that all results are comparable. We have continuously developed our test methods for around 20 years and set industry standards in the process. In our test labs, high-quality measuring equipment is utilized by experienced technicians and editors. These tests involve a multi-stage validation process. Our complex rating system is based on hundreds of well-founded measurements and benchmarks, which maintains objectivity. Further information on our test methods can be found here.
Price comparison

