Notebookcheck Logo

AMD Ryzen AI 9 HX 370 vs AMD Ryzen 9 7945HX vs AMD Ryzen 9 7940HX

AMD Ryzen AI 9 HX 370

► remove from comparison AMD Ryzen AI 9 HX 370

The AMD Ryzen AI 9 HX 370 is a powerful Strix Point family processor that debuted in June 2024. The APU comes with 12 CPU cores running at 2.0 GHz to 5.1 GHz, the 16 CU RDNA 3+ Radeon 890M graphics adapter and the 50 TOPS XDNA 2 neural engine. Other noteworthy features include PCIe 4, USB 4 and LPDDR5x-7500 RAM support.

Of the 12 CPU cores, 4 are full Zen 5 cores and 8 are smaller Zen 5c cores. The latter probably run at somewhat lower clock speeds than the former.

Architecture and Features

Strix Point family APUs are powered by Zen 5 and Zen 5c microarchitecture cores, the latter being a slightly slower, smaller and more energy-efficient version of the former. One of the differences between Zen 5 and Zen 5c is cache size; Zen 5 cores have larger caches to work with. According to AMD, Zen 5 delivers a 16% IPC improvement over Zen 4 thanks to branch prediction improvements and other refinements.

Elsewhere, the HX 370 supports LPDDR5x-7500 and DDR5-5600 RAM, and is natively compatible with USB 4 (and therefore Thunderbolt). It has PCIe 4.0 support for a throughput of 1.9 GB/s per lane, just like its 8000 series predecessors did. The integrated XDNA 2 NPU delivers up to 50 INT8 TOPS for accelerating various AI workloads.

Performance

Given the IPC improvement, we expect 4 Zen 5 cores combined with 8 Zen 5c cores to perform about as well as 16 Zen 4 cores meaning there is a real chance of the HX 370 dethroning the Ryzen 9 7945HX3D. We'll make sure to update this section once we get our hands on a laptop powered by the HX 370.

Graphics

The Radeon 890M is the most powerful iGPU that AMD has on offer right now. It features 16 RDNA 3+ architecture CUs (1024 unified shaders) running at up to 2,900 MHz. We expect the graphics adapter to deliver gaming performance good enough for playing 2023 and 2024 games in 1080p (Low detail settings).

Naturally, the 890M is capable of driving four SUHD 4320p60 monitors. It can also efficiently encode and decode the most popular video codecs including AVC, HEVC, VP9 and AV1. The latest addition to that list, the VVC codec, is not supported unlike it is with Intel Lunar Lake chips.

Power consumption

The HX 370 is supposed to have a base TDP of 28 W, with laptop makers free to crank it up to up to 54 W. Which they will most likely do to maximize performance.

The 4 nm TSMC process that the CPU cores are built with make for decent, as of mid 2024, energy efficiency.

AMD Ryzen 9 7945HX

► remove from comparison AMD R9 7945HX

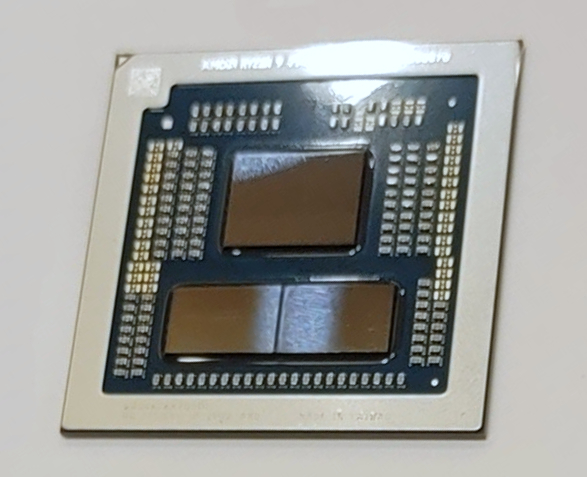
The AMD Ryzen 9 7945HX is a fast high-end laptop processor of the Dragon Range series. It offers 16 cores based on the Zen 4 architecture that supports hyperthreading (32 threads). The cores clock from 2.5 (base) up to 5.4 GHz (single core boost). The 7945HX is the fastest mobile Ryzen CPU at launch and derived from the desktop Ryzen 9 7950X.

The Dragon Range series still uses a chiplet design with two CCD-clusters (each with 8 possible cores) in 5nm and an IO-die (including the memory controller and the Radeon 610M iGPU) in 6nm. The chip integrates 4x USB 3.2 Gen2 (10 Gbps) ports (no USB4), 28 PCIe 5.0 lanes (for GPU and SSDs) and a dual-channel DDR5-5200 memory controller.

Performance

The Ryzen 9 7945HX is among the fastest processors in our database, as of August 2023. It is in the same league as the Ryzen 9 7945HX3D and noticeably ahead of the Core i9-13980HX, as far as multi-thread benchmark scores are concerned. It is outrageously, unbelievably fast, and those fortunate enough to purchase a laptop built around this CPU will have no performance issues for at least three years.

Thanks to its powerful cooling solution and a long-term CPU power limit of 128 W, the ROG Strix Scar 17 G733PY-XS96 is one of the fastest laptops built around the 7945HX that we know of.

The R9 7945HX is rated at a TDP of 55 Watt and can be configured up to 75 Watt (cTDP).

AMD Ryzen 9 7940HX

► remove from comparison AMD R9 7945HX

The AMD Ryzen 9 7940HX is a high-end notebook processor from the Dragon Range series with 16 cores and hyperthreading (SMT), which means it can process up to 32 threads simultaneously. The CPU uses the current Zen 4 architecture for the 16 cores and clocks these from 2.4 GHz (base clock) up to 5.2 GHz (single-core boost). The CPU offers 16 MB L2 cache and 64 MB L3 cache (i.e. a total of 80 MB cache). The 7940HX consists of three chiplets, two CCD clusters with 8 CPU cores each in 5nm (71mm²) and one IO die in 6nm (122mm²) which are all manufactured at TSMC.

The performance of the Ryzen 9 should be comparable to a Core i9-13900HX (24 hybrid cores, max 5.4 GHz) in the top range of mobile processors from 2024. AMD itself advertises a clear lead over the old Ryzen 9 6900HX (8 Zen 3 cores, 4.9 GHz), which can be explained by the additional cores, improved architecture and higher frequencies. Compared to the top model, the Ryzen 9 7945HX, the 7940HX is slightly lower clocked.

The chip also integrates 4x USB 3.2 Gen2 (10 Gbps) ports (no USB 4), 28 PCIe 5.0 lanes (for GPUs and SSDs), a dual-channel DDR5-5200 memory controller and a small AMD Radeon 610M graphics card (2CUs, 400 - 2200 MHz).

The R9 7940HX is specified with 55 watts TDP and can be configured up to 75 watts (cTDP).

ModelAMD Ryzen AI 9 HX 370AMD Ryzen 9 7945HXAMD Ryzen 9 7940HX
SeriesAMD Strix Point (Zen 5/5c, Ryzen AI 3/5/7/9)AMD Dragon Range (Zen 4, Ryzen 7045)AMD Dragon Range (Zen 4, Ryzen 7045)
CodenameStrix Point-HX (Zen 5)Dragon Range-HX (Zen 4)Dragon Range-HX (Zen 4)
Clock2000 - 5100 MHz2500 - 5400 MHz2400 - 5200 MHz
L3 Cache36 MB64 MB64 MB
Cores / Threads12 / 24
4 x 5.1 GHz AMD Zen 5
8 x AMD Zen 5c
16 / 32
16 x 5.4 GHz AMD Zen 4
16 / 32
16 x 5.2 GHz AMD Zen 4
TDP54 Watt55 Watt55 Watt
Technology4 nmCCD = 5 nm, I/O = 6 nm5 nm
max. Temp.100 °C100 °C100 °C
SocketFP8FL1FL1
FeaturesDDR5-5600/LPDDR5x-7500 RAM, PCIe 4, USB 4, XDNA 2 NPU (50 TOPS), SMT, AES, AVX, AVX2, AVX512, FMA3, MMX (+), SHA, SSE, SSE2, SSE3, SSSE3, SSE4.1, SSE4.2, SSE4ADDR5-5200 RAM, PCIe 5, MMX, SSE, SSE2, SSE3, SSSE3, SSE4A, SSE4.1, SSE4.2, AVX, AVX2, AVX-512, BMI2, ABM, FMA, ADX, SMEP, SMAP, SMT, CPB, AES-NI, RDRAND, RDSEED, SHA, SMEDDR5-5200 RAM, PCIe 5, MMX, SSE, SSE2, SSE3, SSSE3, SSE4A, SSE4.1, SSE4.2, AVX, AVX2, AVX-512, BMI2, ABM, FMA, ADX, SMEP, SMAP, SMT, CPB, AES-NI, RDRAND, RDSEED, SHA, SME
iGPUAMD Radeon 890M ( - 2900 MHz)AMD Radeon 610M (400 - 2200 MHz)AMD Radeon 610M (400 - 2200 MHz)
Architecturex86x86x86
Announced
Manufacturerwww.amd.comwww.amd.comwww.amd.com
Series: Dragon Range (Zen 4, Ryzen 7045) Dragon Range-HX (Zen 4)
AMD Ryzen 9 7945HX3D2.3 - 5.4 GHz16 / 32 cores128 MB L3
AMD Ryzen 9 7945HX « 2.5 - 5.4 GHz16 / 32 cores64 MB L3
AMD Ryzen 9 7940HX2.4 - 5.2 GHz16 / 32 cores64 MB L3
AMD Ryzen 9 7845HX3 - 5.2 GHz12 / 24 cores64 MB L3
AMD Ryzen 9 7840HX2.9 - 5.1 GHz12 / 24 cores64 MB L3
AMD Ryzen 9 7945HX3D2.3 - 5.4 GHz16 / 32 cores128 MB L3
AMD Ryzen 9 7945HX2.5 - 5.4 GHz16 / 32 cores64 MB L3
AMD Ryzen 9 7940HX « 2.4 - 5.2 GHz16 / 32 cores64 MB L3
AMD Ryzen 9 7845HX3 - 5.2 GHz12 / 24 cores64 MB L3
AMD Ryzen 9 7840HX2.9 - 5.1 GHz12 / 24 cores64 MB L3
L1 Cache1 MB1 MB
L2 Cache16 MB16 MB
Transistors9900 Million9900 Million

Benchmarks

Performance Rating - CB R15 + R20 + 7-Zip + X265 + Blender + 3DM11 CPU - R9 7945HX
56.7 pt (79%)
Cinebench 2024 - Cinebench 2024 CPU Single Core
114 Points (79%)
Cinebench 2024 - Cinebench 2024 CPU Multi Core
1695 Points (32%)
Cinebench R23 - Cinebench R23 Multi Core
min: 30799     avg: 33434     median: 34144.5 (32%)     max: 34613 Points
Cinebench R23 - Cinebench R23 Single Core
min: 1863     avg: 1920     median: 1938 (82%)     max: 1957 Points
Cinebench R20 - Cinebench R20 CPU (Single Core)
min: 712     avg: 740     median: 750 (83%)     max: 756 Points
Cinebench R20 - Cinebench R20 CPU (Multi Core)
min: 10025     avg: 12663     median: 13258 (32%)     max: 13769 Points
Cinebench R15 - Cinebench R15 CPU Multi 64 Bit
min: 4998     avg: 5414     median: 5531 (35%)     max: 5663 Points
Cinebench R15 - Cinebench R15 CPU Single 64 Bit
min: 294     avg: 304.7     median: 307.5 (93%)     max: 309 Points
Cinebench R11.5 - Cinebench R11.5 CPU Multi 64 Bit
min: 59.93     avg: 62.1     median: 62.1 (81%)     max: 64.29 Points
Cinebench R11.5 - Cinebench R11.5 CPU Single 64 Bit
3.7 Points (91%)
Cinebench R10 - Cinebench R10 Rend. Single (32bit)
min: 8355     avg: 8418     median: 8418 (51%)     max: 8481 Points
Cinebench R10 - Cinebench R10 Rend. Multi (32bit)
min: 71582     avg: 71597     median: 71596.5 (52%)     max: 71611 Points
Cinebench R10 - Cinebench R10 Rend. Multi (64bit)
127197 Points (88%)
Cinebench R10 - Cinebench R10 Rend. Single (64bit)
15601 Points (19%)
wPrime 2.10 - wPrime 2.0 1024m *
min: 36.44     avg: 97.6     median: 97.6 (1%)     max: 158.7 s
wPrime 2.10 - wPrime 2.0 32m *
min: 1.986     avg: 3.4     median: 3.4 (1%)     max: 4.9 s
WinRAR - WinRAR 4.0
13822 Points (22%)
7-Zip 18.03 - 7-Zip 18.03 Multli Thread 4 runs
min: 123364     avg: 135428     median: 138199 (79%)     max: 140932 MIPS
7-Zip 18.03 - 7-Zip 18.03 Single Thread 4 runs
min: 7319     avg: 7434     median: 7380 (88%)     max: 7609 MIPS
X264 HD Benchmark 4.0 - x264 Pass 2
228 fps (80%)
X264 HD Benchmark 4.0 - x264 Pass 1
360.5 fps (83%)
HWBOT x265 Benchmark v2.2 - HWBOT x265 4k Preset
min: 33.8     avg: 35.7     median: 34.8 (61%)     max: 37.6 fps
TrueCrypt - TrueCrypt Serpent
2.7 GB/s (0%)
TrueCrypt - TrueCrypt Twofish
min: 4     avg: 4.1     median: 4.1 (71%)     max: 4.2 GB/s
TrueCrypt - TrueCrypt AES
min: 25.3     avg: 27.6     median: 27.6 (72%)     max: 29.9 GB/s
Blender - Blender 3.3 Classroom CPU *
min: 138     avg: 149.4     median: 147 (2%)     max: 160 Seconds
Blender - Blender 2.79 BMW27 CPU *
min: 87     avg: 94.2     median: 94 (1%)     max: 100 Seconds
R Benchmark 2.5 - R Benchmark 2.5 *
min: 0.3982     avg: 0.4     median: 0.4 (9%)     max: 0.4159 sec
3DMark 06 - CPU - 3DMark 06 - CPU
20110 Points (43%)
Super Pi mod 1.5 XS 1M - Super Pi mod 1.5 XS 1M *
min: 6.4     avg: 6.5     median: 6.5 (1%)     max: 6.58 s
Super Pi mod 1.5 XS 2M - Super Pi mod 1.5 XS 2M *
min: 13.9     avg: 14     median: 14 (1%)     max: 14.15 s
Super Pi Mod 1.5 XS 32M - Super Pi mod 1.5 XS 32M *
min: 336.106     avg: 336.6     median: 336.6 (1%)     max: 337 s
3DMark Vantage - 3DM Vant. Perf. CPU no Physx
min: 97328     avg: 99241     median: 99240.5 (87%)     max: 101153 Points
3DMark 11 - 3DM11 Performance Physics
min: 24017     avg: 26069     median: 26183 (71%)     max: 27859 Points
3DMark - 3DMark Ice Storm Physics
min: 84416     avg: 85396     median: 85395.5 (69%)     max: 86375 Points
3DMark - 3DMark Ice Storm Extreme Physics
86844 Points (70%)
3DMark - 3DMark Ice Storm Unlimited Physics
89010 Points (75%)
3DMark - 3DMark Cloud Gate Physics
min: 22457     avg: 23042     median: 22788 (58%)     max: 23882 Points
3DMark - 3DMark Fire Strike Standard Physics
min: 35353     avg: 38985     median: 39681 (71%)     max: 42342 Points
3DMark - 3DMark Time Spy CPU
min: 6283     avg: 11896     median: 12954.5 (55%)     max: 13244 Points
Geekbench 6.2 - Geekbench 6.2 Single-Core
min: 2876     avg: 2878     median: 2878 (77%)     max: 2880 Points
2751 Points (74%)
Geekbench 6.2 - Geekbench 6.2 Multi-Core
min: 16316     avg: 16541     median: 16540.5 (65%)     max: 16765 Points
16094 Points (63%)
Geekbench 5.5 - Geekbench 5.1 - 5.4 64 Bit Single-Core
min: 2047     avg: 2101     median: 2113.5 (89%)     max: 2147 Points
Geekbench 5.5 - Geekbench 5.1 - 5.4 64 Bit Multi-Core
min: 18372     avg: 19479     median: 19692.5 (35%)     max: 19954 Points
Geekbench 5.0 - Geekbench 5.0 64 Bit Single-Core
min: 1984     avg: 2015     median: 2014.5 (9%)     max: 2045 Points
Geekbench 5.0 - Geekbench 5.0 64 Bit Multi-Core
min: 19315     avg: 19415     median: 19415 (61%)     max: 19515 Points
Geekbench 4.4 - Geekbench 4.1 - 4.4 64 Bit Single-Core
8534 Points (85%)
Geekbench 4.4 - Geekbench 4.1 - 4.4 64 Bit Multi-Core
75652 Points (83%)
Mozilla Kraken 1.1 - Kraken 1.1 Total Score *
min: 449     avg: 459.6     median: 456 (1%)     max: 479 ms
Octane V2 - Octane V2 Total Score
min: 92275     avg: 95873     median: 95872.5 (84%)     max: 99470 Points
WebXPRT 4 - WebXPRT 4 Score
min: 283     avg: 289.8     median: 290 (83%)     max: 295 Points
WebXPRT 3 - WebXPRT 3 Score
min: 314     avg: 349.6     median: 349 (73%)     max: 387 Points
CrossMark - CrossMark Overall
min: 1929     avg: 2028     median: 2037 (78%)     max: 2102 Points
Power Consumption - Prime95 Power Consumption - external Monitor *
min: 136.4     avg: 184.3     median: 187.9 (32%)     max: 225 Watt
Power Consumption - Cinebench R15 Multi Power Consumption - external Monitor *
min: 164.4     avg: 193.4     median: 194.2 (35%)     max: 221 Watt
Power Consumption - Idle Power Consumption - external Monitor *
min: 13.9     avg: 30     median: 27.7 (18%)     max: 50.5 Watt
Power Consumption - Idle Power Consumption 150cd 1min *
min: 17.1     avg: 24.5     median: 23.8 (26%)     max: 33.2 Watt
Power Consumption - Cinebench R15 Multi Power Efficiency - external Monitor
min: 25.1     avg: 27.4     median: 27.3 (20%)     max: 29.8 Points per Watt

Average Benchmarks AMD Ryzen 9 7945HX → 0% n=

Average Benchmarks AMD Ryzen 9 7940HX → 0% n=

- Range of benchmark values for this graphics card
- Average benchmark values for this graphics card
* Smaller numbers mean a higher performance
1 This benchmark is not used for the average calculation

v1.28
log 04. 10:53:54

#0 checking url part for id 17543 +0s ... 0s

#1 checking url part for id 14936 +0s ... 0s

#2 checking url part for id 17464 +0s ... 0s

#3 redirected to Ajax server, took 1720083234 +0s ... 0s

#4 did not recreate cache, as it is less than 5 days old! Created at Thu, 04 Jul 2024 05:15:21 +0200 +0s ... 0s

#5 composed specs +0.008s ... 0.008s

#6 did output specs +0s ... 0.008s

#7 getting avg benchmarks for device 17543 +0.001s ... 0.009s

#8 got single benchmarks 17543 +0s ... 0.009s

#9 getting avg benchmarks for device 14936 +0.004s ... 0.013s

#10 got single benchmarks 14936 +0.011s ... 0.024s

#11 getting avg benchmarks for device 17464 +0.001s ... 0.024s

#12 got single benchmarks 17464 +0.003s ... 0.027s

#13 got avg benchmarks for devices +0s ... 0.027s

#14 min, max, avg, median took s +0.034s ... 0.061s

#15 return log +0s ... 0.062s

Please share our article, every link counts!
> Expert Reviews and News on Laptops, Smartphones and Tech Innovations > Benchmarks / Tech > Processor Comparison - Head 2 Head
Redaktion, 2017-09- 8 (Update: 2023-07- 1)