AMD Radeon RX 7900M vs Apple M2 Pro 16-Core GPU vs Apple M2 10-Core GPU
AMD Radeon RX 7900M ► remove from comparison
The AMD Radeon RX 7900M is a mobile upper high-end graphics card based on the Navi 31 chip (RDNA 3 architecture) manufactured in 5nm. It features 4,608 cores (72 CUs - compute units) and 16 GB of fast GDDR6 graphics memory connected with a 256 Bit memory bus. The chip also includes 64 MB Infinity Cache. The clock speed of the cores will depend on the laptop according to AMD. The specified game clock speed is 1825 MHz (most likely at 180 W TGP).
AMD compares the performance to the mobile RTX 4080 and shows a number of games where the 7900M is on average 7% faster. Raytracing is supported in hardware, but usually slower than the Nvidia counterpart. Nvidia also has the advantage of DLSS support in selected games.
The Navi 31 chip is manufactured at TSMC in the current 5nm process. The power consumption (TGP) is specified at 160 to 180 Watt (200 Watt including SmartShift from the CPU).
Apple M2 Pro 16-Core GPU ► remove from comparison
The Apple M2 Pro 16-Core-GPU is an integrated graphics card by Apple offering all 16 of the 19 cores in the M2 Pro 10-Core Chip .
The graphics card has no dedicated graphics memory but can use the fast LPDDR5-6400 unified memory with a 256 bit bus (up to 200 GBit/s).
According to Apple, the performance of the 19-core-GPU should be 30% higher than the old 16-core-GPU in the M1 Pro . Therefore, the cut down 16-core version should still beat the old full-featured 16-core M1 Pro slightly and the old 14-core more clearly.
The GPU is intended to use Apple Metal 2 API and could still be based on the older PowerVR architectures (last used in the Apple A10). A new feature in the MacBook Pro 14 of 2023 is the support for HDMI 2.1 and 8k output.
The Apple M2 Pro is manufactured in the second generation 5nm process at TSMC.
Apple M2 10-Core GPU ► remove from comparison
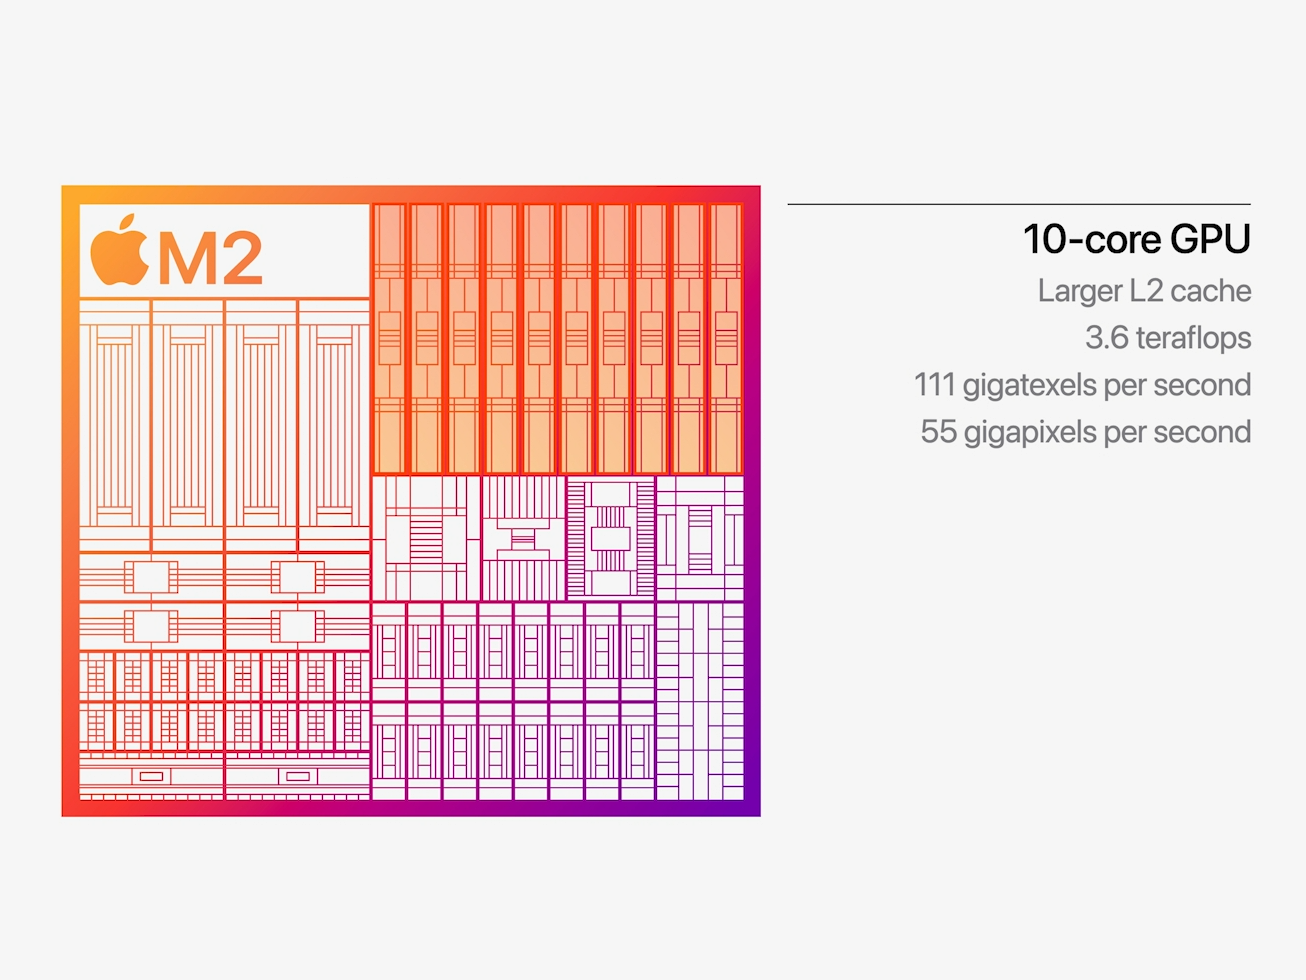
The Apple M2 GPU is an integrated graphics card offering 10 cores designed by Apple and integrated in the Apple M2 SoC . It uses the unified memory architecture of the M2 SoC (up to 24 GB LPDDR5-6400 with 100 GB/s bandwidth) and should offer 160 execution units.
According to Apple it offers a 25% higher performance at slightly higher power consumption. The theoretical performance is rated at 3.6 Teraflops and therefore 1 TFLOP higher than the M1 8-core GPU . In our benchmarks, the GPU was able to top the M1 with up to 40%, but still stays behind the 14-core GPU in the M1 Pro. Compared to other iGPUs from AMD and Intel, the M2 benefits greatly from the unified memory architecture and the high bandwidth.
The M2 chip is manufactured in the second generation 5nm process at TSMC (most likely N5P). The power consumption is around 13.5 Watt (in our tests under load of the MBP13) and up to 15W according to Apple.
AMD Radeon RX 7900M Apple M2 Pro 16-Core GPU Apple M2 10-Core GPU Apple M2 Series Codename Navi 31 Architecture RDNA 3 Pipelines 4608 - unified 16 - unified 10 - unified ROPs 192 Core Speed 1825 - 2090 (Boost) MHz 1398 (Boost) MHz Theoretical Performance 77.05 TFLOPS FP16, 38.52 TFLOPS FP32 Cache L3: 64 MB Memory Speed 18000 MHz Memory Bus Width 256 Bit Memory Type GDDR6 LPDDR5-6400 LPDDR5-6400 Max. Amount of Memory 16 GB Shared Memory no no no Memory Bandwidth 576 GB/s API DirectX 12_2, Shader 6.7, OpenGL 4.6, OpenCL 2.2, Vulkan 1.3 Power Consumption 180 Watt (160 - 200 Watt TGP) 15 Watt Transistors 53.9 Billion technology 5 nm 5 nm 5 nm Notebook Size large medium sized Date of Announcement 19.10.2023 17.01.2023 06.06.2022 Link to Manufacturer Page www.amd.com Predecessor M1 8-Core GPU
CPU in M2 Pro 16-Core GPU GPU Base Speed GPU Boost / Turbo Apple M2 Pro 10-Core 10 x 2424 MHz ? MHz ? MHz
CPU in M2 10-Core GPU GPU Base Speed GPU Boost / Turbo Apple M2 8 x 2424 MHz, 20 W ? MHz 1398 MHz
Benchmarks 3DMark - 3DMark Time Spy Score
18114 Points (52%)
3DMark - 3DMark Time Spy Graphics
19434 Points (51%)
3DMark - 3DMark Fire Strike Standard Score
40123 Points (71%)
3DMark - 3DMark Fire Strike Standard Graphics
50241 Points (57%)
3DMark - 3DMark Wild Life Unlimited
min: 21302 avg: 23924 median: 24236 (12%) max: 25317 Points
GPU TDP ? TDP 13 W 94% 100%
3DMark - 3DMark Wild Life Extreme Unlimited
11224 Points (13%)
min: 5328 avg: 6533 median: 6823.5 (8%) max: 6987 Points
GPU TDP ? TDP 12 W TDP 13 W TDP 25 W 55% 62% 61% 100%
3DMark 11 - 3DM11 Performance Score
41670 Points (58%)
3DMark 11 - 3DM11 Performance GPU
59943 Points (52%)
Blender - Blender 3.3 Classroom METAL *
132 Seconds (14%)
min: 205 avg: 221 median: 221 (23%) max: 237 Seconds
GPU TDP 12 W TDP 13 W TDP 25 W 104% 100% 115%
Cinebench R15 + AMD Radeon RX 7900M Cinebench R15 - Cinebench R15 OpenGL 64 Bit
369 fps (22%)
Cinebench R15 OpenGL 64 Bit + Apple M2 Pro 16-Core GPU
141.9 fps (8%)
GPU TDP 25 W TDP 180 W 38% 100%
Cinebench R15 OpenGL 64 Bit + Apple M2 10-Core GPU
min: 128.65 avg: 132.8 median: 131 (8%) max: 140.5 fps
GPU TDP 12 W TDP 13 W TDP 25 W TDP 180 W 38% 35% 38% 100%
Cinebench R15 OpenGL Ref. Match 64 Bit + AMD Radeon RX 7900M Cinebench R15 - Cinebench R15 OpenGL Ref. Match 64 Bit
97.9 % (98%)
Cinebench R15 OpenGL Ref. Match 64 Bit + Apple M2 Pro 16-Core GPU
99.5 % (100%)
GPU TDP 25 W TDP 180 W 100% 98%
Cinebench R15 OpenGL Ref. Match 64 Bit + Apple M2 10-Core GPU
99.5 % (100%)
GPU TDP 12 W TDP 13 W TDP 25 W TDP 180 W 100% 100% 100% 98%
GFXBench - GFXBench 5.0 4K Aztec Ruins High Tier Offscreen
78.7 fps (32%)
min: 35.6 avg: 43.9 median: 47.9 (19%) max: 48.6 fps
GPU TDP ? TDP 12 W TDP 13 W TDP 25 W 52% 61% 61% 100%
GFXBench - GFXBench 5.0 Aztec Ruins High Tier Offscreen
181.1 fps (33%)
min: 68 avg: 96 median: 102.6 (19%) max: 110 fps
GPU TDP ? TDP 12 W TDP 13 W TDP 25 W 46% 60% 60% 100%
GFXBench - GFXBench 5.0 Aztec Ruins Normal Tier Offscreen
493 fps (37%)
min: 208 avg: 267.5 median: 283.8 (21%) max: 296 fps
GPU TDP ? TDP 12 W TDP 13 W TDP 25 W 49% 59% 59% 100%
GFXBench - GFXBench Car Chase Offscreen
389 fps (44%)
min: 136 avg: 197.6 median: 206.1 (23%) max: 232 fps
GPU TDP ? TDP 12 W TDP 13 W TDP 25 W 49% 60% 51% 100%
GFXBench 3.1 - GFXBench Manhattan ES 3.1 Offscreen
659 fps (14%)
min: 247 avg: 318.6 median: 331.5 (7%) max: 374.6 fps
GPU TDP ? TDP 12 W TDP 13 W TDP 25 W 46% 57% 48% 100%
GFXBench 3.0 - GFXBench 3.0 Manhattan Offscreen
1011 fps (59%)
min: 411 avg: 503 median: 509.5 (30%) max: 557.2 fps
GPU TDP ? TDP 12 W TDP 13 W TDP 25 W 46% 55% 53% 100%
GFXBench (DX / GLBenchmark) 2.7 + Apple M2 Pro 16-Core GPU GFXBench (DX / GLBenchmark) 2.7 - GFXBench T-Rex HD Offscreen C24Z16
1815 fps (14%)
GFXBench T-Rex HD Offscreen C24Z16 + Apple M2 10-Core GPU
min: 628 avg: 824 median: 891.5 (7%) max: 931.9 fps
GPU TDP ? TDP 12 W TDP 13 W TDP 25 W 40% 51% 51% 100%
Antutu v9 - AnTuTu v9 GPU
min: 654168 avg: 728087 median: 728086 (91%) max: 802005 Points
Basemark GPU 1.2 - Basemark GPU 1.2 Vulkan Official Medium Offscreen 1080
104.6 fps (1%)
Basemark GPU 1.2 - Basemark GPU 1.2 Vulkan Official High Offscreen 2160
3.6 fps (1%)
Geekbench 6.2 - Geekbench 6.2 GPU OpenCL
140024 Points (41%)
min: 27880 avg: 27900 median: 27900 (8%) max: 27920 Points
GPU TDP 12 W TDP 13 W TDP 180 W 20% 20% 100%
Geekbench 6.2 - Geekbench 6.2 GPU Vulkan
138222 Points (45%)
Geekbench 6.2 - Geekbench 6.2 GPU Metal
min: 42013 avg: 44473 median: 45460 (29%) max: 45946 Points
GPU TDP ? TDP 12 W TDP 13 W 91% 100% 99%
Power Consumption - Furmark Stress Test Power Consumption - external Monitor *
313 Watt (44%)
Power Consumption - The Witcher 3 Power Consumption - external Monitor *
167 Watt (23%)
47.8 Watt (7%)
GPU TDP 25 W TDP 180 W 122% 100%
min: 22.8 avg: 27.8 median: 26.9 (4%) max: 34.4 Watt
GPU TDP 12 W TDP 13 W TDP 25 W TDP 180 W 125% 125% 122% 100%
Power Consumption - Witcher 3 Power Consumption *
216 Watt (47%)
46.6 Watt (10%)
GPU TDP 25 W TDP 180 W 171% 100%
min: 27.8 avg: 32.5 median: 30.8 (7%) max: 38.9 Watt
GPU TDP 13 W TDP 25 W TDP 180 W 177% 171% 100%
Power Consumption - GFXBench Aztec Ruins Normal Tier Offscreen Power Consumption 150cd *
min: 16 avg: 16.5 median: 16.7 (6%) max: 16.7 Watt
Power Consumption - Witcher 3 ultra Power Efficiency
1 fps per Watt (87%)
min: 1.007 avg: 1 median: 1 (91%) max: 1.108 fps per Watt
GPU TDP 13 W TDP 25 W 100% 96%
Power Consumption - Witcher 3 ultra Power Efficiency - external Monitor
0.9 fps per Watt (78%)
min: 1.116 avg: 1.1 median: 1.1 (92%) max: 1.207 fps per Watt
GPU TDP 13 W TDP 25 W 100% 84%
Emissions Witcher 3 Fan Noise + AMD Radeon RX 7900M Emissions - Witcher 3 Fan Noise
53.6 dB(A) (86%)
Witcher 3 Fan Noise + Apple M2 10-Core GPU
34.6 dB(A) (55%)
GPU TDP 13 W TDP 180 W 65% 100%
Average Benchmarks AMD Radeon RX 7900M → 100% n=2 Average Benchmarks Apple M2 Pro 16-Core GPU → 70% n=2 Average Benchmarks Apple M2 10-Core GPU → 69% n=2
- Range of benchmark values for this graphics card
- Average benchmark values for this graphics card
* Smaller numbers mean a higher performance
1 This benchmark is not used for the average calculation
Game Benchmarks The following benchmarks stem from our benchmarks of review laptops. The performance depends on the used graphics memory, clock rate, processor, system settings, drivers, and operating systems. So the results don't have to be representative for all laptops with this GPU. For detailed information on the benchmark results, click on the fps number.
100%
Radeon RX 7900M:
104.8 fps
100%
Radeon RX 7900M:
71.7 fps
100%
Radeon RX 7900M:
37.3 fps
100%
Radeon RX 7900M:
130.7 fps
100%
Radeon RX 7900M:
129.6 fps
100%
Radeon RX 7900M:
85.2 fps
100%
Radeon RX 7900M:
37.7 fps
100%
Radeon RX 7900M:
152.4 fps
100%
Radeon RX 7900M:
152.6 fps
100%
Radeon RX 7900M:
118.5 fps
100%
Radeon RX 7900M:
65.8 fps
100%
Radeon RX 7900M:
86.2 fps
100%
Radeon RX 7900M:
83.6 fps
100%
Radeon RX 7900M:
54.8 fps
100%
Radeon RX 7900M:
296 fps
100%
Radeon RX 7900M:
102.8 fps
100%
Radeon RX 7900M:
69.3 fps
100%
Radeon RX 7900M:
36.1 fps
100%
Radeon RX 7900M:
150.2 fps
100%
Radeon RX 7900M:
106.8 fps
100%
Radeon RX 7900M:
56 fps
100%
Radeon RX 7900M:
135 fps
100%
Radeon RX 7900M:
93.3 fps
100%
Radeon RX 7900M:
44.3 fps
M2 Pro 16-Core GPU:
80.8 fps
M2 Pro 16-Core GPU:
52 fps
M2 Pro 16-Core GPU:
38 fps
M2 Pro 16-Core GPU:
28.9 fps
M2 Pro 16-Core GPU:
258 fps
M2 Pro 16-Core GPU:
75 fps
M2 Pro 16-Core GPU:
48 fps
M2 Pro 16-Core GPU:
36 fps
M2 Pro 16-Core GPU:
22 fps
M2 Pro 16-Core GPU:
159 fps
M2 Pro 16-Core GPU:
72 fps
100%
Radeon RX 7900M:
207 fps
31%
M2 Pro 16-Core GPU:
65 fps
100%
Radeon RX 7900M:
198 fps
29%
M2 Pro 16-Core GPU:
57 fps
100%
Radeon RX 7900M:
139 fps
26%
M2 Pro 16-Core GPU:
36 fps
14%
M2 10-Core GPU:
20 fps
100%
Radeon RX 7900M:
76 fps
100%
Radeon RX 7900M:
344 [X] Alienware m18 R1 AMD 1.47.22.14 D3D12
AMD Ryzen 9 7945HX 2.5GHz
Radeon RX 7900M
min:
145.8 fps, P1:
227 fps, max:
549 fps
fps
100%
Radeon RX 7900M:
249 [X] Alienware m18 R1 AMD 1.47.22.14 D3D12
AMD Ryzen 9 7945HX 2.5GHz
Radeon RX 7900M
min:
137.9 fps, P1:
183.7 fps, max:
466 fps
fps
100%
Radeon RX 7900M:
130.5 [X] Alienware m18 R1 AMD 1.47.22.14 D3D12
AMD Ryzen 9 7945HX 2.5GHz
Radeon RX 7900M
min:
79.1 fps, P1:
110.9 fps, max:
204 fps
fps
100%
Radeon RX 7900M:
128 fps
100%
Radeon RX 7900M:
123 fps
100%
Radeon RX 7900M:
103 fps
100%
Radeon RX 7900M:
83.7 fps
100%
Radeon RX 7900M:
64.3 fps
100%
Radeon RX 7900M:
152.8 fps
100%
Radeon RX 7900M:
114.6 fps
100%
Radeon RX 7900M:
69.3 fps
100%
Radeon RX 7900M:
162.8 fps
100%
Radeon RX 7900M:
146.2 fps
100%
Radeon RX 7900M:
122.5 fps
M2 Pro 16-Core GPU:
51 fps
100%
Radeon RX 7900M:
167.7 fps
27%
M2 Pro 16-Core GPU:
45 fps
17%
M2 10-Core GPU:
28 fps
100%
Radeon RX 7900M:
116 fps
M2 Pro 16-Core GPU:
76 fps
M2 Pro 16-Core GPU:
73 fps
100%
Radeon RX 7900M:
172.9 fps
27%
M2 Pro 16-Core GPU:
46 fps
100%
Radeon RX 7900M:
105 fps
100%
Radeon RX 7900M:
105.6 fps
100%
Radeon RX 7900M:
146 fps
Average Gaming AMD Radeon RX 7900M → 100% Average Gaming 30-70 fps → 100%
Average Gaming Apple M2 Pro 16-Core GPU → 28% Average Gaming 30-70 fps → 28%
Average Gaming Apple M2 10-Core GPU → 15% Average Gaming 30-70 fps → 15%
AMD Radeon RX 7900M low med. high ultra QHD 4K Alan Wake 2 104.8 71.7 37.3 Cyberpunk 2077 2.1 Phantom Liberty 130.7 129.6 85.2 37.7 Baldur's Gate 3 152.4 152.6 118.5 65.8 Ratchet & Clank Rift Apart 86.2 83.6 54.8 F1 22 296 102.8 69.3 36.1 Tiny Tina's Wonderlands 150.2 106.8 56 Cyberpunk 2077 1.6 135 93.3 44.3 Shadow of the Tomb Raider 207 198 139 76 Strange Brigade 344 249 130.5 Far Cry 5 128 123 103 X-Plane 11.11 83.7 64.3 Final Fantasy XV Benchmark 152.8 114.6 69.3 Dota 2 Reborn 162.8 146.2 122.5 The Witcher 3 167.7 116 GTA V 172.9 105 105.6 146 < 30 fps < 60 fps < 120 fps ≥ 120 fps 2 7 3 9 9 3 6 6 3
Apple M2 Pro 16-Core GPU low med. high ultra QHD 4K Borderlands 3 80.8 52 38 28.9 Total War: Three Kingdoms 258 75 48 36 22 Shadow of the Tomb Raider 159 72 65 57 36 The Witcher 3 51 45 GTA V 76 73 46 < 30 fps < 60 fps < 120 fps ≥ 120 fps 2 2 1 3 4 1 1 3 1 1
For more games that might be playable and a list of all games and graphics cards visit our Gaming List
v1.28
log 02. 08:02:07
#0 checking url part for id 11620 +0s ... 0s
#1 checking url part for id 11570 +0s ... 0s
#2 checking url part for id 11368 +0s ... 0s
#3 redirected to Ajax server, took 1719900127 +0s ... 0s
#4 did not recreate cache, as it is less than 5 days old! Created at Mon, 01 Jul 2024 05:16:07 +0200 +0s ... 0s
#5 composed specs +0.092s ... 0.092s
#6 did output specs +0s ... 0.092s
#7 start showIntegratedCPUs +0s ... 0.092s
#8 getting avg benchmarks for device 11620 +0.028s ... 0.12s
#9 got single benchmarks 11620 +0.004s ... 0.124s
#10 getting avg benchmarks for device 11570 +0s ... 0.125s
#11 got single benchmarks 11570 +0.003s ... 0.128s
#12 getting avg benchmarks for device 11368 +0s ... 0.128s
#13 got single benchmarks 11368 +0.007s ... 0.136s
#14 got avg benchmarks for devices +0s ... 0.136s
#15 min, max, avg, median took s +0.022s ... 0.158s
#16 before gaming benchmark output +0s ... 0.158s
#17 Got 121 rows for game benchmarks. +0.01s ... 0.168s
#18 composed SQL query for gamebenchmarks +0s ... 0.168s
#19 got data and put it in $dataArray +0.001s ... 0.169s
#20 benchmarks composed for output. +0.008s ... 0.177s
#21 calculated avg scores. +0s ... 0.177s
#22 return log +0.001s ... 0.177s
Please share our article, every link counts!
Redaktion, 2017-09- 8 (Update: 2023-07- 1)
 Deutsch
 English
 Español
 Français
 Italiano
 Nederlands
 Polski
 Português
 Русский
 Türkçe
 Svenska
 Chinese
 Magyar