Notebookcheck Logo

AMD Radeon PRO W6600M vs Intel Arc 7-Core iGPU

AMD Radeon PRO W6600M

► remove from comparison AMD Radeon PRO W6600M

Die AMD Radeon PRO  W6600M  ist eine professionelle Notebook-GPU der Mittelklasse und basiert auf den Navi 23 mit RDNA 2 Architektur. Sie basiert auf die Radeon RX 6600M und bietet 1.792 Shader (28 CUs), einen 128 Bit Speicherbus für 16 GBit GDDR6 (8 GB) und 32 MB Infinity Cache. Die theoretische Rechenleistung wird von AMD mit 7,8 TFLOPS FP32 angegeben und damit deutlich unter den 10,6 bzw 11,8 der RX 6700M und 6800M. Diese Performance wird bei 100 Watt TDP und 2177 MHz erreicht. Von den Notebookherstellern, kann der TDP aber bis auf 50 Watt abgesenkt werden.

Die Spieleleistung wird von AMD mit einer RTX 3060 für Notebooks verglichen und sollte daher für 1080p Gaming in hohen Details ausreichen. Bei Nutzung von Raytracing-Effekting, verliert die RX 6600M jedoch stärker als die RTX Pendants. 

Der Navi 23 Chip wird bei TSMC in 7nm gefertigt und sollte daher eine gute Energieeffizienz aufweisen (auch gegen die 12nm RTX Chips von Nvidia).

Intel Arc 7-Core iGPU

Intel Arc 7-Core

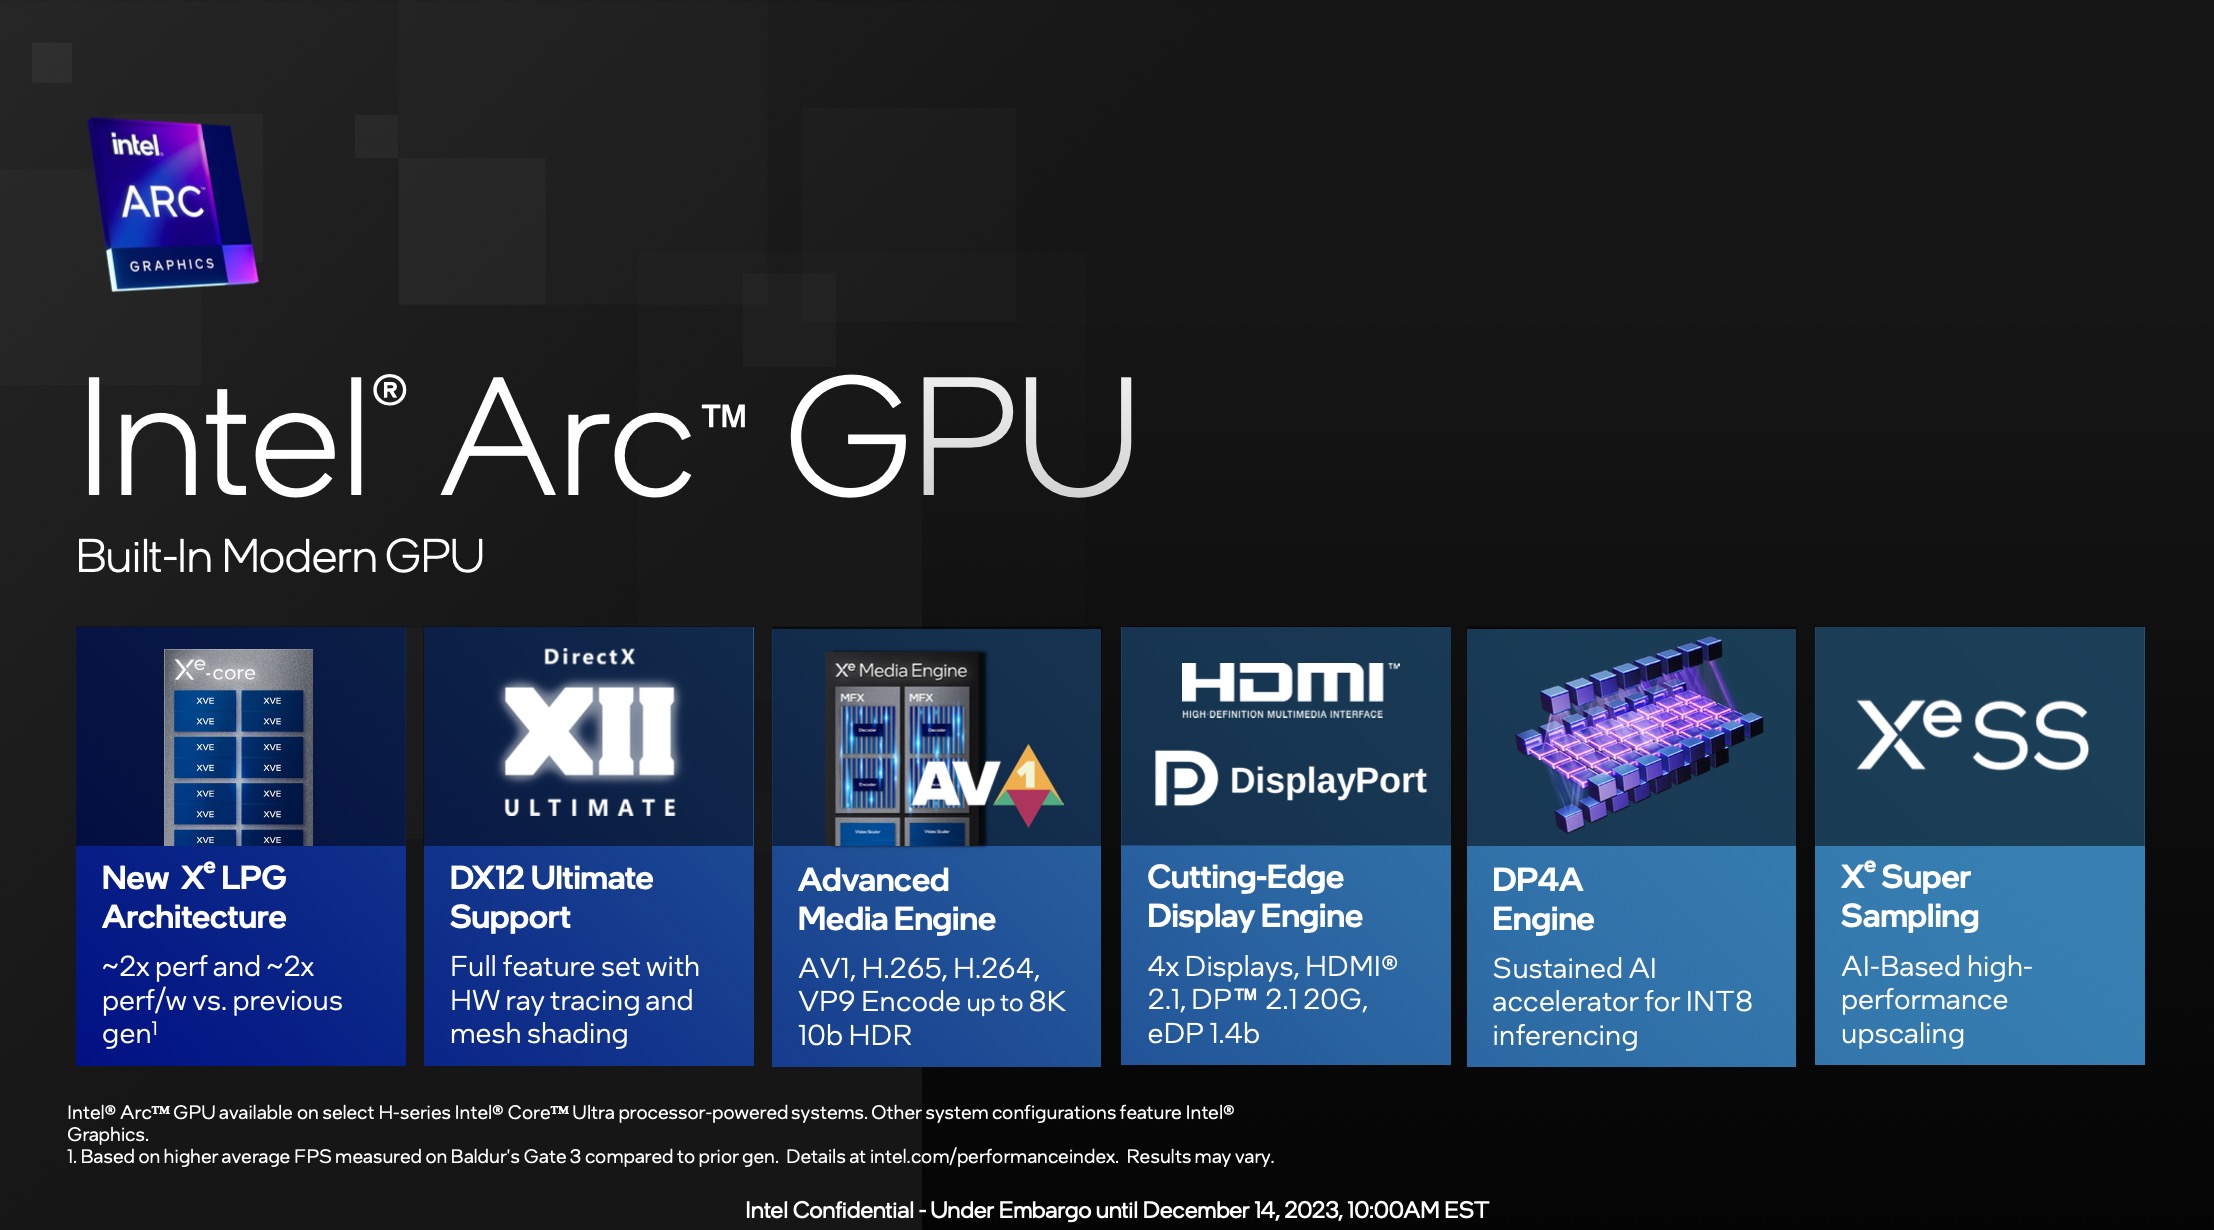
The Intel Arc iGPU with 7 cores is an integrated graphics adapter based on the Xe LPG architecture (similar to the dedicated Arc GPUs, but with a focus on efficiency). It offers 7 of the 8 Xe cores (112 Xe Vector Engines), 7 raytracing units, 7 samplers and probably also 4 pixel backends.

The Arc name may only be used if at least 16 GB RAM is used in dual channel mode. Otherwise, the iGPU is only called "Intel Graphics" and is also significantly slower.

According to Intel, performance has been doubled compared to the previous generation (probably still in Alder Lake).

The iGPU supports DirectX 12 Ultimate (probably DX 12_2 like the desktop Arc GPUs). The graphics unit also supports XeSS AI Super Sampling.

The media engine of Meteor Lake is in the SOC tile and supports up to 8k60 10-bit HDR encode and decode of MPEG2, AVC, VP9, HEVC and AV1. The display engine is also in the SoC tile and supports HDMI 2.1 and DisplayPort 2.1 20G with up to 8K60 HDR.

The GPU Tile of the Meteor Lake chip is manufactured at TSMC on 5nm (5N process).

AMD Radeon PRO W6600MIntel Arc 7-Core iGPU
Arc LPG Series
Radeon RX 6850M XT compare 2560 @ 2.46 GHz192 Bit @ 18000 MHz
Radeon RX 6800M compare 2560 @ 2.12 - 2.3 GHz192 Bit @ 16000 MHz
Radeon RX 6800S compare 2048 @ 1.8 - 1.98 GHz128 Bit @ 16000 MHz
Radeon RX 6700M compare 2304 @ 2.3 GHz160 Bit @ 16000 MHz
Radeon RX 6650M XT compare 2048 @ 2.16 GHz128 Bit @ 18000 MHz
Radeon RX 6650M compare 1792 @ 2.22 GHz128 Bit @ 18000 MHz
Radeon RX 6600M compare 1792 @ 2.07 - 2.18 GHz128 Bit @ 14000 MHz
Radeon RX 6700S compare 1792 @ 1.7 - 1.89 GHz128 Bit @ 14000 MHz
Radeon PRO W6600M 1792 128 Bit @ 14000 MHz
Radeon RX 6600S compare 1792 @ 1.88 GHz128 Bit @ 16000 MHz
Radeon RX 6550M compare 1024 @ 2 - 2.56 GHz64 Bit @ 18000 MHz
Radeon RX 6500M compare 1024 @ 2.19 GHz64 Bit @ 18000 MHz
Radeon RX 6550S compare 1024 @ 2.17 GHz64 Bit @ 16000 MHz
Radeon RX 6450M compare 768 @ 2 - 2.22 GHz64 Bit @ 18000 MHz
Radeon RX 6300M compare 768 @ 1.51 GHz128 Bit @ 18000 MHz
Arc 8-Core compare 8 @ 2.3 GHz
Arc 7-Core 7 @ 2.2 GHz
Graphics 4-Core compare 4 @ 1.95 GHz
ArchitectureRDNA 2Xe LPG
Pipelines1792 - unified7 - unified
Memory Speed14000 MHz
Memory Bus Width128 Bit
Memory TypeGDDR6
Max. Amount of Memory8 GB
Shared Memorynoyes
APIDirectX 12, Shader 6.4, OpenGL 4.6DirectX 12_2, OpenGL 4.6, Vulkan 1.3
Power Consumption100 Watt
Transistors11.1 Billion
technology7 nm5 nm
FeaturesDisplayPort 1.4 w/DFSC, HDMI 2.0b, Radeon Media Engine (H.264 4K150 decode, 4K90 encode / H.265 4K90 decode, 4K60 encode / VP9 4K90 decode)
Notebook Sizemedium sized
Date of Announcement08.06.2021 14.12.2023
CodenameMeteor Lake iGPU
Raytracing Cores7
Core Speed2200 (Boost) MHz
CacheL1: 1.3 MB
DisplaysHDMI 2.1, DisplayPort 2.1 20G
CPU in Arc 7-CoreGPU Base SpeedGPU Boost / Turbo
Intel Core Ultra 5 125H14 x 3600 MHz, 28 W? MHz2200 MHz

Benchmarks

Performance Rating - 3DMark 11 + Fire Strike + Time Spy - Arc 7-Core
3.9 pt (12%)
3DMark - 3DMark Time Spy Score
min: 3259     avg: 3472     median: 3498 (10%)     max: 3658 Points
3DMark - 3DMark Time Spy Graphics
min: 3000     avg: 3189     median: 3248 (9%)     max: 3319 Points
3DMark - 3DMark Cloud Gate Score
30553 Points (33%)
3DMark - 3DMark Cloud Gate Graphics
45644 Points (12%)
3DMark - 3DMark Fire Strike Standard Score
min: 7396     avg: 7608     median: 7500 (13%)     max: 7929 Points
3DMark - 3DMark Fire Strike Standard Graphics
min: 8366     avg: 8467     median: 8503 (10%)     max: 8531 Points
3DMark - 3DMark Ice Storm Graphics
228069 Points (27%)
3DMark - 3DMark Wild Life Extreme Unlimited
min: 5654     avg: 5699     median: 5699 (7%)     max: 5744 Points
3DMark 11 - 3DM11 Performance Score
min: 11161     avg: 11536     median: 11306 (16%)     max: 12140 Points
3DMark 11 - 3DM11 Performance GPU
min: 11467     avg: 11685     median: 11528 (10%)     max: 12061 Points
3DMark Vantage
3DM Vant. Perf. total + Intel Arc 7-Core iGPU
3DMark Vantage - 3DM Vant. Perf. total
min: 35885     avg: 38592     median: 38592 (11%)     max: 41299 Points
3DM Vant. Perf. GPU no PhysX + Intel Arc 7-Core iGPU
3DMark Vantage - 3DM Vant. Perf. GPU no PhysX
min: 33850     avg: 35286     median: 35285.5 (20%)     max: 36721 Points
3DMark 06 3DMark 06 - Standard 1280x1024 + Intel Arc 7-Core iGPU
3DMark 06
min: 38905     avg: 40579     median: 40578.5 (53%)     max: 42252 Points
Unigine Valley 1.0 - Unigine Valley 1.0 DX
20.7 fps (7%)
Cinebench R10 Cinebench R10 Shading (32bit) + Intel Arc 7-Core iGPU
Cinebench R10 - Cinebench R10 Shading (32bit)
min: 15567     avg: 15689     median: 15688.5 (11%)     max: 15810 Points
Cinebench R11.5 Cinebench R11.5 OpenGL 64 Bit + Intel Arc 7-Core iGPU
Cinebench R11.5 - Cinebench R11.5 OpenGL 64 Bit
min: 92.81     avg: 94.3     median: 94.3 (33%)     max: 95.72 fps
Cinebench R15
Cinebench R15 OpenGL 64 Bit + Intel Arc 7-Core iGPU
Cinebench R15 - Cinebench R15 OpenGL 64 Bit
min: 137.6     avg: 138.2     median: 138 (8%)     max: 138.9 fps
Cinebench R15 OpenGL Ref. Match 64 Bit + Intel Arc 7-Core iGPU
Cinebench R15 - Cinebench R15 OpenGL Ref. Match 64 Bit
97.8 % (98%)
GFXBench - GFXBench 5.0 4K Aztec Ruins High Tier Offscreen
min: 25.5     avg: 29.7     median: 29.7 (12%)     max: 33.9 fps
GFXBench - GFXBench 5.0 Aztec Ruins High Tier Offscreen
min: 77.4     avg: 78.8     median: 78.8 (14%)     max: 80.1 fps
GFXBench - GFXBench 5.0 Aztec Ruins Normal Tier Offscreen
193.7 fps (14%)
GFXBench - GFXBench Car Chase Offscreen
155.8 fps (18%)
Basemark GPU 1.2 - Basemark GPU 1.2 Vulkan Official Medium Offscreen 1080
min: 104.6     avg: 236.2     median: 289 (2%)     max: 315 fps
Geekbench 6.2 - Geekbench 6.2 GPU OpenCL
min: 28907     avg: 29924     median: 29619 (9%)     max: 31245 Points
Geekbench 6.2 - Geekbench 6.2 GPU Vulkan
min: 28903     avg: 30881     median: 29615 (10%)     max: 34125 Points
LuxMark v2.0 64Bit - LuxMark v2.0 Room GPU
min: 708     avg: 759     median: 758.5 (3%)     max: 809 Samples/s
LuxMark v2.0 64Bit - LuxMark v2.0 Sala GPU
min: 1926     avg: 2243     median: 2243 (4%)     max: 2560 Samples/s
ComputeMark v2.1 - ComputeMark v2.1 Result
min: 6245     avg: 6572     median: 6572 (7%)     max: 6899 Points
Power Consumption - Furmark Stress Test Power Consumption - external Monitor *
min: 43.1     avg: 48.6     median: 45.2 (6%)     max: 57.4 Watt
Power Consumption - The Witcher 3 Power Consumption - external Monitor *
min: 39.7     avg: 42.6     median: 41.9 (6%)     max: 46.3 Watt
Power Consumption - Witcher 3 Power Consumption *
min: 44.4     avg: 46     median: 45.9 (10%)     max: 47.7 Watt
Power Consumption - Witcher 3 ultra Power Efficiency
min: 0.3987     avg: 0.5     median: 0.5 (48%)     max: 0.545 fps per Watt
Power Consumption - Witcher 3 ultra Power Efficiency - external Monitor
min: 0.4368     avg: 0.5     median: 0.6 (47%)     max: 0.589 fps per Watt
Emissions Witcher 3 Fan Noise + Intel Arc 7-Core iGPU
Emissions - Witcher 3 Fan Noise
min: 36.8     avg: 38.4     median: 38.5 (62%)     max: 40 dB(A)

Average Benchmarks Intel Arc 7-Core iGPU → 0% n=

- Range of benchmark values for this graphics card
- Average benchmark values for this graphics card
* Smaller numbers mean a higher performance
1 This benchmark is not used for the average calculation

Game Benchmarks

The following benchmarks stem from our benchmarks of review laptops. The performance depends on the used graphics memory, clock rate, processor, system settings, drivers, and operating systems. So the results don't have to be representative for all laptops with this GPU. For detailed information on the benchmark results, click on the fps number.

low 1920x1080
Arc 7-Core:
53.8  fps
med. 1920x1080
Arc 7-Core:
38.7  fps
high 1920x1080
Arc 7-Core:
33  fps
ultra 1920x1080
Arc 7-Core:
25.3  fps
low 1920x1080
Arc 7-Core:
33  fps
med. 1920x1080
Arc 7-Core:
31  fps
high 1920x1080
Arc 7-Core:
24  fps
ultra 1920x1080
Arc 7-Core:
18  fps
low 1920x1080
Arc 7-Core:
32.1  fps
med. 1920x1080
Arc 7-Core:
25  fps
high 1920x1080
Arc 7-Core:
22.7  fps
ultra 1920x1080
Arc 7-Core:
21.7  fps
low 1920x1080
Arc 7-Core:
21.5  fps
med. 1920x1080
Arc 7-Core:
18  fps
high 1920x1080
Arc 7-Core:
0 (!)  fps
ultra 1920x1080
Arc 7-Core:
0 (!)  fps
Palworld

Palworld

2024
low 1920x1080
Arc 7-Core:
34.8  fps
med. 1920x1080
Arc 7-Core:
32.6  fps
high 1920x1080
Arc 7-Core:
25.2  fps
ultra 1920x1080
Arc 7-Core:
23.4  fps
med. 1920x1080
Arc 7-Core:
215  fps
high 1920x1080
Arc 7-Core:
127  fps
ultra 1920x1080
Arc 7-Core:
120  fps
low 1920x1080
Arc 7-Core:
62.7  fps
med. 1920x1080
Arc 7-Core:
48.3  fps
high 1920x1080
Arc 7-Core:
44.5  fps
ultra 1920x1080
Arc 7-Core:
34.5  fps
low 1920x1080
Arc 7-Core:
70  fps
med. 1920x1080
Arc 7-Core:
47.7  fps
high 1920x1080
Arc 7-Core:
39.7  fps
ultra 1920x1080
Arc 7-Core:
34.6  fps
low 1920x1080
Arc 7-Core:
15  fps
med. 1920x1080
Arc 7-Core:
14  fps
high 1920x1080
Arc 7-Core:
12  fps
ultra 1920x1080
Arc 7-Core:
9  fps
low 1920x1080
Arc 7-Core:
28.6  fps
med. 1920x1080
Arc 7-Core:
21  fps
high 1920x1080
Arc 7-Core:
19.2  fps
ultra 1920x1080
Arc 7-Core:
17.9  fps
low 1920x1080
Arc 7-Core:
15.8  fps
med. 1920x1080
Arc 7-Core:
0 (!)  fps
high 1920x1080
Arc 7-Core:
0 (!)  fps
low 1920x1080
Arc 7-Core:
17.1  fps
med. 1920x1080
Arc 7-Core:
11.7  fps
high 1920x1080
Arc 7-Core:
11.4  fps
ultra 1920x1080
Arc 7-Core:
10.8  fps
low 1920x1080
Arc 7-Core:
95.5  fps
med. 1920x1080
Arc 7-Core:
56.8  fps
high 1920x1080
Arc 7-Core:
35.6  fps
ultra 1920x1080
Arc 7-Core:
28.1  fps
low 1920x1080
Arc 7-Core:
33  fps
med. 1920x1080
Arc 7-Core:
31  fps
high 1920x1080
Arc 7-Core:
27  fps
ultra 1920x1080
Arc 7-Core:
0 (!)  fps
low 1920x1080
Arc 7-Core:
90.2  fps
med. 1920x1080
Arc 7-Core:
57.9  fps
high 1920x1080
Arc 7-Core:
37.6  fps
ultra 1920x1080
Arc 7-Core:
24.7  fps
low 1920x1080
Arc 7-Core:
23.2 29.2 ~ 26 fps
med. 1920x1080
Arc 7-Core:
19.8 21.7 ~ 21 fps
high 1920x1080
Arc 7-Core:
16.6 19.1 ~ 18 fps
ultra 1920x1080
Arc 7-Core:
14.8 16.4 ~ 16 fps
Lies of P

Lies of P

2023
low 1920x1080
Arc 7-Core:
46  fps
med. 1920x1080
Arc 7-Core:
33.8  fps
high 1920x1080
Arc 7-Core:
32.6  fps
ultra 1920x1080
Arc 7-Core:
27.1  fps
low 1920x1080
Arc 7-Core:
26  fps
med. 1920x1080
Arc 7-Core:
24  fps
high 1920x1080
Arc 7-Core:
20  fps
ultra 1920x1080
Arc 7-Core:
17  fps
Starfield

Starfield

2023
low 1920x1080
Arc 7-Core:
19.1  fps
med. 1920x1080
Arc 7-Core:
16.5  fps
high 1920x1080
Arc 7-Core:
13.2  fps
ultra 1920x1080
Arc 7-Core:
10.7  fps
low 1920x1080
Arc 7-Core:
39.7  fps
med. 1920x1080
Arc 7-Core:
32.6  fps
high 1920x1080
Arc 7-Core:
28.5  fps
ultra 1920x1080
Arc 7-Core:
23.5  fps
low 1920x1080
Arc 7-Core:
40.5  fps
med. 1920x1080
Arc 7-Core:
40.3  fps
high 1920x1080
Arc 7-Core:
36.6  fps
ultra 1920x1080
Arc 7-Core:
26.4  fps
low 1920x1080
Arc 7-Core:
30.2  fps
med. 1920x1080
Arc 7-Core:
26.4  fps
high 1920x1080
Arc 7-Core:
22.8  fps
ultra 1920x1080
Arc 7-Core:
21.8  fps
low 1920x1080
Arc 7-Core:
0 (!)  fps
med. 1920x1080
Arc 7-Core:
0 (!)  fps
high 1920x1080
Arc 7-Core:
0 (!)  fps
ultra 1920x1080
Arc 7-Core:
0 (!)  fps
F1 23

F1 23

2023
low 1920x1080
Arc 7-Core:
58.7 68 ~ 63 fps
med. 1920x1080
Arc 7-Core:
53.5 60 ~ 57 fps
high 1920x1080
Arc 7-Core:
37.3 40 ~ 39 fps
ultra 1920x1080
Arc 7-Core:
0 (!)  fps
low 1920x1080
Arc 7-Core:
36.1  fps
med. 1920x1080
Arc 7-Core:
25.1  fps
high 1920x1080
Arc 7-Core:
23.6  fps
ultra 1920x1080
Arc 7-Core:
0 (!)  fps
low 1920x1080
Arc 7-Core:
51.5  fps
med. 1920x1080
Arc 7-Core:
45.4  fps
high 1920x1080
Arc 7-Core:
33.9  fps
ultra 1920x1080
Arc 7-Core:
33.3  fps
low 1920x1080
Arc 7-Core:
24.9  fps
med. 1920x1080
Arc 7-Core:
17.3  fps
high 1920x1080
Arc 7-Core:
15.5  fps
ultra 1920x1080
Arc 7-Core:
15.2  fps
low 1920x1080
Arc 7-Core:
40.7  fps
med. 1920x1080
Arc 7-Core:
31.9  fps
high 1920x1080
Arc 7-Core:
22.8  fps
ultra 1920x1080
Arc 7-Core:
16.4  fps
Returnal

Returnal

2023
low 1920x1080
Arc 7-Core:
30  fps
med. 1920x1080
Arc 7-Core:
29  fps
high 1920x1080
Arc 7-Core:
27  fps
ultra 1920x1080
Arc 7-Core:
23  fps
low 1920x1080
Arc 7-Core:
31  fps
med. 1920x1080
Arc 7-Core:
26.5  fps
high 1920x1080
Arc 7-Core:
17.3  fps
ultra 1920x1080
Arc 7-Core:
13.2  fps
low 1920x1080
Arc 7-Core:
31.6  fps
med. 1920x1080
Arc 7-Core:
27  fps
high 1920x1080
Arc 7-Core:
22.6  fps
ultra 1920x1080
Arc 7-Core:
21.6  fps
Strange Brigade

Strange Brigade

2018
low 1280x720
Arc 7-Core:
133 141 149 ~ 141 fps
med. 1920x1080
Arc 7-Core:
63 68 69.5 ~ 67 fps
high 1920x1080
Arc 7-Core:
50 54 57.7 ~ 54 fps
ultra 1920x1080
Arc 7-Core:
40 44 47.3 ~ 44 fps
Far Cry 5

Far Cry 5

2018
low 1280x720
Arc 7-Core:
37 64 74 ~ 58 fps
med. 1920x1080
Arc 7-Core:
34 37 41 ~ 37 fps
high 1920x1080
Arc 7-Core:
31 35 37 ~ 34 fps
ultra 1920x1080
Arc 7-Core:
31 35 ~ 33 fps
low 1280x720
Arc 7-Core:
47.1 47.5 52 ~ 49 fps
med. 1920x1080
Arc 7-Core:
35.9 38.3 40.1 ~ 38 fps
high 1920x1080
Arc 7-Core:
31.3 31.5 34.2 ~ 32 fps
low 1280x720
Arc 7-Core:
52.1 59.8 64.8 ~ 59 fps
med. 1920x1080
Arc 7-Core:
32.4 33.4 35.8 ~ 34 fps
high 1920x1080
Arc 7-Core:
22.2 25.3 25.3 ~ 24 fps
low 1280x720
Arc 7-Core:
93.5 93.8 94.3 ~ 94 fps
med. 1366x768
Arc 7-Core:
70.5 83 89.2 ~ 81 fps
high 1920x1080
Arc 7-Core:
66.3 68.4 75.8 ~ 70 fps
ultra 1920x1080
Arc 7-Core:
58.7 64.9 73 ~ 66 fps
low 1024x768
Arc 7-Core:
126 136 138 ~ 133 fps
med. 1366x768
Arc 7-Core:
80 85 88 ~ 84 fps
high 1920x1080
Arc 7-Core:
45 51 52 ~ 49 fps
ultra 1920x1080
Arc 7-Core:
18.3 23.4 26 ~ 23 fps
GTA V

GTA V

2015
low 1024x768
Arc 7-Core:
116.9 127.2 153 ~ 132 fps
med. 1366x768
Arc 7-Core:
106.4 119.9 151.6 ~ 126 fps
high 1920x1080
Arc 7-Core:
31 32.4 34.1 ~ 33 fps
ultra 1920x1080
Arc 7-Core:
13.7 13.7 14.8 ~ 14 fps
Intel Arc 7-Core iGPUlowmed.highultraQHD4K
Last Epoch53.838.73325.3
Skull & Bones33312418
Helldivers 232.12522.721.7
Enshrouded21.518
Palworld34.832.625.223.4
Prince of Persia The Lost Crown215127120
Ready or Not62.748.344.534.5
The Finals7047.739.734.6
Avatar Frontiers of Pandora1514129
EA Sports WRC28.62119.217.9
Alan Wake 215.8
Lords of the Fallen17.111.711.410.8
Total War Pharaoh95.556.835.628.1
Assassin's Creed Mirage333127
Counter-Strike 290.257.937.624.7
Cyberpunk 2077 2.1 Phantom Liberty26211816
Lies of P4633.832.627.1
The Crew Motorfest26242017
Starfield19.116.513.210.7
Armored Core 639.732.628.523.5
Atlas Fallen40.540.336.626.4
Baldur's Gate 330.226.422.821.8
Ratchet & Clank Rift Apart
F1 236357390
Resident Evil 4 Remake36.125.123.6
Company of Heroes 351.545.433.933.3
Sons of the Forest24.917.315.515.2
Atomic Heart40.731.922.816.4
Returnal30292723
Hogwarts Legacy3126.517.313.2
Cyberpunk 2077 1.631.62722.621.6
Strange Brigade141675444
Far Cry 558373433
X-Plane 11.11493832
Final Fantasy XV Benchmark593424
Dota 2 Reborn94817066
The Witcher 3133844923
GTA V1321263314
< 30 fps
< 60 fps
< 120 fps
≥ 120 fps
9
18
6
3
14
17
3
2
19
14
1
1
23
5
1
1


For more games that might be playable and a list of all games and graphics cards visit our Gaming List

Add one or more devices and compare

In the following list you can select (and also search for) devices that should be added to the comparison. You can select more than one device.

restrict list:

show all (including archived), 2024, 2023
v1.28
log 04. 16:31:14

#0 checking url part for id 10700 +0s ... 0s

#1 checking url part for id 12257 +0s ... 0s

#2 redirected to Ajax server, took 1720103474 +0s ... 0s

#3 did not recreate cache, as it is less than 5 days old! Created at Thu, 04 Jul 2024 05:15:44 +0200 +0s ... 0s

#4 composed specs +0.051s ... 0.051s

#5 did output specs +0s ... 0.051s

#6 start showIntegratedCPUs +0s ... 0.051s

#7 getting avg benchmarks for device 10700 +0.018s ... 0.07s

#8 got single benchmarks 10700 +0s ... 0.07s

#9 getting avg benchmarks for device 12257 +0.004s ... 0.074s

#10 got single benchmarks 12257 +0.007s ... 0.081s

#11 got avg benchmarks for devices +0s ... 0.081s

#12 min, max, avg, median took s +0.015s ... 0.097s

#13 before gaming benchmark output +0s ... 0.097s

#14 Got 206 rows for game benchmarks. +0.013s ... 0.11s

#15 composed SQL query for gamebenchmarks +0s ... 0.11s

#16 got data and put it in $dataArray +0.002s ... 0.112s

#17 benchmarks composed for output. +0.012s ... 0.124s

#18 calculated avg scores. +0s ... 0.124s

#19 return log +0.002s ... 0.126s

Please share our article, every link counts!
> Expert Reviews and News on Laptops, Smartphones and Tech Innovations > Benchmarks / Tech > Graphics Card Comparison - Head 2 Head
Redaktion, 2017-09- 8 (Update: 2023-07- 1)