Notebookcheck Logo

AMD Radeon HD 8280 vs Intel HD Graphics P630

AMD Radeon HD 8280

► remove from comparison

The AMD Radeon HD 8280 is an integrated DirectX 11.1 graphics card typically paired with AMD Kabini-class APUs (for example, E2-3000). It offers 128 shader cores and two Compute Units based on the GCN architecture and is clocked at 450 MHz with no support for Turbo. The graphics card does not have dedicated VRAM and will access the main memory of the system (up to single-channel DDR3L-1600).

The HD 8280 integrates both UVD 4.2 and VCE 2.0 video encoders. It supports up to two external monitors via VGA, DVI, HDMI 1.4a and DisplayPort 1.2.

Depending on the benchmark, the performance of the Radeon HD 8280 is slightly below the Intel HD Graphics (Haswell). This is on par with a dedicated Radeon HD 7370M, but is still too slow for most demanding games as of 2013. However, some older and less demanding games should run fluently if the performance of the CPU is sufficient.

Intel HD Graphics P630

► remove from comparison Intel HD Graphics P630

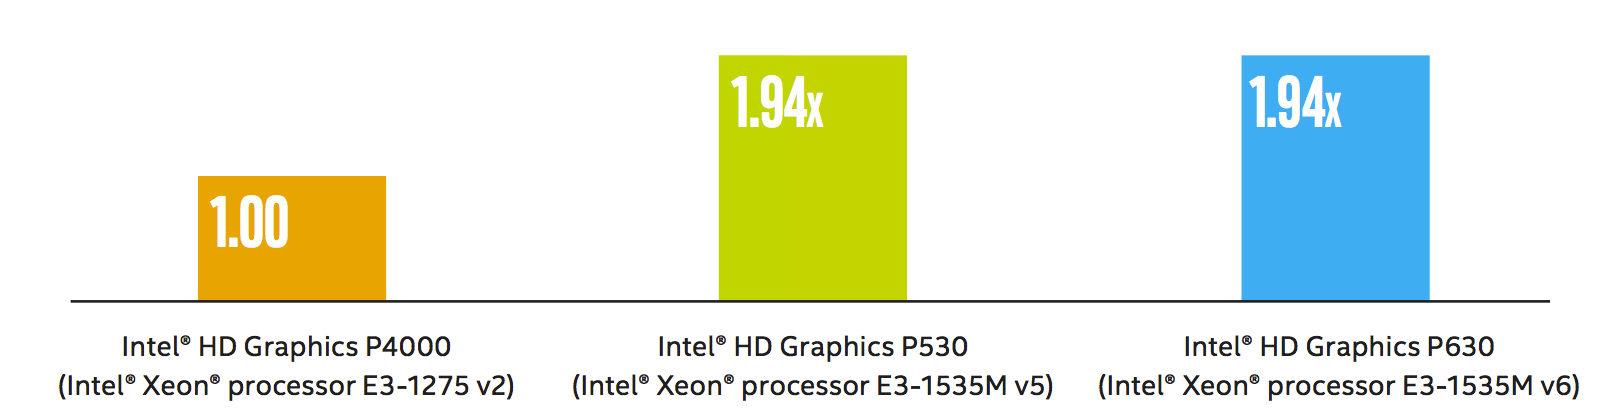
The Intel HD Graphics P630 (GT2) is an integrated graphics unit, which can be found in various Xeon workstation processors of the Kaby Lake generation. The "GT2" version of the Skylake GPU offers 24 Execution Units (EUs) clocked at up to 1050 MHz (depending on the CPU model). Due to its lack of dedicated graphics memory or eDRAM cache, the P630 has to access the main memory (2x 64bit DDR3L-1600 / DDR4-2133). It uses the same silicon as the consumer HD Graphics 630 in Kaby-Lake-H processors but features optimized drivers for workstaion and CAD software. According to Intel it is certified for 15 applications (see list).

Performance

According to Intel, the performance of the P630 is identical to the Intel HD Graphis P530 (Skylake predecessor) processor graphics card and 1.94x faster than the old Intel HD Graphics P4000. Compared to consumer cards, the gaming performance should be on a similar level to the dedicated GeForce 920M and will handle old games (as of 2015) in low or medium settings.

Features

The revised video engine in the Kaby Lake chips now supports H.265/HEVC Main10 profile at 10-bit color depth and also the VP9 codec in hardware. Furthermore, HDCP 2.2 is also supported in all chips, which allows Netflix 4K videos, for instance.

Power Consumption

The HD Graphics P630 can be found in mobile quad-core Xeon processors with 45 W TDP and also desktop processors of the Xeon range with higher TDPs.

Sourcehttp://www.intel.com/content/dam/www/public/us/en/documents/guides/hd-graphics-performance-guide.pdf

AMD Radeon HD 8280Intel HD Graphics P630
Gen. 9.5 Series
Radeon HD 8400 compare 128 @ 0.6 GHz
Radeon HD 8330 compare 128 @ 0.5 GHz
Radeon HD 8280 128 @ 0.45 GHz
Radeon HD 8240 compare 128 @ 0.4 GHz
Radeon HD 8250 compare 128 @ 0.3 - 0.4 GHz
Radeon HD 8210 compare 128 @ 0.3 GHz
Radeon HD 8180 compare 128 @ 0.23 GHz
Iris Plus Graphics 655 compare 48 @ 0.3 - 1.2 GHz
Iris Plus Graphics 650 compare 48 @ 0.3 - 1.1 GHz64/128 Bit
Iris Plus Graphics 645 compare 48 @ 0.3 - 1.15 GHz
Iris Plus Graphics 640 compare 48 @ 0.3 - 1.05 GHz64/128 Bit
UHD Graphics 630 compare 24 @ 0.3 - 1.15 GHz64/128 Bit
UHD Graphics P630 compare 24 @ 0.3 - 1.2 GHz64/128 Bit
HD Graphics 630 compare 24 @ 0.3 - 1.15 GHz64/128 Bit
HD Graphics P630 24 64/128 Bit
UHD Graphics 620 compare 24 @ 0.3 - 1.15 GHz
HD Graphics 620 compare 24 @ 0.3 - 1.05 GHz64/128 Bit
UHD Graphics 617 compare 24 @ 0.3 - 1.15 GHz64/128 Bit
UHD Graphics 615 compare 24 @ 0.3 - 1 GHz64/128 Bit
HD Graphics 615 compare 24 @ 0.3 - 1.05 GHz64/128 Bit
CodenameTemashKaby-Lake-H-GT2
ArchitectureGCNGen. 9.5 Kaby Lake
Pipelines128 - unified24 - unified
Core Speed450 MHz
Shared Memoryyesyes
APIDirectX 11.1, Shader 5.0DirectX 12_1, OpenGL 4.4
technology28 nm14 nm
Date of Announcement23.05.2013 05.08.2015
Memory Bus Width64/128 Bit
FeaturesQuickSync
CPU in Radeon HD 8280GPU Base SpeedGPU Boost / Turbo
AMD E2-38004 x 1300 MHz, 15 W? MHz450 MHz
CPU in HD Graphics P630GPU Base SpeedGPU Boost / Turbo
Intel Xeon E3-1535M v64 x 3100 MHz, 45 W300 MHz1150 MHz
Intel Xeon E3-1505M v64 x 3000 MHz, 45 W300 MHz1150 MHz
min. - max.300 - ? MHz450 - 1150 MHz

Benchmarks

Performance Rating - 3DMark 11 + Fire Strike + Time Spy - Radeon HD 8280
0.1 pt (0%)
3DMark - 3DMark Time Spy Score
400 Points (1%)
3DMark - 3DMark Cloud Gate Score
2054 Points (2%)
8280 Points (9%)
3DMark - 3DMark Cloud Gate Graphics
2515 Points (1%)
3DMark - 3DMark Fire Strike Standard Score
303 Points (1%)
1040 Points (2%)
3DMark - 3DMark Fire Strike Standard Graphics
328 Points (0%)
3DMark - 3DMark Ice Storm Graphics
28399 Points (3%)
3DMark 11 - 3DM11 Performance Score
554 Points (1%)
3DMark 11 - 3DM11 Performance GPU
496 Points (0%)
Cinebench R10 Cinebench R10 Shading (32bit) + AMD Radeon HD 8280
Cinebench R10 - Cinebench R10 Shading (32bit)
1041 Points (1%)
Cinebench R11.5 Cinebench R11.5 OpenGL 64 Bit + AMD Radeon HD 8280
Cinebench R11.5 - Cinebench R11.5 OpenGL 64 Bit
12.1 fps (4%)
Cinebench R15
Cinebench R15 OpenGL 64 Bit + AMD Radeon HD 8280
Cinebench R15 - Cinebench R15 OpenGL 64 Bit
11 fps (1%)
Cinebench R15 OpenGL Ref. Match 64 Bit + AMD Radeon HD 8280
Cinebench R15 - Cinebench R15 OpenGL Ref. Match 64 Bit
98 % (98%)
ComputeMark v2.1 - ComputeMark v2.1 Result
295 Points (0%)

Average Benchmarks AMD Radeon HD 8280 → 100% n=2

Average Benchmarks Intel HD Graphics P630 → 373% n=2

- Range of benchmark values for this graphics card
- Average benchmark values for this graphics card
* Smaller numbers mean a higher performance
1 This benchmark is not used for the average calculation

Game Benchmarks

The following benchmarks stem from our benchmarks of review laptops. The performance depends on the used graphics memory, clock rate, processor, system settings, drivers, and operating systems. So the results don't have to be representative for all laptops with this GPU. For detailed information on the benchmark results, click on the fps number.

Titanfall

Titanfall

2014
low 1024x768
100%
Radeon HD 8280:
21  fps
med. 1366x768
100%
Radeon HD 8280:
10.2  fps
Thief

Thief

2014
low 1024x768
100%
Radeon HD 8280:
7.8  fps
low 1024x768
100%
Radeon HD 8280:
15.8  fps
med. 1366x768
100%
Radeon HD 8280:
7.8  fps
low 1024x768
100%
Radeon HD 8280:
11.9  fps
low 1024x768
100%
Radeon HD 8280:
15.9  fps
med. 1366x768
100%
Radeon HD 8280:
11.7  fps
low 1024x768
100%
Radeon HD 8280:
21  fps
med. 1366x768
100%
Radeon HD 8280:
13  fps
F1 2013

F1 2013

2013
low 1024x768
100%
Radeon HD 8280:
27  fps
med. 1366x768
100%
Radeon HD 8280:
20  fps
high 1366x768
100%
Radeon HD 8280:
19  fps
Fifa 14

Fifa 14

2013
med. 1366x768
100%
Radeon HD 8280:
51.2  fps
high 1366x768
100%
Radeon HD 8280:
37.2  fps
low 1024x768
100%
Radeon HD 8280:
19.2  fps
med. 1366x768
100%
Radeon HD 8280:
14.3  fps
low 1280x720
100%
Radeon HD 8280:
12.3  fps
med. 1366x768
100%
Radeon HD 8280:
10.2  fps
low 1024x768
100%
Radeon HD 8280:
14.4  fps
med. 1366x768
100%
Radeon HD 8280:
9  fps
low 1024x768
100%
Radeon HD 8280:
17.7  fps
med. 1366x768
100%
Radeon HD 8280:
11.5  fps
Dota 2

Dota 2

2013
low 1024x768
100%
Radeon HD 8280:
22.1  fps
med. 1366x768
100%
Radeon HD 8280:
15  fps
low 1024x768
100%
Radeon HD 8280:
7.3  fps
GRID 2

GRID 2

2013
low 1024x768
100%
Radeon HD 8280:
28.9  fps
med. 1366x768
100%
Radeon HD 8280:
19.9  fps
high 1366x768
100%
Radeon HD 8280:
13.6  fps
low 1024x768
100%
Radeon HD 8280:
3.6  fps
low 1280x720
100%
Radeon HD 8280:
23.7  fps
med. 1366x768
100%
Radeon HD 8280:
11.7  fps
low 1024x768
100%
Radeon HD 8280:
50.3  fps
med. 1366x768
100%
Radeon HD 8280:
22.1  fps
high 1366x768
100%
Radeon HD 8280:
12.3  fps
low 1024x768
100%
Radeon HD 8280:
25.1  fps
med. 1366x768
100%
Radeon HD 8280:
12.4  fps
high 1366x768
100%
Radeon HD 8280:
8.7  fps
Crysis 3

Crysis 3

2013
low 1024x768
100%
Radeon HD 8280:
12.6  fps
low 1024x768
100%
Radeon HD 8280:
47.9  fps
med. 1366x768
100%
Radeon HD 8280:
17.6  fps
high 1366x768
100%
Radeon HD 8280:
14.1  fps
low 1024x768
100%
Radeon HD 8280:
31.1  fps
med. 1366x768
100%
Radeon HD 8280:
19.8  fps
high 1366x768
100%
Radeon HD 8280:
16  fps
low 1280x720
100%
Radeon HD 8280:
18.1  fps
med. 1366x768
100%
Radeon HD 8280:
12.9  fps
World of Warcraft

World of Warcraft

2005
low 800x600
100%
Radeon HD 8280:
67.3  fps
med. 1024x768
100%
Radeon HD 8280:
37.8  fps

Average Gaming AMD Radeon HD 8280 → 100%

Average Gaming 30-70 fps → 100%

AMD Radeon HD 8280lowmed.highultraQHD4K
Titanfall2110.2
Thief7.8
X-Plane 10.2515.87.8
Call of Duty: Ghosts11.9
Battlefield 415.911.7
Batman: Arkham Origins2113
F1 2013272019
Fifa 1451.237.2
Total War: Rome II19.214.3
Saints Row IV12.310.2
The Bureau: XCOM Declassified14.49
Splinter Cell: Blacklist17.711.5
Dota 222.115
Company of Heroes 27.3
GRID 228.919.913.6
Metro: Last Light3.6
BioShock Infinite23.711.7
StarCraft II: Heart of the Swarm50.322.112.3
Tomb Raider25.112.48.7
Crysis 312.6
Dead Space 347.917.614.1
Diablo III31.119.816
The Elder Scrolls V: Skyrim18.112.9
World of Warcraft67.337.8
< 30 fps
< 60 fps
< 120 fps
≥ 120 fps
19
3
1
17
2

6
1


For more games that might be playable and a list of all games and graphics cards visit our Gaming List

Add one or more devices and compare

In the following list you can select (and also search for) devices that should be added to the comparison. You can select more than one device.

restrict list:

show all (including archived), 2024, 2023
v1.28
log 03. 18:49:53

#0 checking url part for id 4605 +0s ... 0s

#1 checking url part for id 7657 +0s ... 0s

#2 redirected to Ajax server, took 1720025393 +0s ... 0s

#3 did not recreate cache, as it is less than 5 days old! Created at Mon, 01 Jul 2024 05:16:07 +0200 +0s ... 0s

#4 composed specs +0.027s ... 0.027s

#5 did output specs +0s ... 0.027s

#6 start showIntegratedCPUs +0s ... 0.027s

#7 getting avg benchmarks for device 4605 +0.02s ... 0.048s

#8 got single benchmarks 4605 +0.004s ... 0.051s

#9 getting avg benchmarks for device 7657 +0s ... 0.051s

#10 got single benchmarks 7657 +0.003s ... 0.054s

#11 got avg benchmarks for devices +0s ... 0.054s

#12 min, max, avg, median took s +0.007s ... 0.061s

#13 before gaming benchmark output +0s ... 0.061s

#14 Got 49 rows for game benchmarks. +0.002s ... 0.063s

#15 composed SQL query for gamebenchmarks +0s ... 0.063s

#16 got data and put it in $dataArray +0.002s ... 0.064s

#17 benchmarks composed for output. +0.009s ... 0.073s

#18 calculated avg scores. +0s ... 0.073s

#19 return log +0.002s ... 0.075s

Please share our article, every link counts!
> Expert Reviews and News on Laptops, Smartphones and Tech Innovations > Benchmarks / Tech > Graphics Card Comparison - Head 2 Head
Redaktion, 2017-09- 8 (Update: 2023-07- 1)