Notebookcheck Logo

AMD Ryzen 9 7950X3D vs Apple M3 Max 14-Core vs Apple M3

AMD Ryzen 9 7950X3D

► remove from comparison AMD R9 7950X3D

The AMD Ryzen 9 7950X3D is a high-end desktop processor of the Raphael series with 16 cores and SMT (Simultaneous Multithreading), which means it can process up to 32 threads simultaneously. With the release in February 2023, the Ryzen 9 7950X3D is AMD's fastest consumer processor and the new top model of the 7000 series. The CPU cores clock from 4.2 GHz (base clock) up to 5.7 GHz (single core Turbo). In addition, the AMD Ryzen 9 7950X3D has a CCD with 8 cores that can access the fast 3D V-cache, which offers considerably more gaming performance.

The performance of the AMD Ryzen 9 7950X3D is consistently excellent in all applications tested. In addition, AMD was again able to increase the single-thread performance compared to the non-X3D models. Nevertheless, the lower base clock compared to the AMD Ryzen 9 7950X means that a small drop in multi-thread performance has to be accepted.

The internal structure of the processor is comparable to the previous AMD Ryzen 9 7950X. The AMD Ryzen 9 7950X3D is also still based on the chiplet design consisting of two CCD clusters with 8 cores each. However, the two CCDs differ significantly from each other because one offers the fast 3D V-Cache, which primarily improves gaming performance. In testing, the AMD Ryzen 9 7950X3D was able to put the Intel Core i9-13900K in second place and is the fastest gaming CPU on the market at the time of testing. 

The AMD Ryzen 9 7950X3D is an extremely energy-efficient CPU with up to 162 watts (PPT) and is significantly more frugal under load than an AMD Ryzen 9 7950X (max. 230 watts).

Apple M3 Max 14-Core

► remove from comparison Apple Apple M3 Max 14-Core

The Apple M3 Max 14 core CPU is a system on a chip (SoC) from Apple for notebooks that was introduced towards the end of 2023. It integrates a new 14-core CPU with 10 performance cores with up to 4.06 GHz and 4 efficiency cores with 2.8 GHz. There is also a more powerful 16-core variant with 40 GPU cores.

Thanks to the higher clock rates and architectural improvements, the processor performance is also significantly better than the M2 Max in benchmarks and can keep up with the fastest mobile CPUs.

The M3 also integrates a new graphics card with dynamic caching, mesh shading and ray tracing acceleration via hardware. In the cheaper model, 30 of the chip's 40 cores are used and support up to 5 displays simultaneously (internal and 4 external).

GPU and CPU can jointly access the shared memory on the package (unified memory). This is available in 36 and 96 GB variants and offers 400 GB/s maximum bandwidth (512 bit bus).

The integrated 16-core Neural Engine has also been revised and now offers 18 TOPS peak performance (compared to 15.8 TOPS in the M2 but 35 TOPS in the new A17 Pro). The video engine now also supports AV1 decoding in hardware. H.264, HEVC and ProRes (RAW) can still be decoded and encoded. Like its predecessor, the Max chip offers two video engines and can therefore encode and decode two streams simultaneously.

Unfortunately, the integrated WLAN only continues to support WiFi 6E (no WiFi 7), unlike the small M3 SoC thunderbolt 4 is also supported (max 40 Gbit/s).

The chip is manufactured in the current 3nm process (N3B) at TSMC and contains 92 billion transistors (+37% vs. Apple M2 Max).

Apple M3

► remove from comparison Apple M3

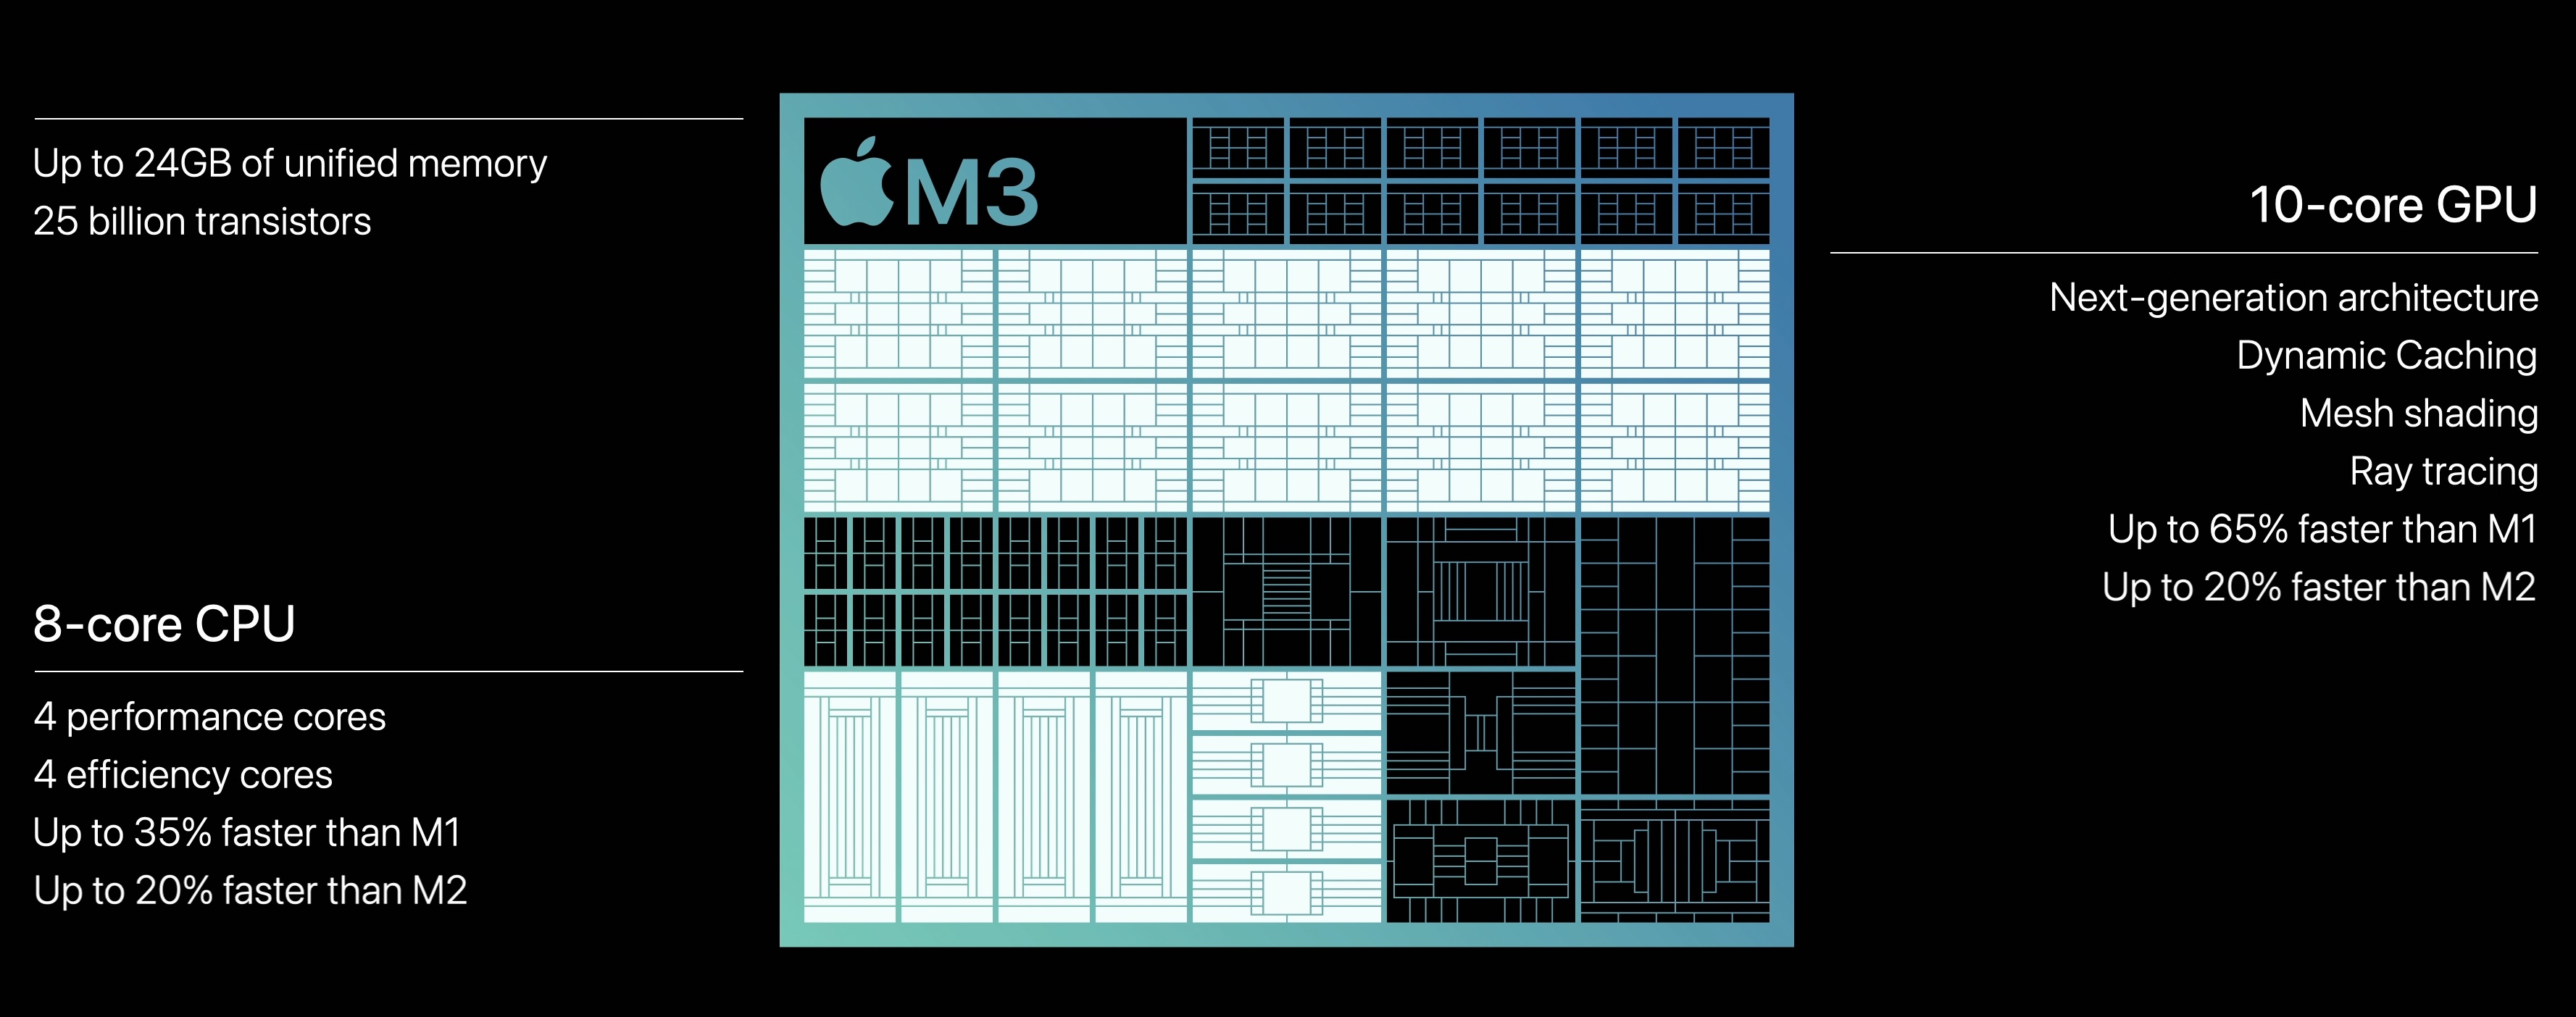
The Apple M3 is a system on a chip (SoC) from Apple for notebooks that was introduced in late 2023. It integrates a new 8-core CPU with 4 performance cores with up to 4.06 GHz and 4 efficiency cores running at up to 2.75 GHz. Apple claims that the CPU is up to 20% faster than in the old Apple M2 (3.5 GHz)

Due to the higher clock speeds and architecture improvements, the processor performance is also significantly better than the M2 in benchmarks (see e.g. Geekbench below) and can keep up with the fastest CPUs in short single-core tests (like the Raptor Lake i9-13950HX).

The M3 also integrates a new graphics adapter with dynamic caching, mesh shading and ray tracing acceleration. According to Apple, it is 20% faster than the GPU in the M2. The chip integrates again 10 GPU cores, but the cheaper variant only offers 8 cores (e.g. in the entry iMac). Furthermore, the GPU only supports 2 displays (an additional 6K60 display to the internal one).

Both GPU and CPU can access the unified memory on the package together. It is still available in 8, 16 and 24 GB variants and offers the same 100 GB/s maximum bandwidth (unlike the Pro models that feature a reduced memory bandwidth). 

The integrated 16-core Neural Engine has also been revised and now offers 18 TOPS peak performance (versus 15.8 TOPS in the M2 but 35 TOPS in the new A17 Pro). The video engine now supports AV1 decoding in hardware. H.264, HEVC and ProRes (RAW) can still be decoded and encoded.

Unfortunately, the integrated wireless network module only supports Wi-Fi 6E (no Wi-Fi 7) and due to the support of only a single external monitor, the chip also has to make do with no Thunderbolt 4 (Thunderbolt 3 / USB 4 support only for up to 40 Gbit/s).

The chip is manufactured on the current 3nm TSMC process (N3B most likely) and contains 25 billion transistors (+25% vs. Apple M2). The 3nm process should also contribute to the excellent efficiency of the chip. Under load, the M3 CPU consumes approximately 20 Watt.

ModelAMD Ryzen 9 7950X3DApple M3 Max 14-CoreApple M3
SeriesAMD Raphael (Zen 4, Ryzen 7000)Apple Apple M3Apple Apple M3
CodenameRaphael (Zen4)
Series: Apple M3
AMD Ryzen 9 7950X3D « 4.2 - 5.7 GHz16 / 32 cores128 MB L3
AMD Ryzen 9 7900X4.7 - 5.6 GHz12 / 24 cores64 MB L3
AMD Ryzen 9 79003.7 - 5.4 GHz12 / 24 cores64 MB L3
AMD Ryzen 7 7700X4.5 - 5.4 GHz8 / 16 cores32 MB L3
AMD Ryzen 7 77003.8 - 5.3 GHz8 / 16 cores32 MB L3
AMD Ryzen 7 7800X3D4.2 - 5 GHz8 / 16 cores96 MB L3
AMD Ryzen 5 7600X4.7 - 5.3 GHz6 / 12 cores32 MB L3
AMD Ryzen 5 76003.8 - 5.1 GHz6 / 12 cores32 MB L3
Apple M3 Max 16-Core2.75 - 4.06 GHz16 / 16 cores
Apple M3 Max 14-Core « 2.75 - 4.06 GHz14 / 14 cores
Apple M3 Pro 12-Core2.75 - 4.06 GHz12 / 12 cores
Apple M3 Pro 11-Core2.75 - 4.06 GHz11 / 11 cores
Apple M32.75 - 4.06 GHz8 / 8 cores
Apple M3 Max 16-Core2.75 - 4.06 GHz16 / 16 cores
Apple M3 Max 14-Core2.75 - 4.06 GHz14 / 14 cores
Apple M3 Pro 12-Core2.75 - 4.06 GHz12 / 12 cores
Apple M3 Pro 11-Core2.75 - 4.06 GHz11 / 11 cores
Apple M3 « 2.75 - 4.06 GHz8 / 8 cores
Clock4200 - 5700 MHz2748 - 4056 MHz2748 - 4056 MHz
L1 Cache1 MB
L2 Cache16 MB4 MB
L3 Cache128 MB
Cores / Threads16 / 32
16 x 5.7 GHz AMD Zen 4
14 / 14
10 x 4.1 GHz Apple M3 P-Core
4 x 2.7 GHz Apple M3 E-Core
8 / 8
4 x 4.1 GHz Apple M3 P-Core
4 x 2.7 GHz Apple M3 E-Core
TDP120 Watt78 Watt
Transistors13140 Million92000 Million25000 Million
Technology5 nm3 nm3 nm
Die Size263 mm2
max. Temp.89 °C
SocketAM5 (LGA 1718)
FeaturesMMX(+), SSE, SSE2, SSE3, SSSE3, SSE4.1, SSE4.2, SSE4A, x86-64, AMD-V, AES, AVX, AVX2, AVX512F, FMA3, SHA, XFR2, Precision Boost 2ARMv8 Instruction SetARMv8 Instruction Set
iGPUAMD Radeon Graphics (Ryzen 7000) (400 - 2200 MHz)Apple M3 Max 30-Core GPUApple M3 10-Core GPU
Architecturex86ARMARM
$699 U.S.
Announced
Manufacturerwww.amd.comwww.apple.comwww.apple.com

Benchmarks

Performance Rating - CB R15 + R20 + 7-Zip + X265 + Blender + 3DM11 CPU - R9 7950X3D
61.1 pt (85%)
Cinebench 2024 - Cinebench 2024 CPU Single Core
100%
1 M3 +
min: 140     avg: 141     median: 141 (98%)     max: 142 Points
Cinebench 2024 - Cinebench 2024 CPU Multi Core
100%
1 M3 +
min: 576     avg: 622     median: 599.5 (11%)     max: 712 Points
Cinebench R23 - Cinebench R23 Multi Core
36291 Points (34%)
28%
1 M3 +
min: 10074     avg: 10275     median: 10298 (10%)     max: 10454 Points
Cinebench R23 - Cinebench R23 Single Core
2053 Points (87%)
93%
1 M3 +
min: 1900     avg: 1901     median: 1900 (81%)     max: 1904 Points
Cinebench R20 - Cinebench R20 CPU (Single Core)
795 Points (88%)
63%
1 M3 +
504 Points (56%)
Cinebench R20 - Cinebench R20 CPU (Multi Core)
14188 Points (35%)
20%
1 M3 +
2818 Points (7%)
Cinebench R15 - Cinebench R15 CPU Multi 64 Bit
5974 Points (38%)
25%
1 M3 +
1499 Points (9%)
Cinebench R15 - Cinebench R15 CPU Single 64 Bit
326 Points (98%)
83%
1 M3 +
271 Points (82%)
Cinebench R11.5 - Cinebench R11.5 CPU Multi 64 Bit
64.6 Points (84%)
Cinebench R11.5 - Cinebench R11.5 CPU Single 64 Bit
3.9 Points (96%)
Cinebench R10 - Cinebench R10 Rend. Single (32bit)
16551 Points (100%)
Cinebench R10 - Cinebench R10 Rend. Multi (32bit)
138015 Points (100%)
Cinebench R10 - Cinebench R10 Rend. Multi (64bit)
72361 Points (50%)
Cinebench R10 - Cinebench R10 Rend. Single (64bit)
8853 Points (11%)
wPrime 2.10 - wPrime 2.0 1024m *
33.9 s (0%)
wPrime 2.10 - wPrime 2.0 32m *
2 s (0%)
WinRAR - WinRAR 4.0
15779 Points (25%)
7-Zip 18.03 - 7-Zip 18.03 Multli Thread 4 runs
159341 MIPS (91%)
7-Zip 18.03 - 7-Zip 18.03 Single Thread 4 runs
8321 MIPS (99%)
X264 HD Benchmark 4.0 - x264 Pass 2
265.5 fps (93%)
X264 HD Benchmark 4.0 - x264 Pass 1
392.5 fps (91%)
HWBOT x265 Benchmark v2.2 - HWBOT x265 4k Preset
42.4 fps (75%)
TrueCrypt - TrueCrypt Serpent
2.8 GB/s (0%)
TrueCrypt - TrueCrypt Twofish
4.2 GB/s (72%)
TrueCrypt - TrueCrypt AES
26.9 GB/s (70%)
Blender - Blender 3.3 Classroom CPU *
133 Seconds (2%)
95%
1 M3 +
min: 491     avg: 590     median: 517 (7%)     max: 761 Seconds
Blender - Blender 2.79 BMW27 CPU *
86 Seconds (1%)
97%
1 M3 +
min: 474     avg: 509     median: 494 (3%)     max: 558 Seconds
R Benchmark 2.5 - R Benchmark 2.5 *
0.4 sec (8%)
3DMark 06 - CPU - 3DMark 06 - CPU
20279 Points (43%)
Super Pi mod 1.5 XS 1M - Super Pi mod 1.5 XS 1M *
6.1 s (1%)
Super Pi mod 1.5 XS 2M - Super Pi mod 1.5 XS 2M *
13.2 s (1%)
Super Pi Mod 1.5 XS 32M - Super Pi mod 1.5 XS 32M *
305.1 s (1%)
3DMark Vantage - 3DM Vant. Perf. CPU no Physx
99321 Points (87%)
3DMark 11 - 3DM11 Performance Physics
36991 Points (100%)
3DMark - 3DMark Ice Storm Physics
86389 Points (70%)
3DMark - 3DMark Ice Storm Extreme Physics
86306 Points (70%)
3DMark - 3DMark Ice Storm Unlimited Physics
87725 Points (74%)
3DMark - 3DMark Cloud Gate Physics
26168 Points (66%)
3DMark - 3DMark Fire Strike Standard Physics
44787 Points (80%)
3DMark - 3DMark Time Spy CPU
17206 Points (73%)
Geekbench 6.2 - Geekbench 6.2 Single-Core
100%
1 M3 +
min: 3026     avg: 3077     median: 3076 (83%)     max: 3130 Points
Geekbench 6.2 - Geekbench 6.2 Multi-Core
100%
1 M3 +
min: 11863     avg: 11984     median: 11992 (47%)     max: 12066 Points
Geekbench 5.5 - Geekbench 5.1 - 5.4 64 Bit Single-Core
2311 Points (98%)
101%
1 M3 +
min: 2256     avg: 2316     median: 2342 (99%)     max: 2350 Points
Geekbench 5.5 - Geekbench 5.1 - 5.4 64 Bit Multi-Core
24343 Points (44%)
44%
1 M3 +
min: 10570     avg: 10697     median: 10748 (19%)     max: 10774 Points
Geekbench 5.0 - Geekbench 5.0 64 Bit Single-Core
2183 Points (9%)
Geekbench 5.0 - Geekbench 5.0 64 Bit Multi-Core
23720 Points (75%)
Geekbench 4.4 - Geekbench 4.1 - 4.4 64 Bit Single-Core
9240 Points (92%)
Geekbench 4.4 - Geekbench 4.1 - 4.4 64 Bit Multi-Core
87922 Points (96%)
Mozilla Kraken 1.1 - Kraken 1.1 Total Score *
437 ms (1%)
100%
1 M3 +
min: 362.8     avg: 366.4     median: 363.1 (0%)     max: 373.2 ms
Octane V2 - Octane V2 Total Score
100%
1 M3 +
min: 96622     avg: 97216     median: 96933 (85%)     max: 98093 Points
WebXPRT 4 - WebXPRT 4 Score
313 Points (90%)
100%
1 M3 +
min: 313     avg: 314     median: 314 (90%)     max: 315 Points
WebXPRT 3 - WebXPRT 3 Score
383 Points (80%)
116%
1 M3 +
min: 423     avg: 438.7     median: 445 (93%)     max: 448 Points
CrossMark - CrossMark Overall
2193 Points (84%)
84%
1 M3 +
min: 1847     avg: 1850     median: 1847 (71%)     max: 1857 Points
Power Consumption - Prime95 Power Consumption - external Monitor *
276 Watt (48%)
Power Consumption - Cinebench R15 Multi Power Consumption - external Monitor *
273 Watt (50%)
Power Consumption - Idle Power Consumption - external Monitor *
118.4 Watt (78%)
452%
1 M3 +
min: 2.63     avg: 2.8     median: 2.8 (2%)     max: 2.87 Watt
Power Consumption - Idle Power Consumption 150cd 1min *
100%
1 M3 +
min: 3.94     avg: 4.4     median: 4.4 (5%)     max: 4.7 Watt
Power Consumption - Cinebench R15 Multi Power Efficiency - external Monitor
21.9 Points per Watt (16%)

Average Benchmarks AMD Ryzen 9 7950X3D → 0% n=

Average Benchmarks Apple M3 → 0% n=

- Range of benchmark values for this graphics card
- Average benchmark values for this graphics card
* Smaller numbers mean a higher performance
1 This benchmark is not used for the average calculation

v1.28
log 01. 22:41:55

#0 checking url part for id 15000 +0s ... 0s

#1 checking url part for id 16356 +0s ... 0s

#2 checking url part for id 15110 +0s ... 0s

#3 redirected to Ajax server, took 1719866515 +0s ... 0s

#4 did not recreate cache, as it is less than 5 days old! Created at Mon, 01 Jul 2024 05:15:43 +0200 +0s ... 0s

#5 composed specs +0.009s ... 0.009s

#6 did output specs +0s ... 0.009s

#7 getting avg benchmarks for device 15000 +0.005s ... 0.014s

#8 got single benchmarks 15000 +0.005s ... 0.019s

#9 getting avg benchmarks for device 16356 +0.001s ... 0.02s

#10 got single benchmarks 16356 +0s ... 0.02s

#11 getting avg benchmarks for device 15110 +0.001s ... 0.021s

#12 got single benchmarks 15110 +0.007s ... 0.027s

#13 got avg benchmarks for devices +0s ... 0.027s

#14 min, max, avg, median took s +0.036s ... 0.063s

#15 return log +0s ... 0.063s

Please share our article, every link counts!
> Expert Reviews and News on Laptops, Smartphones and Tech Innovations > Benchmarks / Tech > Processor Comparison - Head 2 Head
Redaktion, 2017-09- 8 (Update: 2023-07- 1)