Notebookcheck Logo

AMD Ryzen 9 7945HX3D vs AMD Ryzen 7 7800X3D vs AMD Ryzen 9 7945HX

AMD Ryzen 9 7945HX3D

► remove from comparison AMD R9 7945HX3D

The AMD Ryzen 9 7945HX3D is a fast high-end laptop processor of the Dragon Range series. It offers 16 cores based on the Zen 4 architecture that supports hyperthreading (32 threads). The cores clock from 2.3 (base) up to 5.4 GHz (single core boost). Compared to the similar R9 7945HX, the 7945HX3D offers an additional 64 MB 3D V-Cache on one CCD-Cluster. This helps in some workloads that can use the additional fast cache (e.g. some games). The guaranteed base clock however was reduced from 2.5 to 2.3 GHz.

The performance of the R9 7945HX3D is similar to the R9 7945HX in workloads that wont make use of the bigger L3 cache. Most games however can use the additional memory. AMD e.g. was advertising the HX3D with 4% to 53% higher performance in 1080p high settings.

The Dragon Range series still uses a chiplet design with two CCD-clusters (each with 8 possible cores) in 5nm and an IO-die (including the memory controller and the Radeon 610M iGPU) in 6nm. The chip integrates 4x USB 3.2 Gen2 (10 Gbps) ports (no USB4), 28 PCIe 5.0 lanes (for GPU and SSDs) and a dual-channel DDR5-5200 memory controller.

The R9 7945HX3D is rated at a TDP of 55 Watt and can be configured up to 75 Watt (cTDP).

AMD Ryzen 7 7800X3D

► remove from comparison AMD R7 7800X3D

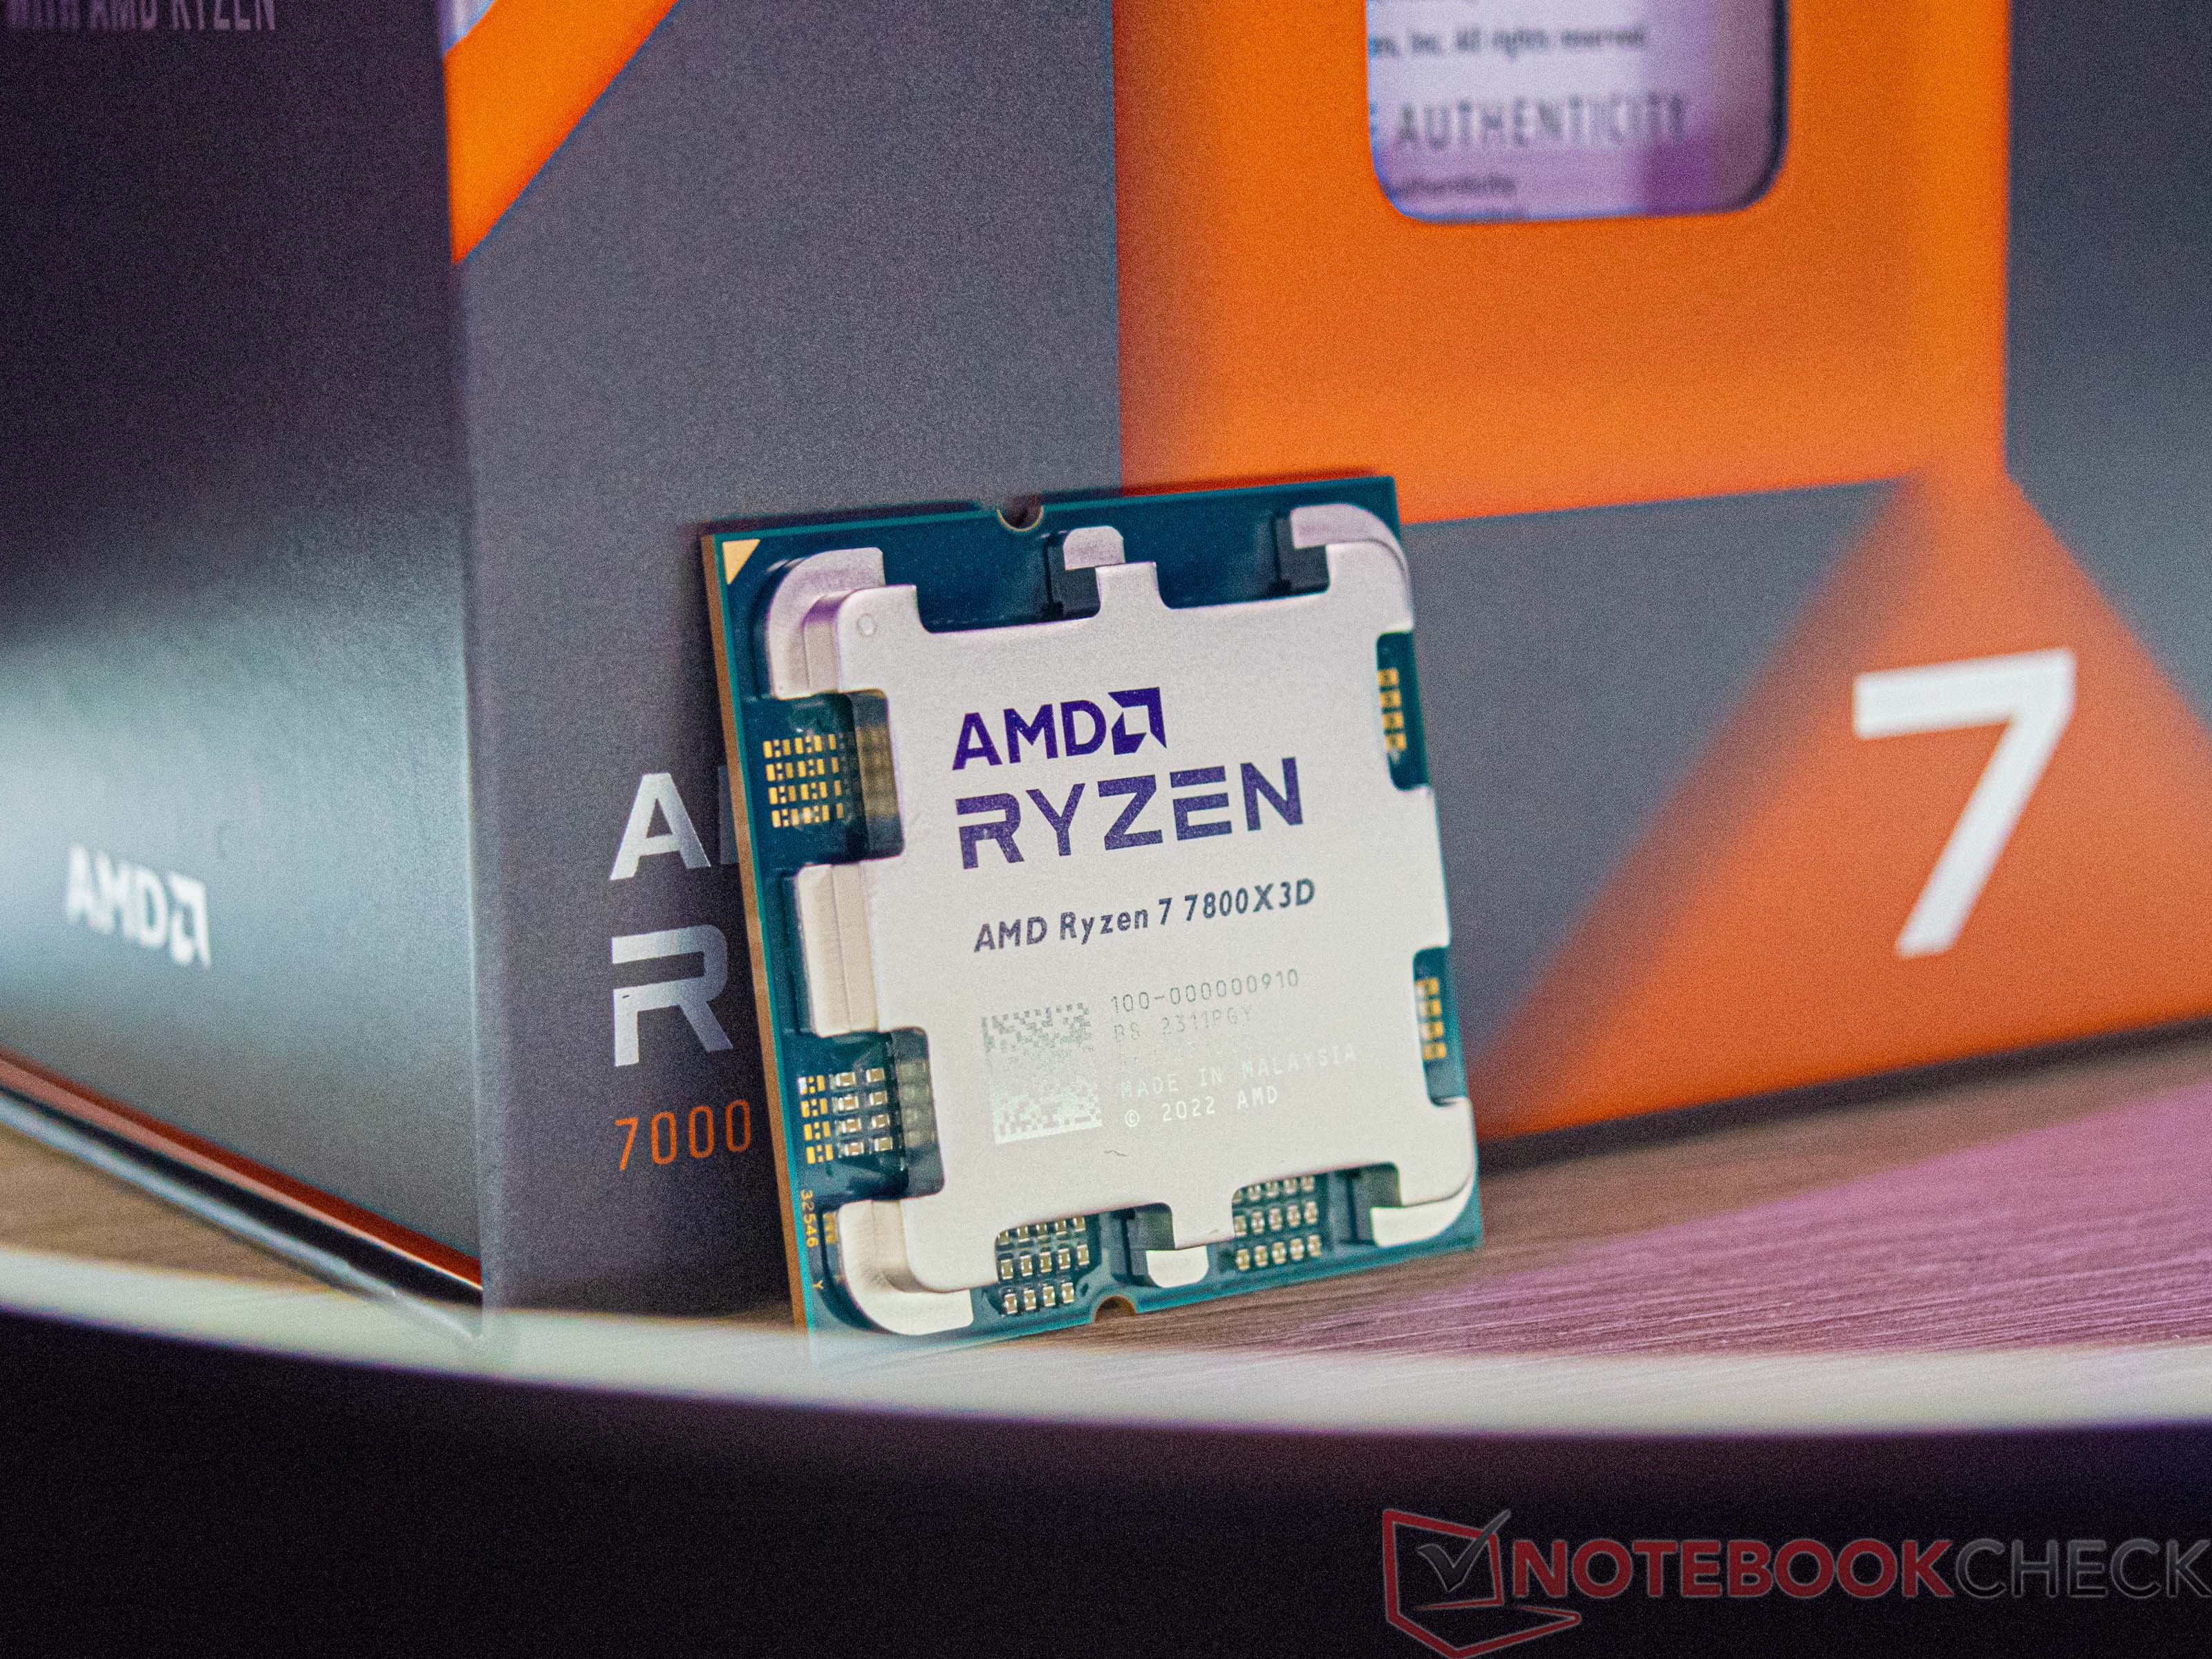
The AMD Ryzen 7 7800X3D is a high-end desktop processor from the Raphael series with 8 Zen 4 cores and SMT (Simultaneous Multithreading), allowing it to handle up to 16 threads simultaneously. After its announcement in January 2023 at CES in Las Vegas, it was launched in April 2023. Following the launch of the two top models, the AMD Ryzen 9 7900X3D and the AMD Ryzen 9 7950X3D, the third model was introduced, which offers significantly more gaming performance with the 3D V-Cache.

The CPU cores have a base clock of 4.2 GHz and can be boosted up to 5 GHz (single-core turbo). The AMD Ryzen 7 7800X3D features a CCD with 8 cores, which includes the fast 3D V-Cache. This differs significantly from the two Ryzen 9 models, as they have two CCDs, but only one of them can utilize the 3D V-Cache.

The performance of the AMD Ryzen 7 7800X3D is consistently good, although its multi-threaded performance suffers a bit due to the eight native compute cores. However, the real strength of the AMD Ryzen 7 7800X3D lies in gaming performance, where it excels. In tests, we see consistently high gaming performance, even surpassing that of an Intel Core i9-13900K.

In terms of power consumption, the AMD Ryzen 7 7800X3D aligns with the other two models featuring 3D V-Cache, making the 8-core processor extremely power-efficient. In numbers, this means that the AMD Ryzen 7 7800X3D is specified with a TDP of up to 120 watts. The PPT (Package Power Tracking) is also rated up to 162 watts. For comparison, an AMD Ryzen 9 7950X is specified with 170 watts (TDP) or 230 watts (PPT).

AMD Ryzen 9 7945HX

► remove from comparison AMD R9 7945HX

The AMD Ryzen 9 7945HX is a fast high-end laptop processor of the Dragon Range series. It offers 16 cores based on the Zen 4 architecture that supports hyperthreading (32 threads). The cores clock from 2.5 (base) up to 5.4 GHz (single core boost). The 7945HX is the fastest mobile Ryzen CPU at launch and derived from the desktop Ryzen 9 7950X.

The Dragon Range series still uses a chiplet design with two CCD-clusters (each with 8 possible cores) in 5nm and an IO-die (including the memory controller and the Radeon 610M iGPU) in 6nm. The chip integrates 4x USB 3.2 Gen2 (10 Gbps) ports (no USB4), 28 PCIe 5.0 lanes (for GPU and SSDs) and a dual-channel DDR5-5200 memory controller.

Performance

The Ryzen 9 7945HX is among the fastest processors in our database, as of August 2023. It is in the same league as the Ryzen 9 7945HX3D and noticeably ahead of the Core i9-13980HX, as far as multi-thread benchmark scores are concerned. It is outrageously, unbelievably fast, and those fortunate enough to purchase a laptop built around this CPU will have no performance issues for at least three years.

Thanks to its powerful cooling solution and a long-term CPU power limit of 128 W, the ROG Strix Scar 17 G733PY-XS96 is one of the fastest laptops built around the 7945HX that we know of.

The R9 7945HX is rated at a TDP of 55 Watt and can be configured up to 75 Watt (cTDP).

ModelAMD Ryzen 9 7945HX3DAMD Ryzen 7 7800X3DAMD Ryzen 9 7945HX
SeriesAMD Dragon Range (Zen 4, Ryzen 7045)AMD Raphael (Zen 4, Ryzen 7000)AMD Dragon Range (Zen 4, Ryzen 7045)
CodenameDragon Range-HX (Zen 4)Raphael (Zen4)Dragon Range-HX (Zen 4)
Series: Dragon Range (Zen 4, Ryzen 7045) Dragon Range-HX (Zen 4)
AMD Ryzen 9 7945HX3D « 2.3 - 5.4 GHz16 / 32 cores128 MB L3
AMD Ryzen 9 7945HX2.5 - 5.4 GHz16 / 32 cores64 MB L3
AMD Ryzen 9 7940HX2.4 - 5.2 GHz16 / 32 cores64 MB L3
AMD Ryzen 9 7845HX3 - 5.2 GHz12 / 24 cores64 MB L3
AMD Ryzen 9 7840HX2.9 - 5.1 GHz12 / 24 cores64 MB L3
AMD Ryzen 9 7950X3D4.2 - 5.7 GHz16 / 32 cores128 MB L3
AMD Ryzen 9 7900X4.7 - 5.6 GHz12 / 24 cores64 MB L3
AMD Ryzen 9 79003.7 - 5.4 GHz12 / 24 cores64 MB L3
AMD Ryzen 7 7700X4.5 - 5.4 GHz8 / 16 cores32 MB L3
AMD Ryzen 7 77003.8 - 5.3 GHz8 / 16 cores32 MB L3
AMD Ryzen 7 7800X3D « 4.2 - 5 GHz8 / 16 cores96 MB L3
AMD Ryzen 5 7600X4.7 - 5.3 GHz6 / 12 cores32 MB L3
AMD Ryzen 5 76003.8 - 5.1 GHz6 / 12 cores32 MB L3
AMD Ryzen 9 7945HX3D2.3 - 5.4 GHz16 / 32 cores128 MB L3
AMD Ryzen 9 7945HX « 2.5 - 5.4 GHz16 / 32 cores64 MB L3
AMD Ryzen 9 7940HX2.4 - 5.2 GHz16 / 32 cores64 MB L3
AMD Ryzen 9 7845HX3 - 5.2 GHz12 / 24 cores64 MB L3
AMD Ryzen 9 7840HX2.9 - 5.1 GHz12 / 24 cores64 MB L3
Clock2300 - 5400 MHz4200 - 5000 MHz2500 - 5400 MHz
L1 Cache1 MB0.1 MB1 MB
L2 Cache16 MB0 MB16 MB
L3 Cache128 MB96 MB64 MB
Cores / Threads16 / 32
16 x 5.4 GHz AMD Zen 4
8 / 1616 / 32
16 x 5.4 GHz AMD Zen 4
TDP55 Watt162 Watt55 Watt
Technology5 nm5 nmCCD = 5 nm, I/O = 6 nm
max. Temp.89 °C89 °C100 °C
SocketFL1AM5 (LGA 1718)FL1
iGPUAMD Radeon 610M (400 - 2200 MHz)AMD Radeon Graphics (Ryzen 7000) (400 - 2200 MHz)AMD Radeon 610M (400 - 2200 MHz)
Architecturex86x86x86
Announced
Manufacturerwww.amd.comwww.amd.com
Transistors6570 Million9900 Million
Die Size1x 71 mm² (CCD) + 121 mm² (I/O) mm2
FeaturesMMX, SSE, SSE2, SSE3, SSSE3, SSE4.1, SSE4.2, SSE4A, x86-64, AMD-V, AES, AVX, AVX2, AVX512, BMI1, BMI2, F16C, FMA3, AMD64, EVP, AMD-V, SMAP, SMEP, SMT SHA, XFR2, Precision Boost 2DDR5-5200 RAM, PCIe 5, MMX, SSE, SSE2, SSE3, SSSE3, SSE4A, SSE4.1, SSE4.2, AVX, AVX2, AVX-512, BMI2, ABM, FMA, ADX, SMEP, SMAP, SMT, CPB, AES-NI, RDRAND, RDSEED, SHA, SME
$449 U.S.

Benchmarks

Performance Rating - CB R15 + R20 + 7-Zip + X265 + Blender + 3DM11 CPU - R9 7945HX3D
57 pt (79%)
Performance Rating - CB R15 + R20 + 7-Zip + X265 + Blender + 3DM11 CPU - R7 7800X3D
48.3 pt (67%)
Performance Rating - CB R15 + R20 + 7-Zip + X265 + Blender + 3DM11 CPU - R9 7945HX
56.8 pt (79%)
Cinebench 2024 - Cinebench 2024 CPU Single Core
115 Points (80%)
114 Points (79%)
Cinebench 2024 - Cinebench 2024 CPU Multi Core
1772 Points (33%)
1695 Points (32%)
Cinebench R23 - Cinebench R23 Multi Core
32782 Points (30%)
min: 16688     avg: 17387     median: 17387 (16%)     max: 18086 Points
min: 32379     avg: 33960     median: 34202 (32%)     max: 34613 Points
Cinebench R23 - Cinebench R23 Single Core
1935 Points (82%)
min: 1713     avg: 1767     median: 1766.5 (75%)     max: 1820 Points
min: 1863     avg: 1912     median: 1936 (82%)     max: 1948 Points
Cinebench R20 - Cinebench R20 CPU (Single Core)
755 Points (84%)
min: 663     avg: 686     median: 686 (76%)     max: 709 Points
min: 712     avg: 738     median: 747 (83%)     max: 756 Points
Cinebench R20 - Cinebench R20 CPU (Multi Core)
13033 Points (32%)
min: 6488     avg: 6805     median: 6804.5 (17%)     max: 7121 Points
min: 10025     avg: 12753     median: 13308 (32%)     max: 13769 Points
Cinebench R15 - Cinebench R15 CPU Multi 64 Bit
5600 Points (35%)
min: 2783     avg: 2879     median: 2878.5 (18%)     max: 2974 Points
min: 5205     avg: 5497     median: 5541 (35%)     max: 5663 Points
Cinebench R15 - Cinebench R15 CPU Single 64 Bit
311 Points (94%)
min: 272     avg: 281.5     median: 281.5 (85%)     max: 291 Points
min: 294     avg: 303.8     median: 307 (92%)     max: 309 Points
Cinebench R11.5 - Cinebench R11.5 CPU Multi 64 Bit
61.9 Points (81%)
33.5 Points (44%)
64.3 Points (84%)
Cinebench R11.5 - Cinebench R11.5 CPU Single 64 Bit
3.7 Points (92%)
3.4 Points (85%)
3.7 Points (91%)
Cinebench R10 - Cinebench R10 Rend. Single (32bit)
8478 Points (51%)
8026 Points (48%)
8481 Points (51%)
Cinebench R10 - Cinebench R10 Rend. Multi (32bit)
70414 Points (51%)
51950 Points (38%)
71582 Points (52%)
Cinebench R10 - Cinebench R10 Rend. Multi (64bit)
94035 Points (65%)
127197 Points (88%)
Cinebench R10 - Cinebench R10 Rend. Single (64bit)
14485 Points (18%)
15601 Points (19%)
wPrime 2.10 - wPrime 2.0 1024m *
249.9 s (3%)
62.7 s (1%)
158.7 s (2%)
wPrime 2.10 - wPrime 2.0 32m *
5.9 s (1%)
2.4 s (0%)
4.9 s (1%)
WinRAR - WinRAR 4.0
51122 Points (81%)
16585 Points (26%)
13822 Points (22%)
7-Zip 18.03 - 7-Zip 18.03 Multli Thread 4 runs
136201 MIPS (78%)
min: 75558     avg: 80313     median: 80312.5 (46%)     max: 85067 MIPS
min: 123364     avg: 136237     median: 140471 (81%)     max: 140932 MIPS
7-Zip 18.03 - 7-Zip 18.03 Single Thread 4 runs
7573 MIPS (91%)
min: 7412     avg: 7824     median: 7823.5 (94%)     max: 8235 MIPS
min: 7319     avg: 7398     median: 7379 (88%)     max: 7581 MIPS
X264 HD Benchmark 4.0 - x264 Pass 2
169.3 fps (59%)
228 fps (80%)
X264 HD Benchmark 4.0 - x264 Pass 1
344 fps (79%)
360.5 fps (83%)
HWBOT x265 Benchmark v2.2 - HWBOT x265 4k Preset
36.4 fps (64%)
min: 22.1     avg: 23.3     median: 23.3 (41%)     max: 24.4 fps
min: 33.8     avg: 35.9     median: 36.2 (64%)     max: 37.6 fps
TrueCrypt - TrueCrypt Serpent
2.5 GB/s (0%)
1.3 GB/s (0%)
2.7 GB/s (0%)
TrueCrypt - TrueCrypt Twofish
3.8 GB/s (66%)
2.1 GB/s (36%)
4 GB/s (69%)
TrueCrypt - TrueCrypt AES
23.4 GB/s (61%)
15.3 GB/s (40%)
25.3 GB/s (66%)
Blender - Blender 3.3 Classroom CPU *
150 Seconds (2%)
min: 266     avg: 282.5     median: 282.5 (4%)     max: 299 Seconds
min: 138     avg: 146.8     median: 145.5 (2%)     max: 158 Seconds
Blender - Blender 2.79 BMW27 CPU *
95 Seconds (1%)
min: 169     avg: 178     median: 178 (1%)     max: 187 Seconds
min: 87     avg: 93.2     median: 93 (1%)     max: 100 Seconds
R Benchmark 2.5 - R Benchmark 2.5 *
0.4 sec (9%)
min: 0.4152     avg: 0.4     median: 0.4 (9%)     max: 0.4479 sec
min: 0.3982     avg: 0.4     median: 0.4 (9%)     max: 0.4159 sec
3DMark 06 - CPU - 3DMark 06 - CPU
16892 Points (36%)
20110 Points (43%)
Super Pi mod 1.5 XS 1M - Super Pi mod 1.5 XS 1M *
6.4 s (1%)
7.1 s (2%)
6.4 s (1%)
Super Pi mod 1.5 XS 2M - Super Pi mod 1.5 XS 2M *
13.9 s (1%)
15.3 s (1%)
13.9 s (1%)
Super Pi Mod 1.5 XS 32M - Super Pi mod 1.5 XS 32M *
337.8 s (2%)
337.6 s (1%)
337 s (1%)
3DMark Vantage - 3DM Vant. Perf. CPU no Physx
97391 Points (85%)
101153 Points (89%)
3DMark 11 - 3DM11 Performance Physics
29707 Points (80%)
min: 30767     avg: 32947     median: 32947 (89%)     max: 35127 Points
min: 24553     avg: 26479     median: 26667 (72%)     max: 27859 Points
3DMark - 3DMark Ice Storm Physics
89617 Points (73%)
84416 Points (69%)
3DMark - 3DMark Ice Storm Extreme Physics
89287 Points (72%)
86844 Points (70%)
3DMark - 3DMark Ice Storm Unlimited Physics
91846 Points (77%)
89010 Points (75%)
3DMark - 3DMark Cloud Gate Physics
25510 Points (65%)
min: 22457     avg: 23170     median: 23169.5 (59%)     max: 23882 Points
3DMark - 3DMark Fire Strike Standard Physics
38826 Points (69%)
min: 30333     avg: 31839     median: 31839 (57%)     max: 33345 Points
min: 35353     avg: 38709     median: 39027 (70%)     max: 42342 Points
3DMark - 3DMark Time Spy CPU
14131 Points (60%)
min: 11975     avg: 13037     median: 13036.5 (55%)     max: 14098 Points
min: 6283     avg: 11710     median: 13082 (55%)     max: 13244 Points
Geekbench 6.2 - Geekbench 6.2 Single-Core
2916 Points (78%)
2634 Points (71%)
2876 Points (77%)
Geekbench 6.2 - Geekbench 6.2 Multi-Core
16957 Points (67%)
14288 Points (56%)
16316 Points (64%)
Geekbench 5.5 - Geekbench 5.1 - 5.4 64 Bit Single-Core
2133 Points (90%)
min: 1856     avg: 1934     median: 1920 (81%)     max: 2027 Points
min: 2047     avg: 2092     median: 2103 (89%)     max: 2132 Points
Geekbench 5.5 - Geekbench 5.1 - 5.4 64 Bit Multi-Core
19875 Points (36%)
min: 12073     avg: 13013     median: 12715 (23%)     max: 14252 Points
min: 18372     avg: 19407     median: 19583 (35%)     max: 19954 Points
Geekbench 5.0 - Geekbench 5.0 64 Bit Single-Core
1938 Points (8%)
1984 Points (9%)
Geekbench 5.0 - Geekbench 5.0 64 Bit Multi-Core
13888 Points (44%)
19315 Points (61%)
Geekbench 4.4 - Geekbench 4.1 - 4.4 64 Bit Single-Core
9097 Points (91%)
8534 Points (85%)
Geekbench 4.4 - Geekbench 4.1 - 4.4 64 Bit Multi-Core
54840 Points (60%)
75652 Points (83%)
Mozilla Kraken 1.1 - Kraken 1.1 Total Score *
421.3 ms (0%)
min: 487     avg: 504     median: 503.5 (1%)     max: 520 ms
min: 449     avg: 460.5     median: 457 (1%)     max: 479 ms
Octane V2 - Octane V2 Total Score
97066 Points (85%)
min: 92275     avg: 95873     median: 95872.5 (84%)     max: 99470 Points
WebXPRT 4 - WebXPRT 4 Score
328 Points (94%)
282 Points (81%)
min: 283     avg: 289     median: 289 (83%)     max: 295 Points
WebXPRT 3 - WebXPRT 3 Score
480 Points (100%)
353 Points (74%)
min: 314     avg: 350.8     median: 351 (73%)     max: 387 Points
CrossMark - CrossMark Overall
2086 Points (80%)
2216 Points (85%)
min: 1929     avg: 2009     median: 2015 (77%)     max: 2078 Points
Power Consumption - Prime95 Power Consumption - external Monitor *
157.2 Watt (27%)
218 Watt (38%)
min: 136.4     avg: 184.3     median: 187.9 (32%)     max: 225 Watt
Power Consumption - Cinebench R15 Multi Power Consumption - external Monitor *
187.3 Watt (34%)
207 Watt (38%)
min: 164.4     avg: 193.4     median: 194.2 (35%)     max: 221 Watt
Power Consumption - Idle Power Consumption - external Monitor *
28.9 Watt (19%)
121.6 Watt (80%)
min: 13.9     avg: 30     median: 27.7 (18%)     max: 50.5 Watt
Power Consumption - Idle Power Consumption 150cd 1min *
17.2 Watt (19%)
min: 17.1     avg: 24.5     median: 23.8 (26%)     max: 33.2 Watt
Power Consumption - Cinebench R15 Multi Power Efficiency - external Monitor
29.9 Points per Watt (22%)
14.4 Points per Watt (11%)
min: 25.1     avg: 27.4     median: 27.3 (20%)     max: 29.8 Points per Watt

Average Benchmarks AMD Ryzen 9 7945HX3D → 100% n=36

Average Benchmarks AMD Ryzen 7 7800X3D → 82% n=36

Average Benchmarks AMD Ryzen 9 7945HX → 97% n=36

- Range of benchmark values for this graphics card
- Average benchmark values for this graphics card
* Smaller numbers mean a higher performance
1 This benchmark is not used for the average calculation

v1.28
log 04. 00:29:00

#0 checking url part for id 15073 +0s ... 0s

#1 checking url part for id 15064 +0s ... 0s

#2 checking url part for id 14936 +0s ... 0s

#3 redirected to Ajax server, took 1720045740 +0s ... 0s

#4 did not recreate cache, as it is less than 5 days old! Created at Mon, 01 Jul 2024 05:15:43 +0200 +0s ... 0s

#5 composed specs +0.007s ... 0.007s

#6 did output specs +0s ... 0.007s

#7 getting avg benchmarks for device 15073 +0.003s ... 0.01s

#8 got single benchmarks 15073 +0.004s ... 0.014s

#9 getting avg benchmarks for device 15064 +0.004s ... 0.018s

#10 got single benchmarks 15064 +0.005s ... 0.023s

#11 getting avg benchmarks for device 14936 +0.003s ... 0.026s

#12 got single benchmarks 14936 +0.011s ... 0.037s

#13 got avg benchmarks for devices +0s ... 0.037s

#14 No cached benchmark found, getting uncached values +0.001s ... 0.038s

#15 No cached benchmark found, getting uncached values +0.001s ... 0.039s

#16 No cached benchmark found, getting uncached values +0.015s ... 0.054s

#17 No cached benchmark found, getting uncached values +0.001s ... 0.055s

#18 No cached benchmark found, getting uncached values +0.004s ... 0.059s

#19 No cached benchmark found, getting uncached values +0.003s ... 0.062s

#20 No cached benchmark found, getting uncached values +0.001s ... 0.063s

#21 No cached benchmark found, getting uncached values +0.012s ... 0.075s

#22 No cached benchmark found, getting uncached values +0.009s ... 0.084s

#23 No cached benchmark found, getting uncached values +0.001s ... 0.085s

#24 No cached benchmark found, getting uncached values +0.012s ... 0.096s

#25 No cached benchmark found, getting uncached values +0.001s ... 0.097s

#26 min, max, avg, median took s +0.013s ... 0.111s

#27 return log +0s ... 0.111s

Please share our article, every link counts!
> Expert Reviews and News on Laptops, Smartphones and Tech Innovations > Benchmarks / Tech > Processor Comparison - Head 2 Head
Redaktion, 2017-09- 8 (Update: 2023-07- 1)