Notebookcheck Logo

AMD Ryzen 9 7945HX3D vs AMD Ryzen 5 7600X vs AMD Ryzen 7 7700X

AMD Ryzen 9 7945HX3D

► remove from comparison AMD R9 7945HX3D

The AMD Ryzen 9 7945HX3D is a fast high-end laptop processor of the Dragon Range series. It offers 16 cores based on the Zen 4 architecture that supports hyperthreading (32 threads). The cores clock from 2.3 (base) up to 5.4 GHz (single core boost). Compared to the similar R9 7945HX, the 7945HX3D offers an additional 64 MB 3D V-Cache on one CCD-Cluster. This helps in some workloads that can use the additional fast cache (e.g. some games). The guaranteed base clock however was reduced from 2.5 to 2.3 GHz.

The performance of the R9 7945HX3D is similar to the R9 7945HX in workloads that wont make use of the bigger L3 cache. Most games however can use the additional memory. AMD e.g. was advertising the HX3D with 4% to 53% higher performance in 1080p high settings.

The Dragon Range series still uses a chiplet design with two CCD-clusters (each with 8 possible cores) in 5nm and an IO-die (including the memory controller and the Radeon 610M iGPU) in 6nm. The chip integrates 4x USB 3.2 Gen2 (10 Gbps) ports (no USB4), 28 PCIe 5.0 lanes (for GPU and SSDs) and a dual-channel DDR5-5200 memory controller.

The R9 7945HX3D is rated at a TDP of 55 Watt and can be configured up to 75 Watt (cTDP).

AMD Ryzen 5 7600X

► remove from comparison AMD R5 7600X

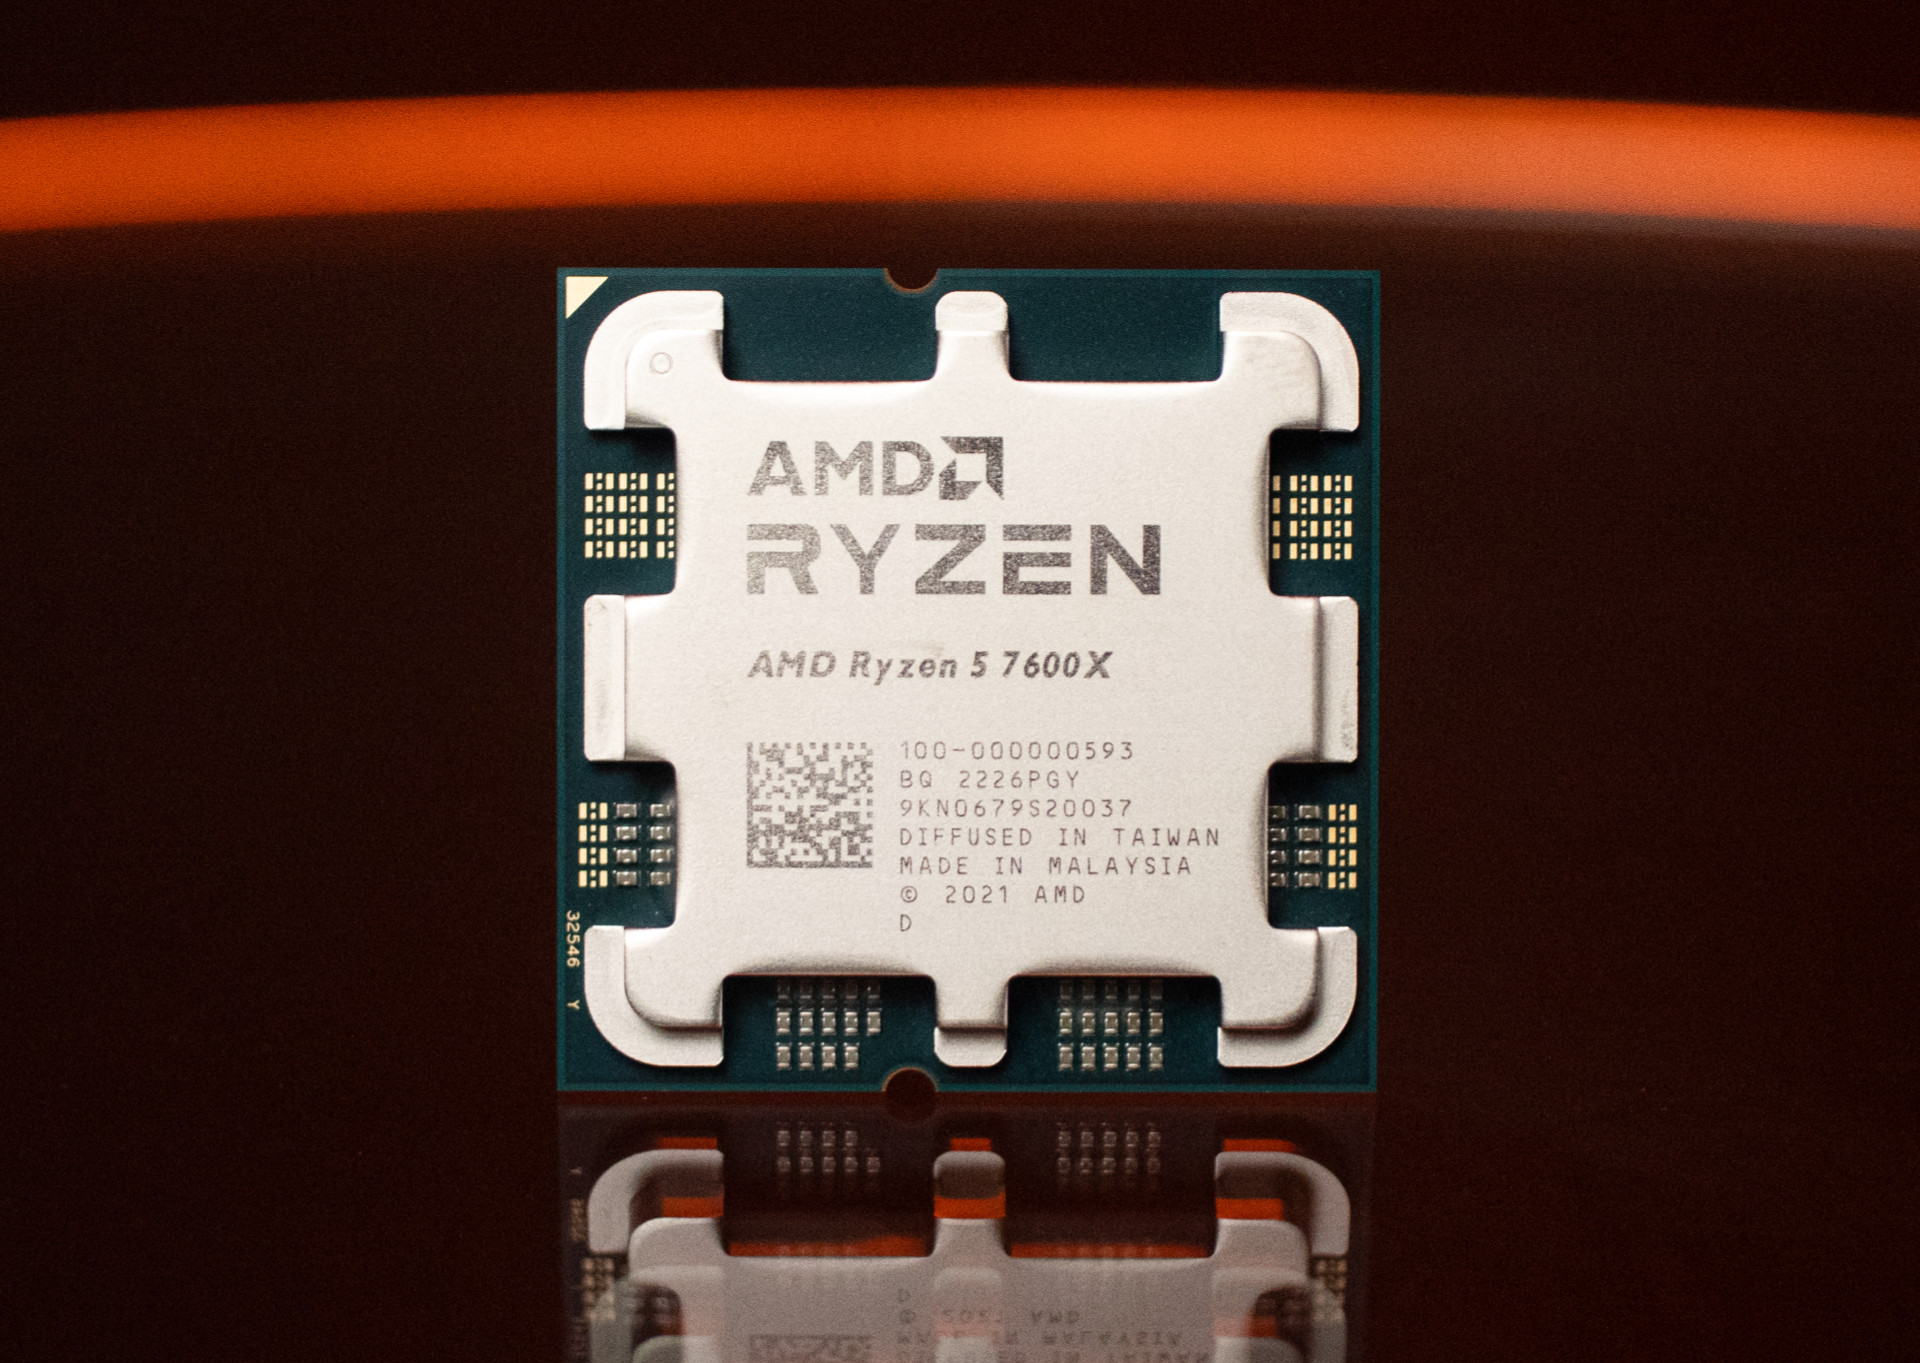
The AMD Ryzen 5 7600X is a fast mid-range desktop processor of the Raphael series. It offers 6 cores based on the Zen 4 architecture that supports hyperthreading (12 threads). The cores clock from 4.7 (base) up to 5.7 GHz (single core boost). When all 6 cores are fully loaded, 5.3 GHz is the max. clock speed. 

The performance of the R5 7600X is clearly better than the old Ryzen 5 5600X thanks to the improved architecture and modern 5nm process. The single core performance is very good thanks to the high turbo clock speed (-400 MHz compared to the high end CPUs like the Ryzen 9 7950X). The multi-threaded performance is of course not that competitive due to only 6 cores.

The Raphael series still uses a chiplet design with two CCD-clusters (each with 8 possible cores) in 5nm and an IO-die (including the memory controller and the Radeon Graphics iGPU) in 6nm.

The R5 7600X is rated 105 Watt TDP and Raphael is rather power hungry compared to the 5000 series.

AMD Ryzen 7 7700X

► remove from comparison AMD R7 7700X

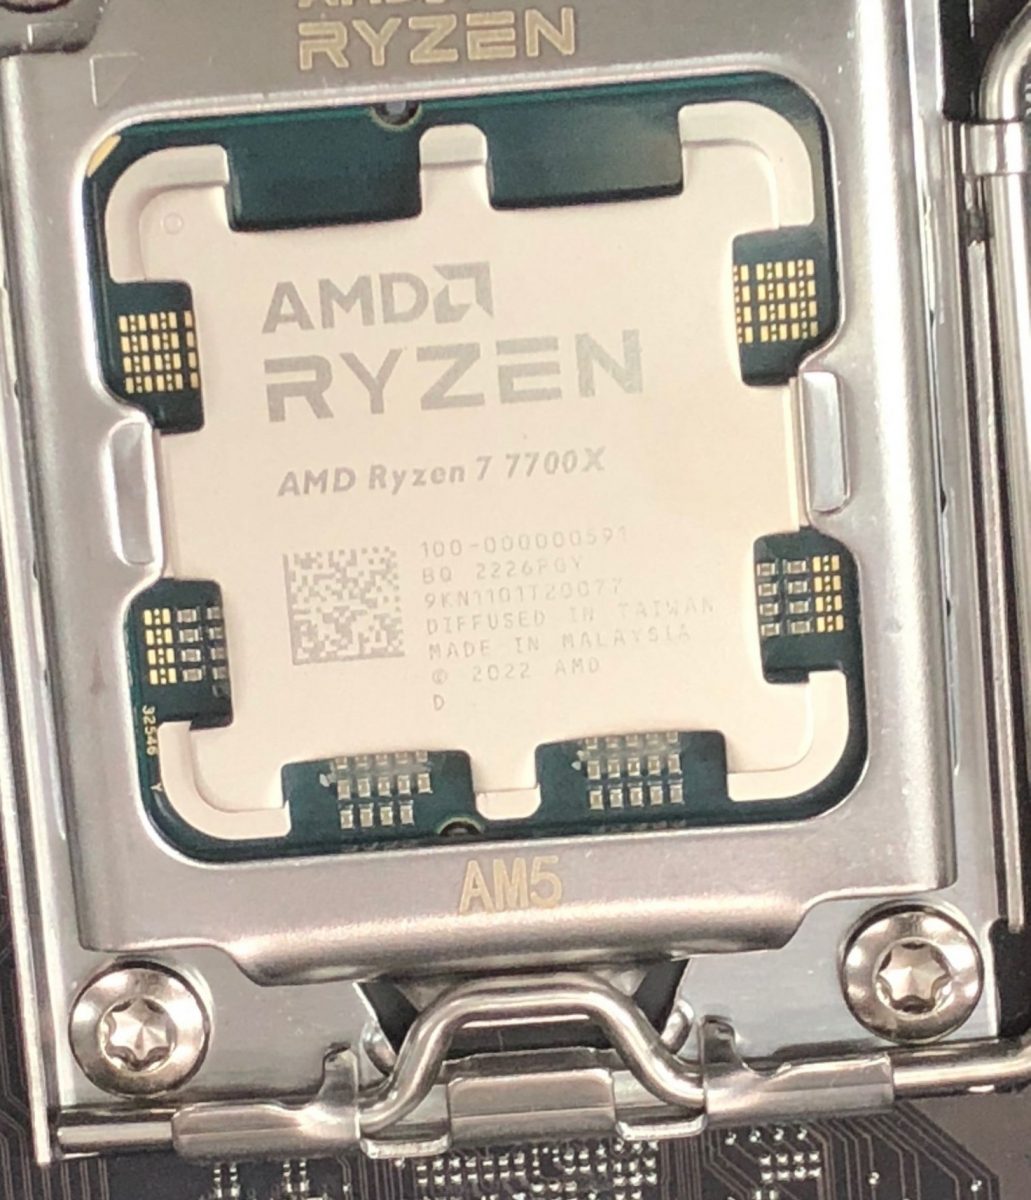
The AMD Ryzen 7 7700X is a fast high-end desktop processor of the Raphael series. It offers 8 cores based on the Zen 4 architecture that supports hyperthreading (16 threads). The cores clock from 4.5 (base) up to 5.4 GHz (single core boost). Compared to the faster Ryzen 9 CPUs (like the 7900X), the R7 offers less cores and slightly lower clock speeds.

The performance of the R7 7700X is clearly better than the old Ryzen 7 of the 5000 generation thanks to the improved architecture and modern 5nm process. Compared to Intels Alder Lake Core i7-12900K the performance is quite similar but stays behind the newer Rocket Lake i5-13600K (multi-threaded).

The Raphael series still uses a chiplet design with two CCD-clusters (each with 8 possible cores, so only one used for the 7700X) in 5nm and an IO-die (including the memory controller and the Radeon Graphics iGPU) in 6nm.

ModelAMD Ryzen 9 7945HX3DAMD Ryzen 5 7600XAMD Ryzen 7 7700X
SeriesAMD Dragon Range (Zen 4, Ryzen 7045)AMD Raphael (Zen 4, Ryzen 7000)AMD Raphael (Zen 4, Ryzen 7000)
CodenameDragon Range-HX (Zen 4)Raphael (Zen4)Raphael (Zen4)
Series: Raphael (Zen 4, Ryzen 7000) Raphael (Zen4)
AMD Ryzen 9 7945HX3D « 2.3 - 5.4 GHz16 / 32 cores128 MB L3
AMD Ryzen 9 7945HX2.5 - 5.4 GHz16 / 32 cores64 MB L3
AMD Ryzen 9 7940HX2.4 - 5.2 GHz16 / 32 cores64 MB L3
AMD Ryzen 9 7845HX3 - 5.2 GHz12 / 24 cores64 MB L3
AMD Ryzen 9 7840HX2.9 - 5.1 GHz12 / 24 cores64 MB L3
AMD Ryzen 9 7950X3D4.2 - 5.7 GHz16 / 32 cores128 MB L3
AMD Ryzen 9 7900X4.7 - 5.6 GHz12 / 24 cores64 MB L3
AMD Ryzen 9 79003.7 - 5.4 GHz12 / 24 cores64 MB L3
AMD Ryzen 7 7700X4.5 - 5.4 GHz8 / 16 cores32 MB L3
AMD Ryzen 7 77003.8 - 5.3 GHz8 / 16 cores32 MB L3
AMD Ryzen 7 7800X3D4.2 - 5 GHz8 / 16 cores96 MB L3
AMD Ryzen 5 7600X « 4.7 - 5.3 GHz6 / 12 cores32 MB L3
AMD Ryzen 5 76003.8 - 5.1 GHz6 / 12 cores32 MB L3
AMD Ryzen 9 7950X3D4.2 - 5.7 GHz16 / 32 cores128 MB L3
AMD Ryzen 9 7900X4.7 - 5.6 GHz12 / 24 cores64 MB L3
AMD Ryzen 9 79003.7 - 5.4 GHz12 / 24 cores64 MB L3
AMD Ryzen 7 7700X « 4.5 - 5.4 GHz8 / 16 cores32 MB L3
AMD Ryzen 7 77003.8 - 5.3 GHz8 / 16 cores32 MB L3
AMD Ryzen 7 7800X3D4.2 - 5 GHz8 / 16 cores96 MB L3
AMD Ryzen 5 7600X4.7 - 5.3 GHz6 / 12 cores32 MB L3
AMD Ryzen 5 76003.8 - 5.1 GHz6 / 12 cores32 MB L3
Clock2300 - 5400 MHz4700 - 5300 MHz4500 - 5400 MHz
L1 Cache1 MB384 KB512 KB
L2 Cache16 MB6 MB8 MB
L3 Cache128 MB32 MB32 MB
Cores / Threads16 / 32
16 x 5.4 GHz AMD Zen 4
6 / 128 / 16
TDP55 Watt105 Watt170 Watt
5 nm5 nm, 0.650 - 1.475V5 nm, 0.650 - 1.475V
max. Temp.89 °C95 °C95 °C
SocketFL1AM5 (LGA 1718)AM5 (LGA 1718)
iGPUAMD Radeon 610M (400 - 2200 MHz)AMD Radeon Graphics (Ryzen 7000) (400 - 2200 MHz)AMD Radeon Graphics (Ryzen 7000) (400 - 2200 MHz)
Architecturex86x86x86
Announced
Manufacturerwww.amd.comwww.amd.comwww.amd.com
TransistorsCCD: 6,5 Mrd + IOD: 3,4 Mrd Million9.9 Million
Die Size1x 70 (CCD) mm2 + 122 (I/O) mm22x 70 (CCD) mm2 + 122 (I/O) mm2
FeaturesMMX(+), SSE, SSE2, SSE3, SSSE3, SSE4.1, SSE4.2, SSE4A, x86-64, AMD-V, AES, AVX, AVX2, AVX512F, FMA3, SHA, Precision Boost 2MMX(+), SSE, SSE2, SSE3, SSSE3, SSE4.1, SSE4.2, SSE4A, x86-64, AMD-V, AES, AVX, AVX2, AVX512F, FMA3, SHA, Precision Boost 2

Benchmarks

Performance Rating - CB R15 + R20 + 7-Zip + X265 + Blender + 3DM11 CPU - R9 7945HX3D
57 pt (79%)
Performance Rating - CB R15 + R20 + 7-Zip + X265 + Blender + 3DM11 CPU - R5 7600X
49.4 pt (69%)
Performance Rating - CB R15 + R20 + 7-Zip + X265 + Blender + 3DM11 CPU - R7 7700X
51.5 pt (71%)
Cinebench 2024 - Cinebench 2024 CPU Single Core
115 Points (80%)
Cinebench 2024 - Cinebench 2024 CPU Multi Core
1772 Points (33%)
Cinebench R23 - Cinebench R23 Multi Core
32782 Points (30%)
min: 15006     avg: 15252     median: 15236 (14%)     max: 15510 Points
min: 18667     avg: 19088     median: 19088 (18%)     max: 19509 Points
Cinebench R23 - Cinebench R23 Single Core
1935 Points (82%)
min: 1953     avg: 1964     median: 1965 (84%)     max: 1967 Points
min: 1986     avg: 1987     median: 1987 (85%)     max: 1988 Points
Cinebench R20 - Cinebench R20 CPU (Single Core)
755 Points (84%)
min: 759     avg: 761     median: 761 (85%)     max: 764 Points
min: 772     avg: 773     median: 772.5 (86%)     max: 773 Points
Cinebench R20 - Cinebench R20 CPU (Multi Core)
13033 Points (32%)
min: 5882     avg: 5973     median: 5966 (15%)     max: 6076 Points
min: 7308     avg: 7463     median: 7462.5 (18%)     max: 7617 Points
Cinebench R15 - Cinebench R15 CPU Multi 64 Bit
5600 Points (35%)
min: 2434     avg: 2504     median: 2517 (16%)     max: 2536 Points
min: 3036     avg: 3114     median: 3113.5 (20%)     max: 3191 Points
Cinebench R15 - Cinebench R15 CPU Single 64 Bit
311 Points (94%)
min: 311     avg: 313.7     median: 314 (95%)     max: 315 Points
min: 314     avg: 315     median: 315 (95%)     max: 316 Points
Cinebench R11.5 - Cinebench R11.5 CPU Multi 64 Bit
61.9 Points (81%)
min: 27.79     avg: 28.3     median: 28.3 (37%)     max: 28.69 Points
36.1 Points (47%)
Cinebench R11.5 - Cinebench R11.5 CPU Single 64 Bit
3.7 Points (92%)
min: 3.68     avg: 3.7     median: 3.7 (92%)     max: 3.72 Points
3.7 Points (92%)
Cinebench R10 - Cinebench R10 Rend. Single (32bit)
8478 Points (51%)
min: 8212     avg: 8455     median: 8480 (51%)     max: 8631 Points
8633 Points (52%)
Cinebench R10 - Cinebench R10 Rend. Multi (32bit)
70414 Points (51%)
min: 48381     avg: 49427     median: 49430 (36%)     max: 49837 Points
56024 Points (41%)
Cinebench R10 - Cinebench R10 Rend. Multi (64bit)
min: 88546     avg: 90010     median: 90309 (63%)     max: 91222 Points
Cinebench R10 - Cinebench R10 Rend. Single (64bit)
min: 15797     avg: 15925     median: 15948 (19%)     max: 16010 Points
wPrime 2.10 - wPrime 2.0 1024m *
249.9 s (3%)
min: 74.491     avg: 78.5     median: 78.8 (1%)     max: 82.19 s
61.1 s (1%)
wPrime 2.10 - wPrime 2.0 32m *
5.9 s (1%)
min: 2.709     avg: 2.8     median: 2.8 (1%)     max: 2.933 s
2.2 s (0%)
WinRAR - WinRAR 4.0
51122 Points (81%)
16178 Points (26%)
14879 Points (24%)
7-Zip 18.03 - 7-Zip 18.03 Multli Thread 4 runs
136201 MIPS (78%)
min: 65569     avg: 68816     median: 69291 (40%)     max: 70615 MIPS
min: 85624     avg: 85707     median: 85706.5 (49%)     max: 85789 MIPS
7-Zip 18.03 - 7-Zip 18.03 Single Thread 4 runs
7573 MIPS (91%)
min: 7661     avg: 7993     median: 8058 (96%)     max: 8101 MIPS
min: 8052     avg: 8074     median: 8074 (97%)     max: 8096 MIPS
X264 HD Benchmark 4.0 - x264 Pass 2
147.8 fps (52%)
181.2 fps (63%)
X264 HD Benchmark 4.0 - x264 Pass 1
367 fps (85%)
373.5 fps (86%)
HWBOT x265 Benchmark v2.2 - HWBOT x265 4k Preset
36.4 fps (64%)
min: 20.2     avg: 20.9     median: 21 (37%)     max: 21.4 fps
min: 24.8     avg: 25.5     median: 25.5 (45%)     max: 26.1 fps
TrueCrypt - TrueCrypt Serpent
2.5 GB/s (0%)
1.1 GB/s (0%)
1.4 GB/s (0%)
TrueCrypt - TrueCrypt Twofish
3.8 GB/s (66%)
1.8 GB/s (31%)
2.3 GB/s (40%)
TrueCrypt - TrueCrypt AES
23.4 GB/s (61%)
13.2 GB/s (34%)
17.5 GB/s (46%)
Blender - Blender 3.3 Classroom CPU *
150 Seconds (2%)
min: 322     avg: 329.6     median: 328 (4%)     max: 344 Seconds
min: 255     avg: 261     median: 261 (3%)     max: 267 Seconds
Blender - Blender 2.79 BMW27 CPU *
95 Seconds (1%)
min: 202     avg: 206.1     median: 205 (1%)     max: 214 Seconds
min: 160     avg: 163     median: 163 (1%)     max: 166 Seconds
R Benchmark 2.5 - R Benchmark 2.5 *
0.4 sec (9%)
min: 0.3726     avg: 0.4     median: 0.4 (8%)     max: 0.395 sec
min: 0.3758     avg: 0.4     median: 0.4 (8%)     max: 0.383 sec
3DMark 06 - CPU - 3DMark 06 - CPU
min: 16979     avg: 17291     median: 17290.5 (37%)     max: 17602 Points
18115 Points (39%)
Super Pi mod 1.5 XS 1M - Super Pi mod 1.5 XS 1M *
6.4 s (1%)
7.4 s (2%)
6.3 s (1%)
Super Pi mod 1.5 XS 2M - Super Pi mod 1.5 XS 2M *
13.9 s (1%)
16 s (1%)
13.6 s (1%)
Super Pi Mod 1.5 XS 32M - Super Pi mod 1.5 XS 32M *
337.8 s (2%)
367.1 s (2%)
322.8 s (1%)
3DMark Vantage - 3DM Vant. Perf. CPU no Physx
min: 82479     avg: 83000     median: 82999.5 (73%)     max: 83520 Points
3DMark 11 - 3DM11 Performance Physics
29707 Points (80%)
min: 25396     avg: 25731     median: 25731 (70%)     max: 26066 Points
31467 Points (85%)
3DMark - 3DMark Ice Storm Physics
min: 92244     avg: 98319     median: 98318.5 (80%)     max: 104393 Points
3DMark - 3DMark Ice Storm Extreme Physics
min: 92907     avg: 98466     median: 98466 (80%)     max: 104025 Points
3DMark - 3DMark Ice Storm Unlimited Physics
min: 94868     avg: 99772     median: 99772 (84%)     max: 104676 Points
3DMark - 3DMark Cloud Gate Physics
min: 19327     avg: 19377     median: 19377 (49%)     max: 19427 Points
3DMark - 3DMark Fire Strike Standard Physics
38826 Points (69%)
min: 30671     avg: 30681     median: 30681 (55%)     max: 30691 Points
35357 Points (63%)
3DMark - 3DMark Time Spy CPU
14131 Points (60%)
min: 10458     avg: 10645     median: 10645 (45%)     max: 10832 Points
14182 Points (60%)
Geekbench 6.2 - Geekbench 6.2 Single-Core
2916 Points (78%)
Geekbench 6.2 - Geekbench 6.2 Multi-Core
16957 Points (67%)
Geekbench 5.5 - Geekbench 5.1 - 5.4 64 Bit Single-Core
2133 Points (90%)
min: 2159     avg: 2212     median: 2217 (94%)     max: 2230 Points
2218 Points (94%)
Geekbench 5.5 - Geekbench 5.1 - 5.4 64 Bit Multi-Core
19875 Points (36%)
min: 11093     avg: 11914     median: 12003 (22%)     max: 12185 Points
min: 13889     avg: 14131     median: 14131 (25%)     max: 14373 Points
Geekbench 5.0 - Geekbench 5.0 64 Bit Single-Core
min: 2070     avg: 2120     median: 2126 (9%)     max: 2137 Points
2123 Points (9%)
Geekbench 5.0 - Geekbench 5.0 64 Bit Multi-Core
min: 11123     avg: 11886     median: 11982 (38%)     max: 12112 Points
14215 Points (45%)
Geekbench 4.4 - Geekbench 4.1 - 4.4 64 Bit Single-Core
min: 8596     avg: 8967     median: 9021 (90%)     max: 9048 Points
8991 Points (90%)
Geekbench 4.4 - Geekbench 4.1 - 4.4 64 Bit Multi-Core
min: 45422     avg: 47461     median: 47694 (52%)     max: 48205 Points
56909 Points (62%)
Mozilla Kraken 1.1 - Kraken 1.1 Total Score *
421.3 ms (0%)
min: 441     avg: 447.8     median: 448 (1%)     max: 451 ms
440 ms (1%)
Octane V2 - Octane V2 Total Score
97066 Points (85%)
WebXPRT 4 - WebXPRT 4 Score
328 Points (94%)
min: 295     avg: 298.3     median: 298 (86%)     max: 302 Points
301 Points (86%)
WebXPRT 3 - WebXPRT 3 Score
480 Points (100%)
min: 356     avg: 373.3     median: 370.5 (77%)     max: 395 Points
355 Points (74%)
CrossMark - CrossMark Overall
2086 Points (80%)
min: 2104     avg: 2186     median: 2193 (84%)     max: 2256 Points
min: 2297     avg: 2313     median: 2312.5 (89%)     max: 2328 Points
Power Consumption - Prime95 Power Consumption - external Monitor *
157.2 Watt (27%)
227 Watt (39%)
min: 189.8     avg: 209.9     median: 209.9 (36%)     max: 230 Watt
Power Consumption - Cinebench R15 Multi Power Consumption - external Monitor *
187.3 Watt (34%)
215 Watt (39%)
min: 196.1     avg: 218.1     median: 218.1 (40%)     max: 240 Watt
Power Consumption - Idle Power Consumption - external Monitor *
28.9 Watt (19%)
91.5 Watt (61%)
min: 89.8     avg: 94     median: 94 (62%)     max: 98.2 Watt
Power Consumption - Idle Power Consumption 150cd 1min *
17.2 Watt (19%)
Power Consumption - Cinebench R15 Multi Power Efficiency - external Monitor
29.9 Points per Watt (22%)
11.7 Points per Watt (9%)
min: 13.3     avg: 14.4     median: 14.4 (11%)     max: 15.5 Points per Watt

Average Benchmarks AMD Ryzen 9 7945HX3D → 100% n=34

Average Benchmarks AMD Ryzen 5 7600X → 80% n=34

Average Benchmarks AMD Ryzen 7 7700X → 86% n=34

- Range of benchmark values for this graphics card
- Average benchmark values for this graphics card
* Smaller numbers mean a higher performance
1 This benchmark is not used for the average calculation

v1.28
log 03. 22:44:54

#0 checking url part for id 15073 +0s ... 0s

#1 checking url part for id 14615 +0s ... 0s

#2 checking url part for id 14655 +0s ... 0s

#3 redirected to Ajax server, took 1720039493 +0s ... 0s

#4 did not recreate cache, as it is less than 5 days old! Created at Mon, 01 Jul 2024 05:15:43 +0200 +0s ... 0s

#5 composed specs +0.007s ... 0.007s

#6 did output specs +0s ... 0.007s

#7 getting avg benchmarks for device 15073 +0.003s ... 0.011s

#8 got single benchmarks 15073 +0.005s ... 0.015s

#9 getting avg benchmarks for device 14615 +0.003s ... 0.019s

#10 got single benchmarks 14615 +0.003s ... 0.021s

#11 getting avg benchmarks for device 14655 +0.003s ... 0.025s

#12 got single benchmarks 14655 +0.004s ... 0.028s

#13 got avg benchmarks for devices +0s ... 0.028s

#14 min, max, avg, median took s +0.059s ... 0.087s

#15 return log +0s ... 0.087s

Please share our article, every link counts!
> Expert Reviews and News on Laptops, Smartphones and Tech Innovations > Benchmarks / Tech > Processor Comparison - Head 2 Head
Redaktion, 2017-09- 8 (Update: 2023-07- 1)