Notebookcheck Logo

AMD Ryzen 9 5900X vs AMD Ryzen 9 7950X3D

AMD Ryzen 9 5900X

► remove from comparison AMD R9 5900X

The AMD Ryzen 9 5900X is a high-end 12-core, hyperthreaded (SMT) Vermeer series desktop processor that can process 24 threads simultaneously. Introduced on October 8, 2020, the Ryzen 9 5900X is the fastest 12-core processor and is specified at 105 watts TDP. The top model, the AMD Ryzen 9 5950X, offers even more power and at the same time offers another 4 cores and 8 threads. 

The Ryzen 9 5900X clocks with 3.7 GHz base clock and reaches up to 4.8 GHz on one core in turbo mode. However, when all 12 cores are loaded, up to 4.5 GHz is still possible.

The performance of the AMD Ryzen 9 5900X is consistently excellent in all applications and significantly better than the AMD Ryzen 9 3900X. AMD has been able to significantly improve its single thread performance in particular and even beats the Intel Core i9-10900K in this discipline. The multi-thread performance could also be improved. In an in-house duel, the AMD Ryzen 9 5900X can even take on an AMD Threadripper 2950X.

The internal structure of the processor has not changed fundamentally at first glance. The CCX structure has changed a bit compared to Zen2, because now a CCX consists of up to 8 CPU cores. So each individual core can access the complete L3 cache (32 MByte). Furthermore the CCX modules are connected to each other via the same I/O die, which we already know from Zen2. According to AMD, the Infinity-Fabric should now reach clock rates of up to 2 GHz, which in turn allows a RAM clock of 4.000 MHz without performance loss.

For the manufacturing processes, AMD also relies on TSCM for the Vermeer processors for the 7nm production of the CPU cores, although the I/O die is still supplied in 12nm by Globalfoundries. 

In games, the AMD Ryzen 9 5900X is convincing thanks to the significantly improved IPC. With the AMD Ryzen 9 5900X, streaming can be done simultaneously with gaming. But if you only want to play games, you are well advised to take a closer look at the AMD Ryzen 7 5800X or the AMD Ryzen 5 5600X.

AMD Ryzen 9 7950X3D

► remove from comparison AMD R9 7950X3D

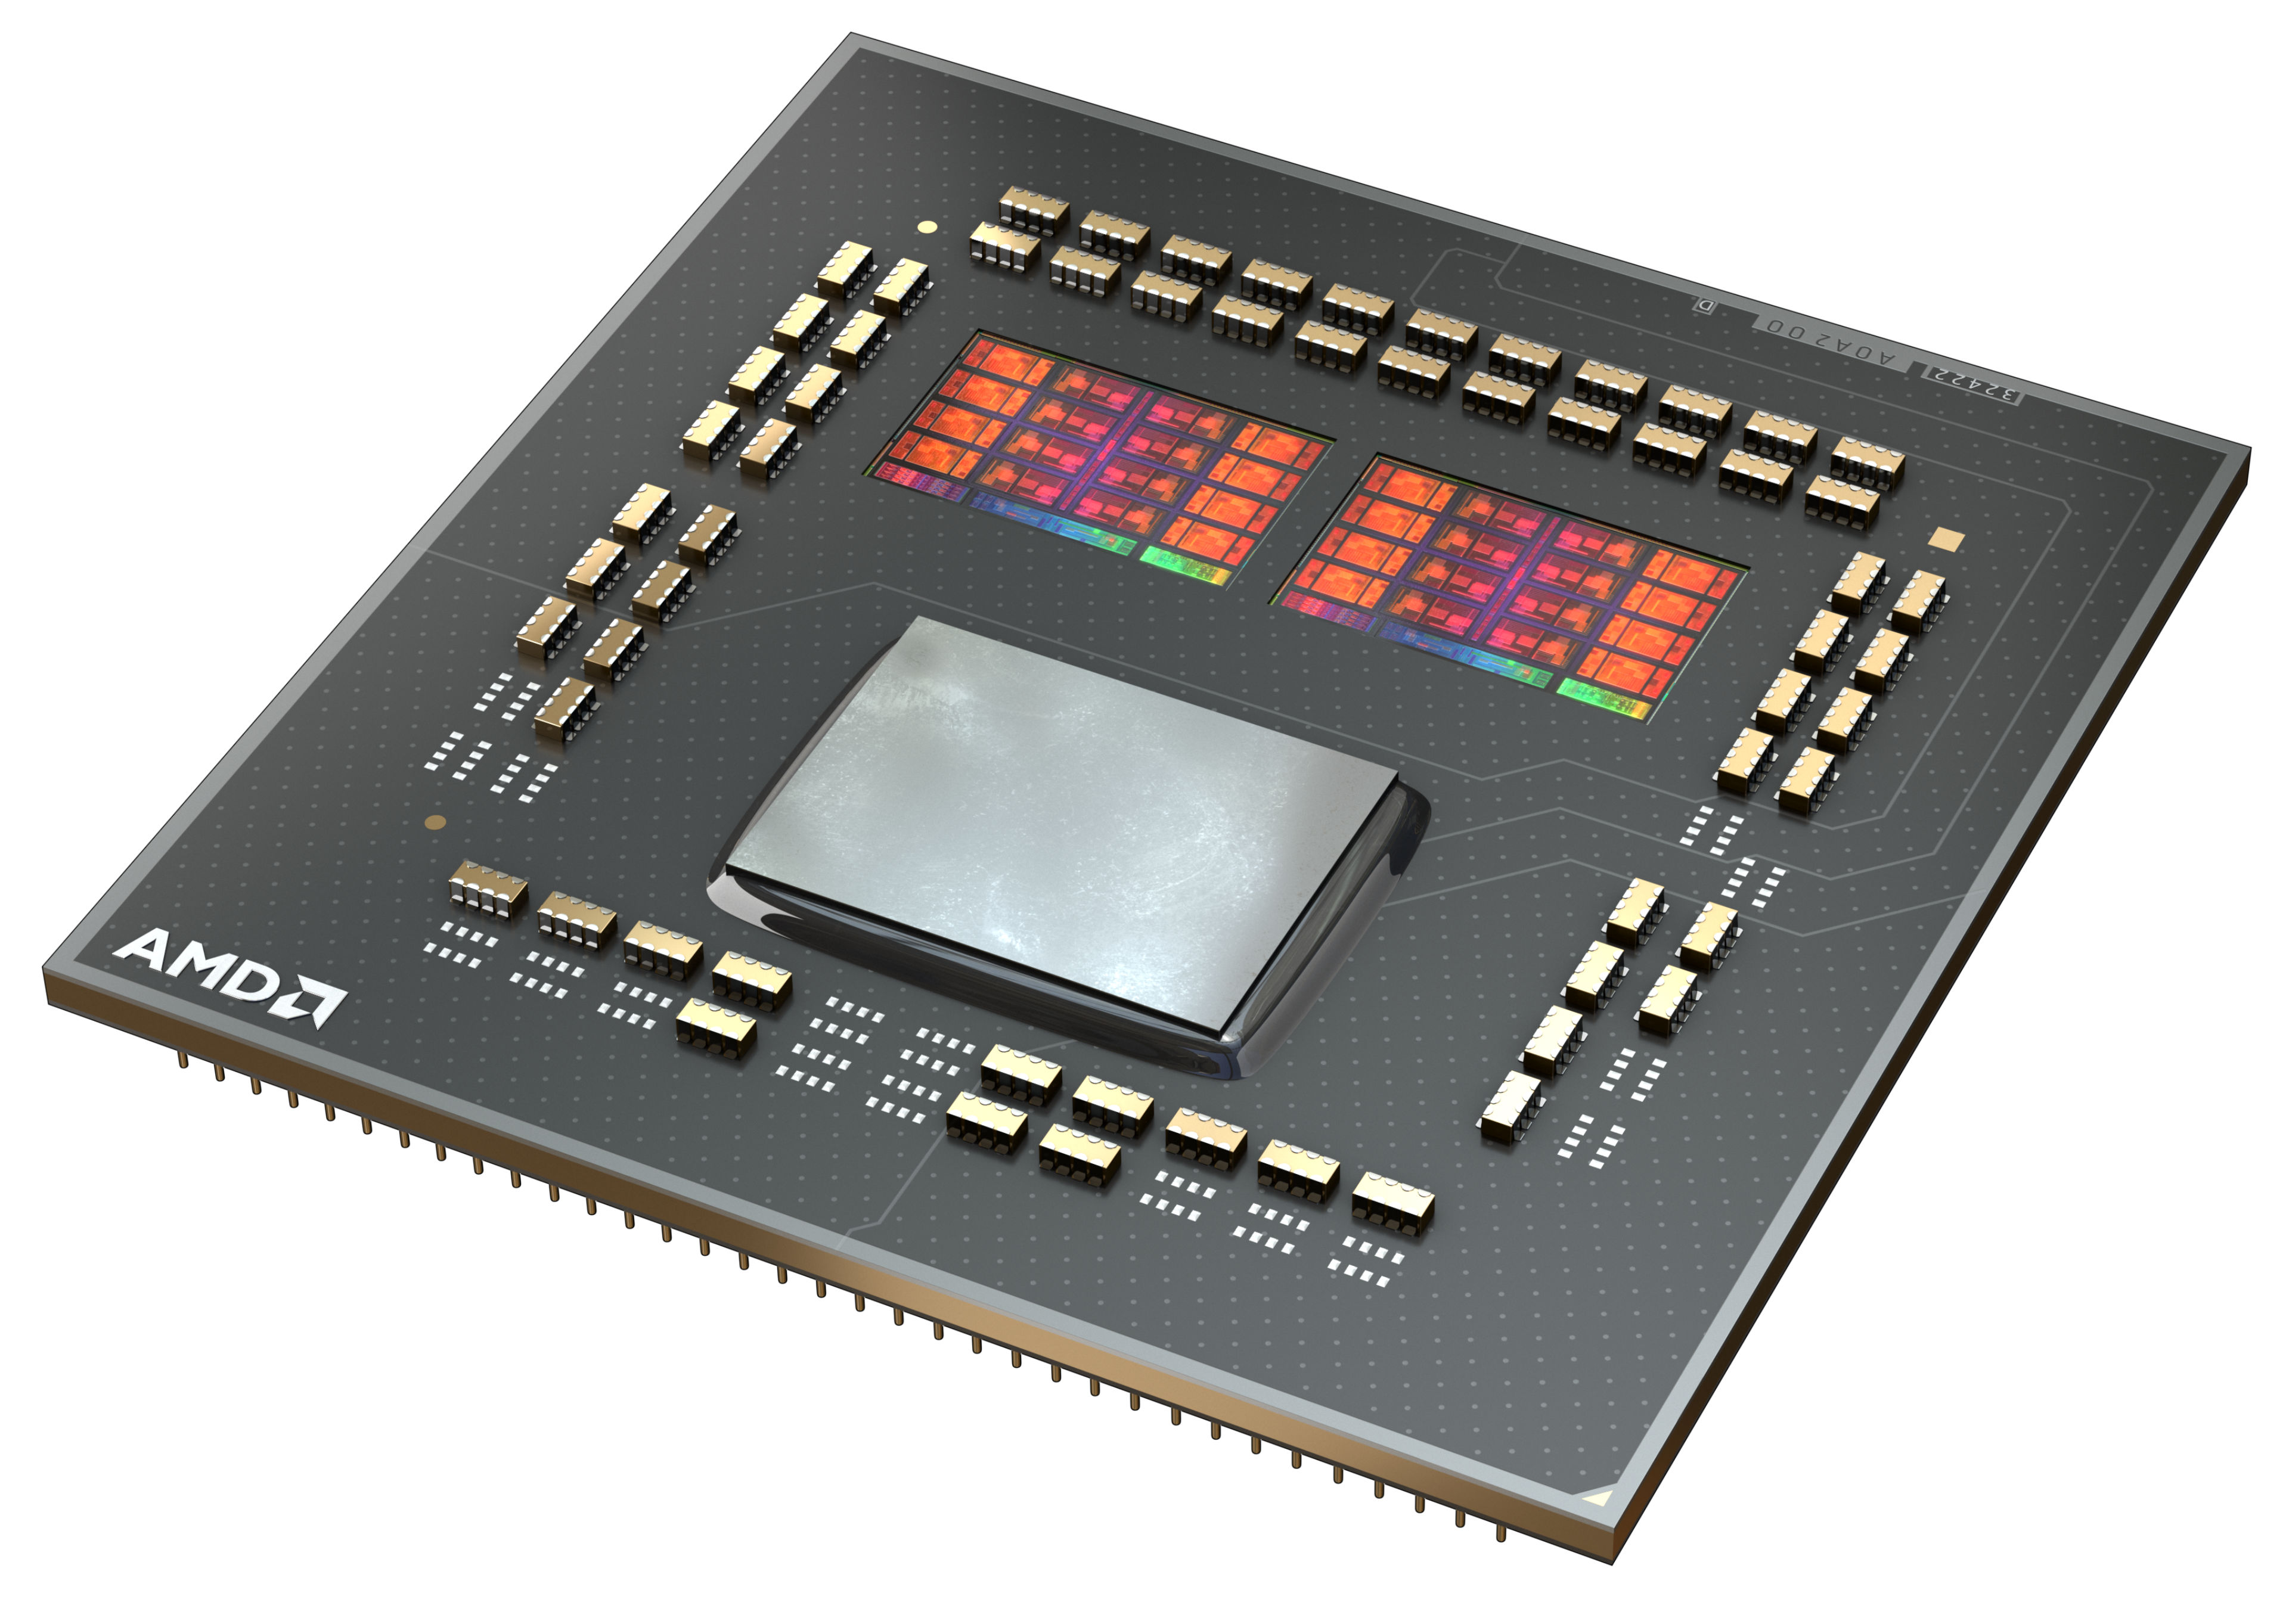
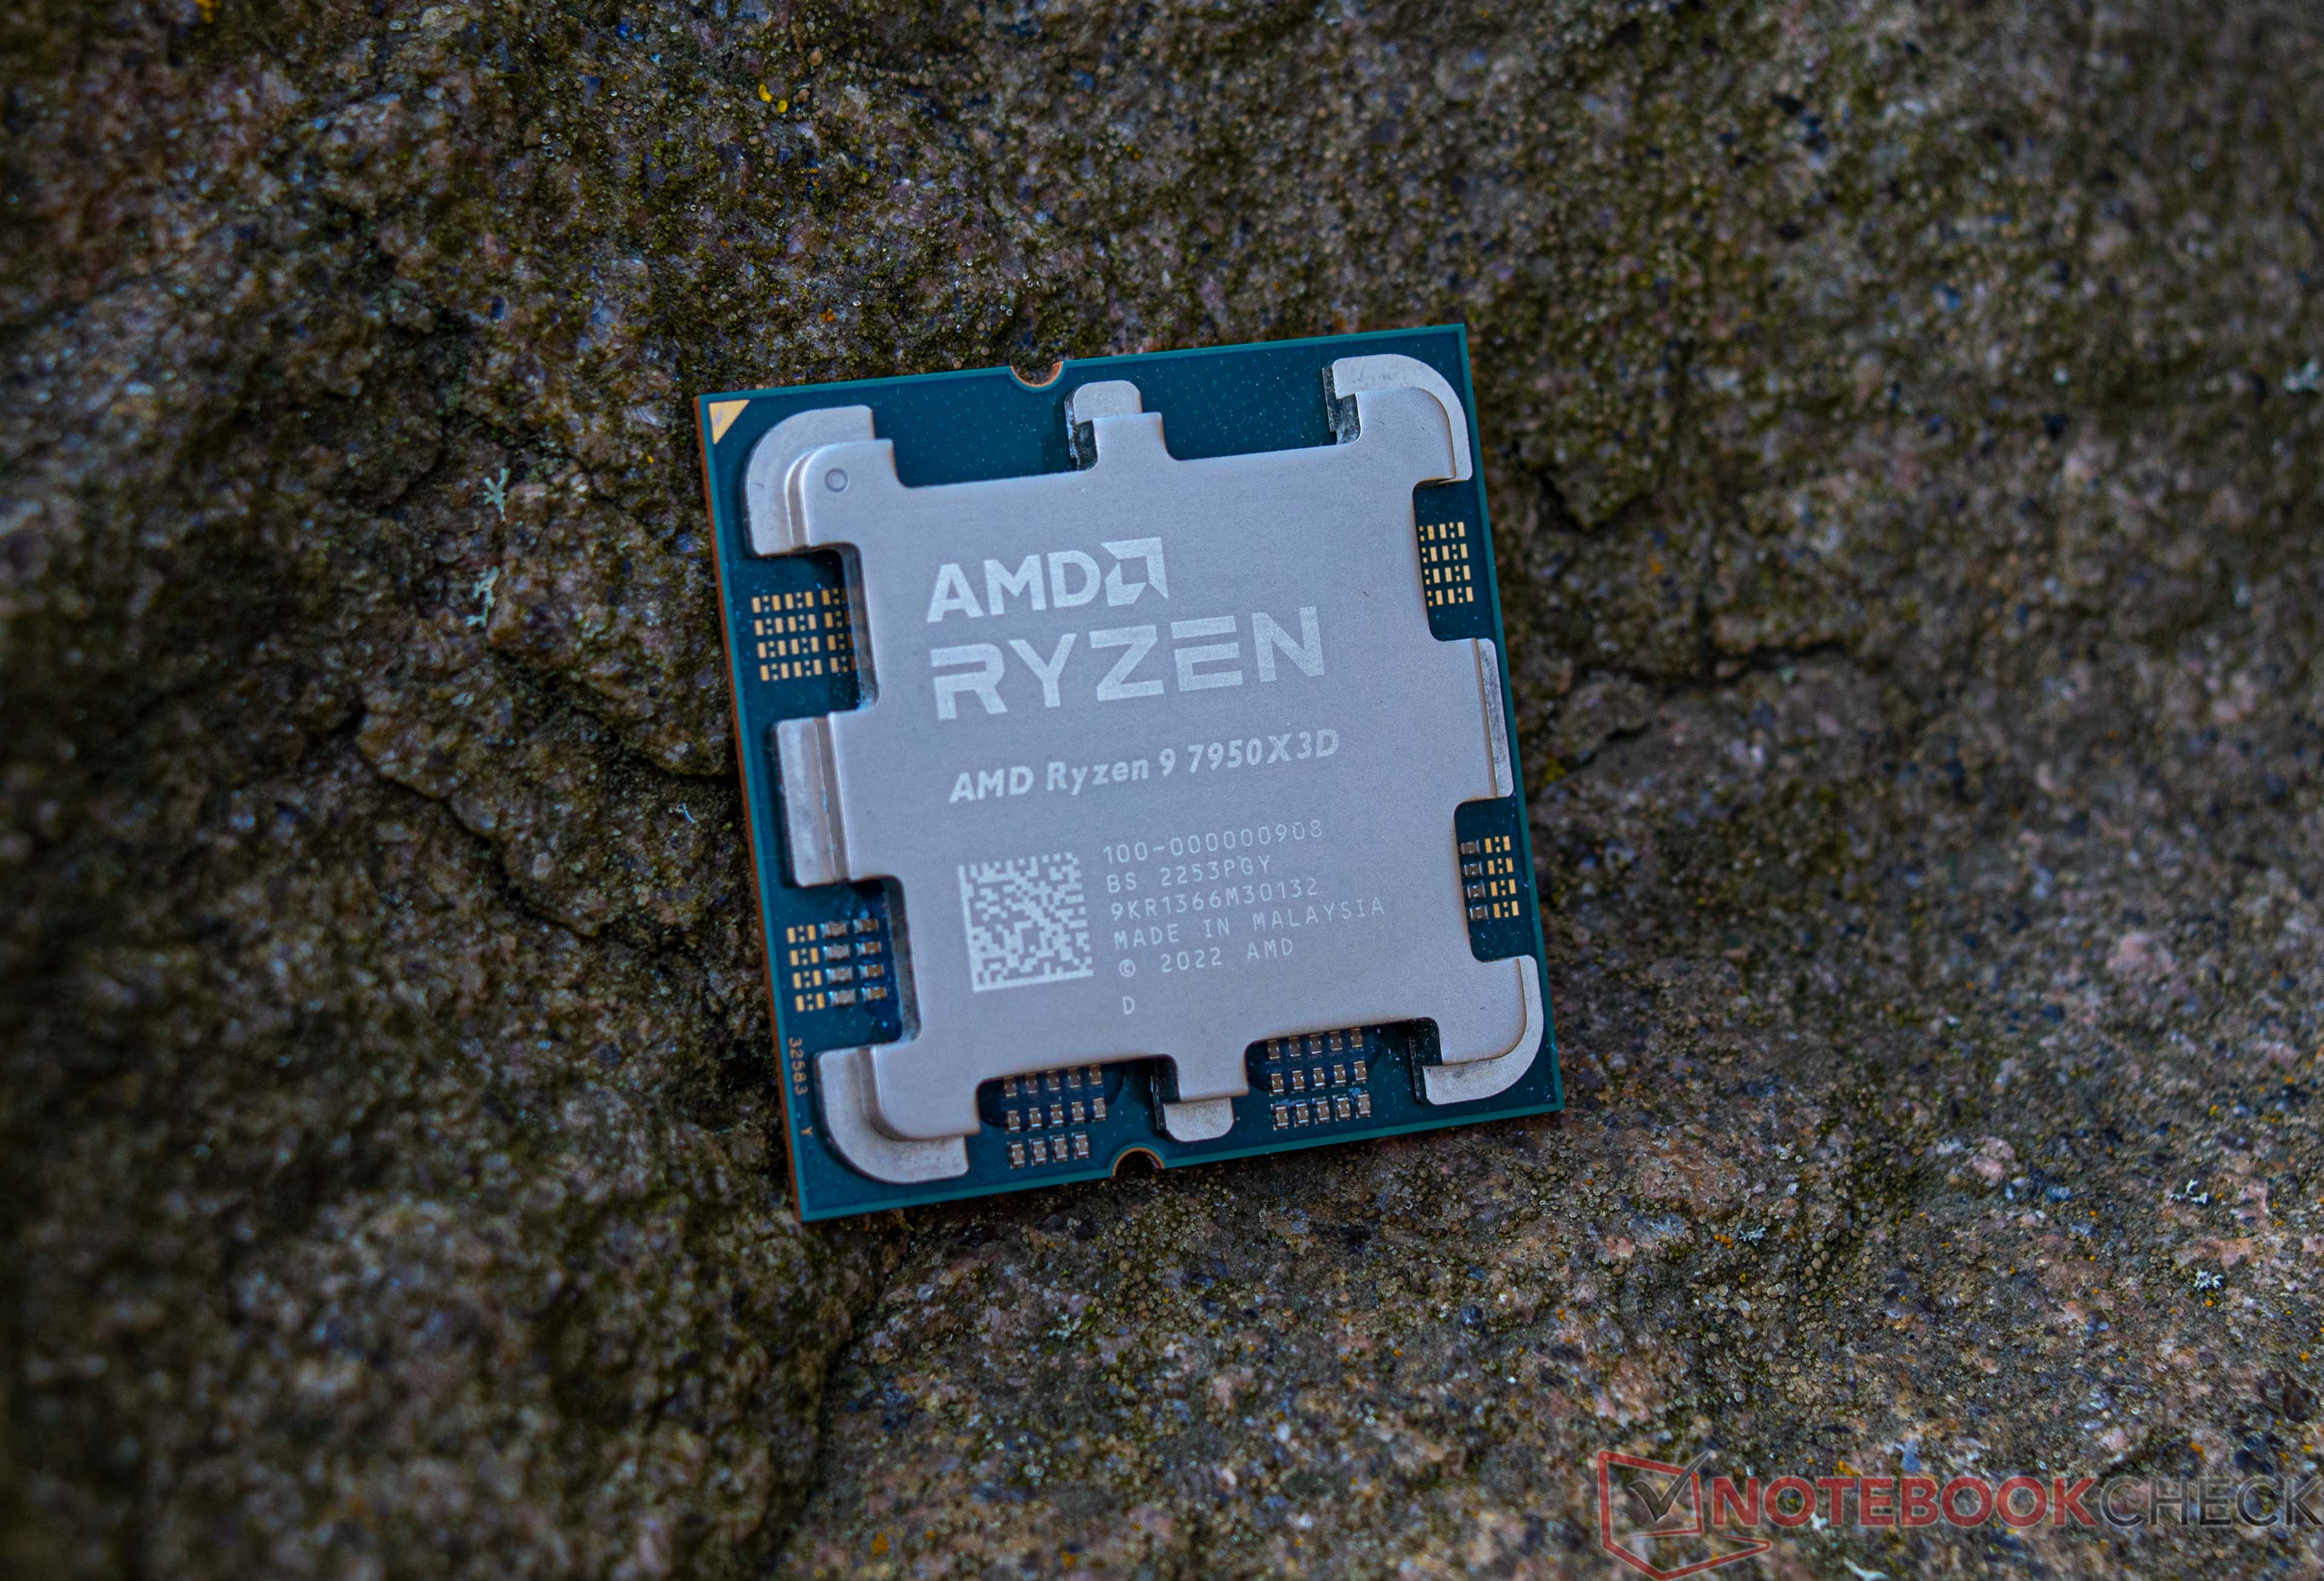
The AMD Ryzen 9 7950X3D is a high-end desktop processor of the Raphael series with 16 cores and SMT (Simultaneous Multithreading), which means it can process up to 32 threads simultaneously. With the release in February 2023, the Ryzen 9 7950X3D is AMD's fastest consumer processor and the new top model of the 7000 series. The CPU cores clock from 4.2 GHz (base clock) up to 5.7 GHz (single core Turbo). In addition, the AMD Ryzen 9 7950X3D has a CCD with 8 cores that can access the fast 3D V-cache, which offers considerably more gaming performance.

The performance of the AMD Ryzen 9 7950X3D is consistently excellent in all applications tested. In addition, AMD was again able to increase the single-thread performance compared to the non-X3D models. Nevertheless, the lower base clock compared to the AMD Ryzen 9 7950X means that a small drop in multi-thread performance has to be accepted.

The internal structure of the processor is comparable to the previous AMD Ryzen 9 7950X. The AMD Ryzen 9 7950X3D is also still based on the chiplet design consisting of two CCD clusters with 8 cores each. However, the two CCDs differ significantly from each other because one offers the fast 3D V-Cache, which primarily improves gaming performance. In testing, the AMD Ryzen 9 7950X3D was able to put the Intel Core i9-13900K in second place and is the fastest gaming CPU on the market at the time of testing. 

The AMD Ryzen 9 7950X3D is an extremely energy-efficient CPU with up to 162 watts (PPT) and is significantly more frugal under load than an AMD Ryzen 9 7950X (max. 230 watts).

ModelAMD Ryzen 9 5900XAMD Ryzen 9 7950X3D
SeriesAMD Vermeer (Ryzen 5000)AMD Raphael (Zen 4, Ryzen 7000)
CodenameVermeer (Zen3)Raphael (Zen4)
Series: Raphael (Zen 4, Ryzen 7000) Raphael (Zen4)
AMD Ryzen 9 5900X « 3.7 - 4.8 GHz12 / 24 cores64 MB L3
AMD Ryzen 7 5800X3D compare3.4 - 4.5 GHz8 / 16 cores96 MB L3
AMD Ryzen 9 7950X3D « 4.2 - 5.7 GHz16 / 32 cores128 MB L3
AMD Ryzen 9 7900X compare4.7 - 5.6 GHz12 / 24 cores64 MB L3
AMD Ryzen 9 7900 compare3.7 - 5.4 GHz12 / 24 cores64 MB L3
AMD Ryzen 7 7700X compare4.5 - 5.4 GHz8 / 16 cores32 MB L3
AMD Ryzen 7 7700 compare3.8 - 5.3 GHz8 / 16 cores32 MB L3
AMD Ryzen 7 7800X3D compare4.2 - 5 GHz8 / 16 cores96 MB L3
AMD Ryzen 5 7600X compare4.7 - 5.3 GHz6 / 12 cores32 MB L3
AMD Ryzen 5 7600 compare3.8 - 5.1 GHz6 / 12 cores32 MB L3
Clock3700 - 4800 MHz4200 - 5700 MHz
L1 Cache768 KB1 MB
L2 Cache6 MB16 MB
L3 Cache64 MB128 MB
Cores / Threads12 / 2416 / 32
16 x 5.7 GHz AMD Zen 4
TDP105 Watt120 Watt
Technology7 nm5 nm
Die Size2x 80.7 + 125 (I/O) mm2263 mm2
SocketAM4 (1331)AM5 (LGA 1718)
FeaturesMMX(+), SSE, SSE2, SSE3, SSSE3, SSE4.1, SSE4.2, SSE4A, x86-64, AMD-V, AES, AVX, AVX2, FMA3, SHA, Precision Boost 2MMX(+), SSE, SSE2, SSE3, SSSE3, SSE4.1, SSE4.2, SSE4A, x86-64, AMD-V, AES, AVX, AVX2, AVX512F, FMA3, SHA, XFR2, Precision Boost 2
Architecturex86x86
$549 U.S.$699 U.S.
Announced
Transistors13140 Million
max. Temp.89 °C
iGPUAMD Radeon Graphics (Ryzen 7000) (400 - 2200 MHz)
Manufacturerwww.amd.com

Benchmarks

Performance Rating - CB R15 + R20 + 7-Zip + X265 + Blender + 3DM11 CPU - R9 5900X
44.9 pt (62%)
Performance Rating - CB R15 + R20 + 7-Zip + X265 + Blender + 3DM11 CPU - R9 7950X3D
61.1 pt (85%)
Cinebench R23 - Cinebench R23 Multi Core
min: 10531     avg: 15441     median: 16262 (15%)     max: 20634 Points
36291 Points (34%)
Cinebench R23 - Cinebench R23 Single Core
min: 1487     avg: 1526     median: 1527 (65%)     max: 1568 Points
2053 Points (87%)
Cinebench R20 - Cinebench R20 CPU (Single Core)
min: 579     avg: 603     median: 598 (66%)     max: 639 Points
795 Points (88%)
Cinebench R20 - Cinebench R20 CPU (Multi Core)
min: 4077     avg: 6104     median: 6233 (15%)     max: 8629 Points
14188 Points (35%)
Cinebench R15 - Cinebench R15 CPU Multi 64 Bit
min: 1744     avg: 2631     median: 2695 (17%)     max: 3717 Points
5974 Points (38%)
Cinebench R15 - Cinebench R15 CPU Single 64 Bit
min: 242     avg: 252.6     median: 250 (75%)     max: 271 Points
326 Points (98%)
Cinebench R11.5 - Cinebench R11.5 CPU Multi 64 Bit
41.8 Points (54%)
64.6 Points (84%)
Cinebench R11.5 - Cinebench R11.5 CPU Single 64 Bit
3.1 Points (78%)
3.9 Points (96%)
Cinebench R10 - Cinebench R10 Rend. Single (32bit)
6828 Points (41%)
16551 Points (100%)
Cinebench R10 - Cinebench R10 Rend. Multi (32bit)
52076 Points (38%)
138015 Points (100%)
Cinebench R10 - Cinebench R10 Rend. Multi (64bit)
99651 Points (69%)
72361 Points (50%)
Cinebench R10 - Cinebench R10 Rend. Single (64bit)
12739 Points (16%)
8853 Points (11%)
wPrime 2.10 - wPrime 2.0 1024m *
33.9 s (0%)
wPrime 2.10 - wPrime 2.0 32m *
2 s (0%)
wPrime 1.55 - wPrime 1.55 1024m *
59.5 s (0%)
wPrime 1.55 - wPrime 1.55 32m *
2.5 s (1%)
WinRAR - WinRAR 4.0
13361 Points (21%)
15779 Points (25%)
7-Zip 18.03 - 7-Zip 18.03 Multli Thread 4 runs
min: 63583     avg: 88397     median: 90443 (52%)     max: 103095 MIPS
159341 MIPS (91%)
7-Zip 18.03 - 7-Zip 18.03 Single Thread 4 runs
min: 5613     avg: 6469     median: 6582 (79%)     max: 6930 MIPS
8321 MIPS (99%)
X264 HD Benchmark 4.0 - x264 Pass 2
191 fps (67%)
265.5 fps (93%)
X264 HD Benchmark 4.0 - x264 Pass 1
335 fps (77%)
392.5 fps (91%)
HWBOT x265 Benchmark v2.2 - HWBOT x265 4k Preset
min: 12.4     avg: 23     median: 24.9 (44%)     max: 27.4 fps
42.4 fps (75%)
TrueCrypt - TrueCrypt Serpent
1.8 GB/s (0%)
2.8 GB/s (0%)
TrueCrypt - TrueCrypt Twofish
2.9 GB/s (50%)
4.2 GB/s (72%)
TrueCrypt - TrueCrypt AES
21.2 GB/s (55%)
26.9 GB/s (70%)
Blender - Blender 3.3 Classroom CPU *
133 Seconds (2%)
Blender - Blender 2.79 BMW27 CPU *
min: 138     avg: 161.5     median: 154.2 (1%)     max: 275 Seconds
86 Seconds (1%)
R Benchmark 2.5 - R Benchmark 2.5 *
min: 0.4457     avg: 0.5     median: 0.5 (10%)     max: 0.992 sec
0.4 sec (8%)
3DMark 06 - CPU - 3DMark 06 - CPU
min: 14624     avg: 17983     median: 16438 (35%)     max: 46989 Points
20279 Points (43%)
Super Pi mod 1.5 XS 1M - Super Pi mod 1.5 XS 1M *
7.2 s (2%)
6.1 s (1%)
Super Pi mod 1.5 XS 2M - Super Pi mod 1.5 XS 2M *
15.5 s (1%)
13.2 s (1%)
Super Pi Mod 1.5 XS 32M - Super Pi mod 1.5 XS 32M *
360.5 s (2%)
305.1 s (1%)
3DMark Vantage - 3DM Vant. Perf. CPU no Physx
min: 75591     avg: 79648     median: 80003 (70%)     max: 84938 Points
99321 Points (87%)
3DMark 11 - 3DM11 Performance Physics
min: 14512     avg: 20484     median: 21043.5 (57%)     max: 24451 Points
36991 Points (100%)
3DMark - 3DMark Ice Storm Physics
min: 78128     avg: 83169     median: 82567 (67%)     max: 89517 Points
86389 Points (70%)
3DMark - 3DMark Ice Storm Extreme Physics
min: 76234     avg: 83137     median: 82433.5 (67%)     max: 90527 Points
86306 Points (70%)
3DMark - 3DMark Ice Storm Unlimited Physics
min: 76690     avg: 84751     median: 85392 (72%)     max: 91451 Points
87725 Points (74%)
3DMark - 3DMark Cloud Gate Physics
min: 16889     avg: 21197     median: 21362 (54%)     max: 23560 Points
26168 Points (66%)
3DMark - 3DMark Fire Strike Standard Physics
min: 24944     avg: 32689     median: 32575 (58%)     max: 35932 Points
44787 Points (80%)
3DMark - 3DMark Time Spy CPU
min: 8552     avg: 11730     median: 11913 (50%)     max: 13232 Points
17206 Points (73%)
Geekbench 5.5 - Geekbench 5.1 - 5.4 64 Bit Single-Core
min: 1137     avg: 1574     median: 1604 (68%)     max: 1737 Points
2311 Points (98%)
Geekbench 5.5 - Geekbench 5.1 - 5.4 64 Bit Multi-Core
min: 6512     avg: 11914     median: 11765 (21%)     max: 15119 Points
24343 Points (44%)
Geekbench 5.0 - Geekbench 5.0 64 Bit Single-Core
min: 1162     avg: 1534     median: 1588 (7%)     max: 1670 Points
2183 Points (9%)
Geekbench 5.0 - Geekbench 5.0 64 Bit Multi-Core
min: 6534     avg: 12041     median: 12813 (40%)     max: 14983 Points
23720 Points (75%)
Geekbench 4.4 - Geekbench 4.1 - 4.4 64 Bit Single-Core
min: 5479     avg: 6880     median: 7034 (70%)     max: 7392 Points
9240 Points (92%)
Geekbench 4.4 - Geekbench 4.1 - 4.4 64 Bit Multi-Core
min: 29337     avg: 48522     median: 52798.5 (58%)     max: 57137 Points
87922 Points (96%)
Mozilla Kraken 1.1 - Kraken 1.1 Total Score *
min: 564     avg: 620     median: 582.5 (1%)     max: 905 ms
437 ms (1%)
WebXPRT 4 - WebXPRT 4 Score
313 Points (90%)
WebXPRT 3 - WebXPRT 3 Score
min: 178     avg: 266.4     median: 279 (58%)     max: 307 Points
383 Points (80%)
CrossMark - CrossMark Overall
min: 1514     avg: 1579     median: 1580 (61%)     max: 1619 Points
2193 Points (84%)
Power Consumption - Prime95 Power Consumption - external Monitor *
min: 105.1     avg: 154.2     median: 122 (21%)     max: 235.6 Watt
276 Watt (48%)
Power Consumption - Cinebench R15 Multi Power Consumption - external Monitor *
min: 106.6     avg: 152.1     median: 114 (21%)     max: 235.8 Watt
273 Watt (50%)
Power Consumption - Idle Power Consumption - external Monitor *
min: 63.1     avg: 75     median: 73.6 (49%)     max: 88.3 Watt
118.4 Watt (78%)
Power Consumption - Cinebench R15 Multi Power Efficiency - external Monitor
min: 15.8     avg: 17.3     median: 16.4 (12%)     max: 19.8 Points per Watt
21.9 Points per Watt (16%)

Average Benchmarks AMD Ryzen 9 5900X → 100% n=44

Average Benchmarks AMD Ryzen 9 7950X3D → 142% n=44

- Range of benchmark values for this graphics card
- Average benchmark values for this graphics card
* Smaller numbers mean a higher performance
1 This benchmark is not used for the average calculation

Add one or more devices and compare

In the following list you can select (and also search for) devices that should be added to the comparison. You can select more than one device.

restrict list:

show all (including archived), 2024, 2023
v1.28
log 04. 17:12:11

#0 checking url part for id 12782 +0s ... 0s

#1 checking url part for id 15000 +0s ... 0s

#2 redirected to Ajax server, took 1720105931 +0s ... 0s

#3 did not recreate cache, as it is less than 5 days old! Created at Thu, 04 Jul 2024 05:15:21 +0200 +0s ... 0s

#4 composed specs +0.004s ... 0.005s

#5 did output specs +0s ... 0.005s

#6 getting avg benchmarks for device 12782 +0.004s ... 0.009s

#7 got single benchmarks 12782 +0.047s ... 0.056s

#8 getting avg benchmarks for device 15000 +0.004s ... 0.06s

#9 got single benchmarks 15000 +0.005s ... 0.065s

#10 got avg benchmarks for devices +0s ... 0.065s

#11 min, max, avg, median took s +0.062s ... 0.127s

#12 return log +0.002s ... 0.129s

Please share our article, every link counts!
> Expert Reviews and News on Laptops, Smartphones and Tech Innovations > Benchmarks / Tech > Processor Comparison - Head 2 Head
Redaktion, 2017-09- 8 (Update: 2023-07- 1)