AMD Ryzen 7 PRO 7730U vs Intel Core i7-10875H vs AMD Ryzen 5 7530U
AMD Ryzen 7 PRO 7730U ► remove from comparison
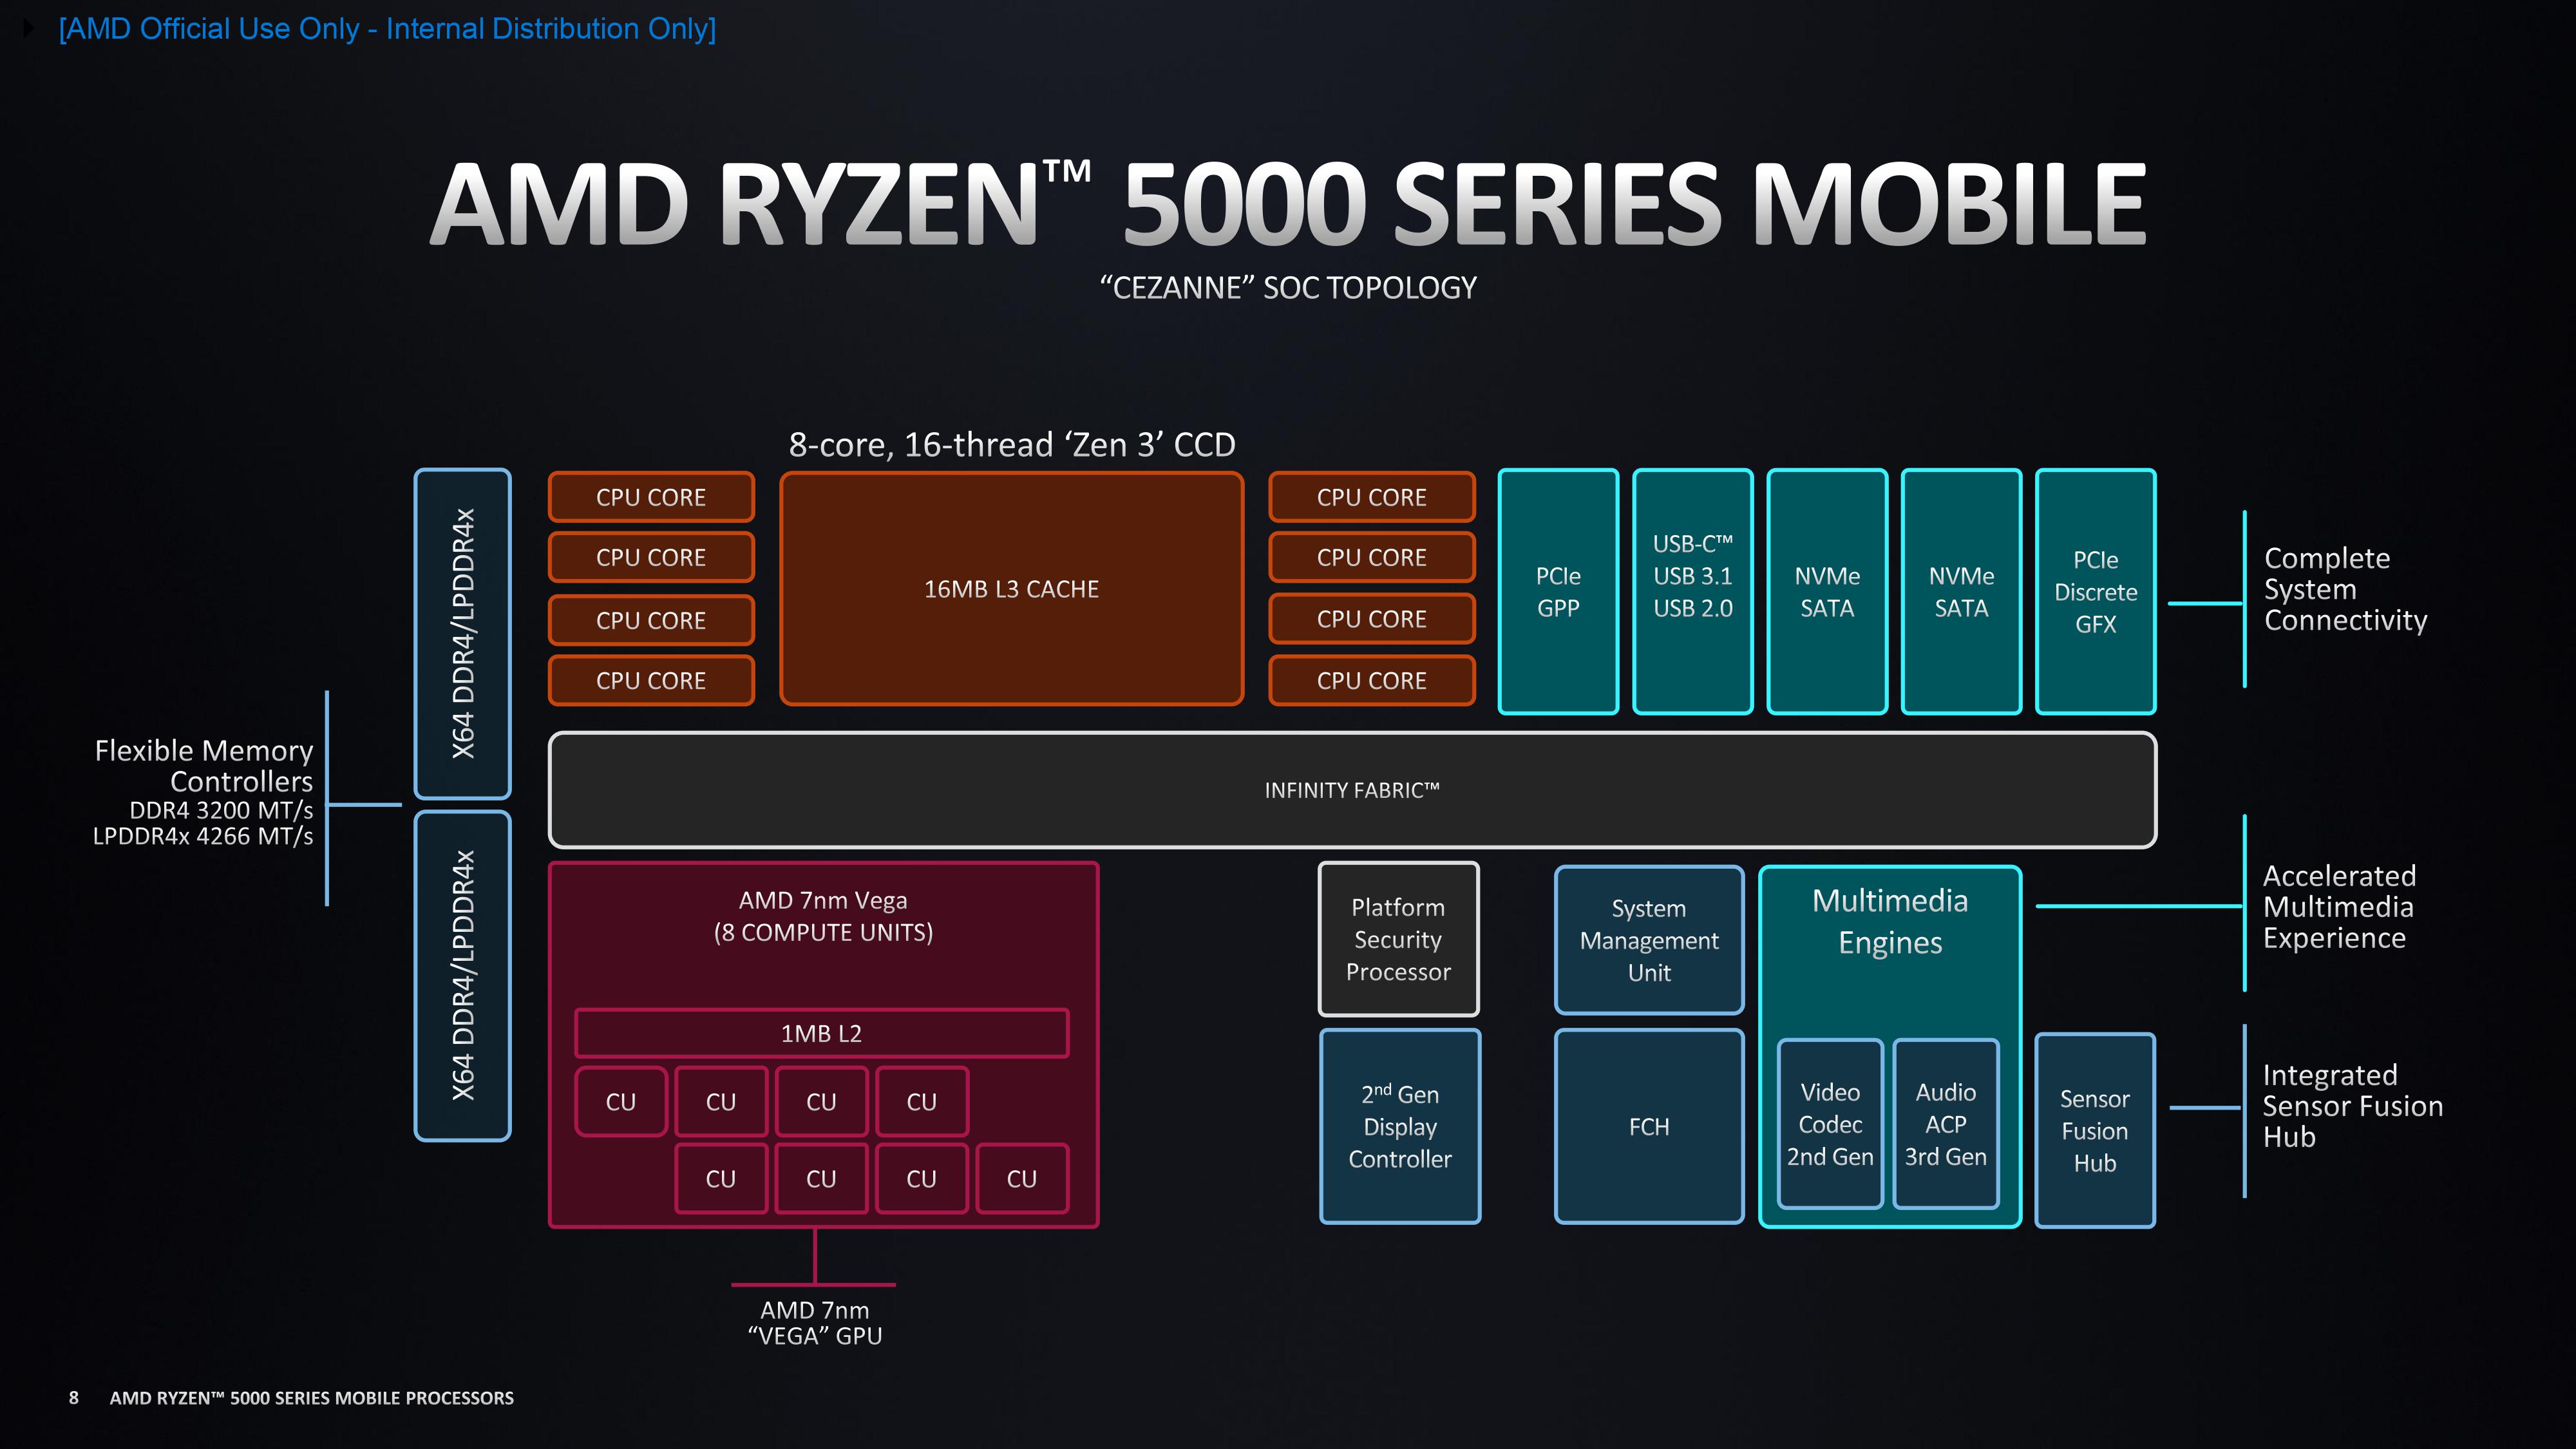
The AMD Ryzen 7 PRO 7730U is a processor for thin and light laptops based on the Cezanne generation. It is part of the second "Barcelo" refresh in early 2023 and offers the same specifications as the old Ryzen 7 5825U . The CPU integrates all eight cores based on the Zen 3 microarchitecture clocked at 2 (guaranteed base clock) to 4.5 GHz (Turbo) and support SMT / Hyperthreading (16 threads). The chip is manufactured in 7nm at TSMC. In comparison to the similar Ryzen 7 7730U , the PRO variant is aimed at business use and supports additional manageability and security features.
The Zen 3 microarchitecture offers significantly higher IPC (instructions per clock) compared to Zen 2 but falls behind the current Zen 4-based CPUs (e.g., 7040HS series).
Performance
The average 7730U in our database performs similarly to the Ryzen 7 5825U , Ryzen 7 6800U , Ryzen 7 PRO 6850U , and also the Core i7-1360P concerning multi-thread benchmark scores.
In addition to the eight CPU cores, the APU also integrates a Radeon RX Vega 8 GPU with 8 CUs operating at up to 2000 MHz. The dual-channel memory controller supports DDR4-3200 and energy-efficient LPDDR4-4266 RAM. Furthermore, a 16 MB level 3 cache (up from 8 MB on the 4800U) can be found on the chip.
The TDP of the APU is specified at 15 Watts (compared to the 5825U, which was specified between 10 and 25W).
Intel Core i7-10875H ► remove from comparison
The Intel Core i7-10875H is a high-end processor for laptops with eight cores based on the Comet Lake architecture (CML-H, 4th generation of Skylake). The processor clocks at between 2.3 and 5.1 GHz (4.3 with all 8 cores, 4.9 without Thermal Velocity boost) and can execute up to sixteen threads simultaneously thanks to Hyper-Threading. The processor is still manufactured in the old 14nm (14nm++) process. Compared to the predecessors, the Comet Lake-H series CPUs offer only increased clock rates.
The Comet Lake architecture is similar to Coffee Lake and offers the same features and is produced in the same 14nm process. Other than the improved clock rates, the memory controller now also supports faster DDR4-2933 RAM. More information on Comet Lake and all the models and articles on it can be found here .
The Core i7-10875H supports the management features vPro, TXT and SIPP.
Performance
The performance of the Core i7-10875H should be somewhere around the older Core i9-9880H . Thanks to the 8 cores and high Turbo speeds, even demanding applications should run very good on the CPU. However, long term performance is always depending on the laptop cooling system and system configuration.
Graphics
The integrated Intel UHD Graphics 630 iGPU is supposed to offer a similar performance as the UHD630 in the Core i7-9880H. As a low-end solution it will only run current games smoothly at reduced details - if at all.
Power Consumption
Intel specifies the TDP with 45 watts and therefore the i7 is only suited for big laptops with good cooling solutions. Using cTDP-down, the CPU can also be configured to 35 Watt resulting in a reduced performance.
AMD Ryzen 5 7530U ► remove from comparison
The AMD Ryzen 5 7530U is a processor for thin and light laptops based on the Cezanne generation. It is part of the second "Barcelo" refresh in early 2023 and offers 200 MHz higher boost clock for the CPU cores compared to the old Ryzen 5 5625U (but a slower base clock speed). The R5 7530U integrates six of the eight cores based on the Zen 3 microarchitecture. The cores are clocked at 2 (guaranteed base clock) to 4.5 GHz (single core boost) and support SMT for a total of 12 threads. The chip is manufactured in 7 nm at TSMC.
Performance
The average 7530U in our database is in the same league as the Ryzen 5 5625U , Ryzen 7 4800U , Ryzen 7 PRO 5850U , Core i5-1335U , as far as multi-thread benchmark scores are concerned.
Thanks to its decent cooling solution and a long-term CPU power limit of 37 W, the VivoBook 15X OLED M3504YA is among the fastest laptops built around the 7530U that we know of. It can be roughly 40% faster in CPU-bound workloads than the slowest system featuring the same chip in our database, as of August 2023.
In addition to the six CPU cores, the APU also integrates a Radeon RX Vega 7 (now only called Radeon Graphics) integrated graphics card with 7 CUs at up to 2 GHz. The dual channel memory controller supports DDR4-3200 and energy efficient LPDDR4-4266 RAM. Furthermore, 16 MB level 3 cache (up from 8 MB at the 4800U) can be found on the chip.
Power consumption
This Ryzen has a default TDP of 15 W (also known as the Power Limit 1).
Model AMD Ryzen 7 PRO 7730U Intel Core i7-10875H AMD Ryzen 5 7530U Series AMD Cezanne (Zen 3, Ryzen 5000) Intel Comet Lake AMD Cezanne (Zen 3, Ryzen 5000) Codename Barcelo-U Refresh Comet Lake-H Barcelo-U Refresh Series: Cezanne (Zen 3, Ryzen 5000) Barcelo-U Refresh Clock 2000 - 4500 MHz 2300 - 5100 MHz 2000 - 4500 MHz L1 Cache 512 KB 512 KB 384 KB L2 Cache 4 MB 2 MB 3 MB L3 Cache 16 MB 16 MB 16 MB Cores / Threads 8 / 16 8 / 16 6 / 12 TDP 15 Watt 45 Watt 15 Watt Technology 7 nm 14 nm 7 nm max. Temp. 95 °C 100 °C 95 °C Socket FP6 FCBGA1440 FP6 Features DDR4-3200/LPDDR4x-4266 RAM (incl. ECC), PCIe 3, MMX, SSE, SSE2, SSE3, SSSE3, SSE4A, SSE4.1, SSE4.2, AVX, AVX2, BMI2, ABM, FMA, ADX, SMEP, SMAP, SMT, CPB, AES-NI, RDRAND, RDSEED, SHA, SME Dual-Channel DDR4 Memory Controller, HyperThreading, AVX, AVX2, Quick Sync, Virtualization, AES-NI DDR4-3200/LPDDR4x-4266 RAM (incl. ECC), PCIe 3, MMX, SSE, SSE2, SSE3, SSSE3, SSE4A, SSE4.1, SSE4.2, AVX, AVX2, BMI2, ABM, FMA, ADX, SMEP, SMAP, SMT, CPB, AES-NI, RDRAND, RDSEED, SHA, SME iGPU AMD Radeon RX Vega 8 (Ryzen 4000/5000) ( - 2000 MHz)Intel UHD Graphics 630 (350 - 1200 MHz)AMD Radeon RX Vega 7 ( - 2000 MHz)Architecture x86 x86 x86 Announced Manufacturer www.amd.com ark.intel.com www.amd.com $450 U.S.
Benchmarks Performance Rating - CB R15 + R20 + 7-Zip + X265 + Blender + 3DM11 CPU - R7 PRO 7730U
37.7 pt (52%)
...
...
max:
Performance Rating - CB R15 + R20 + 7-Zip + X265 + Blender + 3DM11 CPU - i7-10875H
35.6 pt (49%)
...
...
max:
Performance Rating - CB R15 + R20 + 7-Zip + X265 + Blender + 3DM11 CPU - R5 7530U
37 pt (51%)
...
Intel Core i5-11500B
...
max:
Cinebench 2024 - Cinebench 2024 CPU Single Core
82.8 Points (58%)
83 Points (58%)
CPU TDP 31 W TDP 38 W 100% 100%
Cinebench 2024 - Cinebench 2024 CPU Multi Core
357 Points (7%)
455 Points (8%)
CPU TDP 31 W TDP 38 W 78% 100%
Cinebench R23 - Cinebench R23 Multi Core
10095 Points (9%)
min: 5135 avg: 8108 median: 8889.5 (8%) max: 9809 Points
CPU TDP ? TDP 31 W TDP 60 W TDP 65 W 79% 100% 88% 79%
min: 6931 avg: 8479 median: 8418.5 (8%) max: 9347 Points
CPU TDP ? TDP 15 W TDP 20 W TDP 23 W TDP 25 W TDP 28 W TDP 31 W TDP 37 W TDP 38 W TDP 60 W TDP 65 W 82% 69% 84% 82% 78% 83% 100% 91% 93% 88% 79%
Cinebench R23 - Cinebench R23 Single Core
1441 Points (61%)
min: 1100 avg: 1222 median: 1241.5 (53%) max: 1270 Points
CPU TDP ? TDP 31 W TDP 60 W TDP 65 W 83% 100% 87% 86%
min: 1371 avg: 1438 median: 1443 (61%) max: 1470 Points
CPU TDP ? TDP 15 W TDP 20 W TDP 23 W TDP 25 W TDP 28 W TDP 31 W TDP 37 W TDP 38 W TDP 60 W TDP 65 W 86% 93% 97% 98% 99% 98% 98% 100% 100% 85% 85%
Cinebench R20 - Cinebench R20 CPU (Single Core)
562 Points (62%)
min: 430 avg: 485.9 median: 483.5 (54%) max: 524 Points
CPU TDP ? TDP 31 W TDP 45 W TDP 55 W TDP 60 W TDP 65 W 86% 100% 86% 90% 86% 86%
min: 528 avg: 561 median: 565 (63%) max: 574 Points
CPU TDP ? TDP 15 W TDP 20 W TDP 23 W TDP 25 W TDP 28 W TDP 31 W TDP 37 W TDP 38 W TDP 45 W TDP 55 W TDP 60 W TDP 65 W 85% 92% 97% 98% 99% 98% 98% 100% 99% 84% 88% 84% 84%
Cinebench R20 - Cinebench R20 CPU (Multi Core)
3967 Points (10%)
min: 1986 avg: 3455 median: 3391.5 (8%) max: 4176 Points
CPU TDP ? TDP 31 W TDP 45 W TDP 55 W TDP 60 W TDP 65 W 88% 100% 83% 84% 85% 78%
min: 2833 avg: 3304 median: 3288 (8%) max: 3655 Points
CPU TDP ? TDP 15 W TDP 20 W TDP 23 W TDP 25 W TDP 28 W TDP 31 W TDP 37 W TDP 38 W TDP 45 W TDP 55 W TDP 60 W TDP 65 W 88% 71% 78% 83% 77% 83% 100% 91% 92% 83% 84% 85% 78%
Cinebench R15 - Cinebench R15 CPU Multi 64 Bit
1756 Points (11%)
min: 1003 avg: 1554 median: 1594.5 (10%) max: 1833 Points
CPU TDP ? TDP 31 W TDP 45 W TDP 55 W TDP 60 W TDP 65 W 89% 100% 85% 82% 96% 77%
min: 1289 avg: 1447 median: 1457.5 (9%) max: 1599 Points
CPU TDP ? TDP 15 W TDP 20 W TDP 23 W TDP 25 W TDP 28 W TDP 31 W TDP 37 W TDP 38 W TDP 45 W TDP 55 W TDP 60 W TDP 65 W 89% 73% 74% 85% 76% 81% 100% 88% 91% 85% 82% 96% 77%
Cinebench R15 - Cinebench R15 CPU Single 64 Bit
229 Points (69%)
min: 190 avg: 203.6 median: 202 (61%) max: 220 Points
CPU TDP ? TDP 31 W TDP 45 W TDP 55 W TDP 60 W TDP 65 W 89% 100% 93% 92% 89% 88%
min: 213 avg: 229.5 median: 230.5 (69%) max: 237 Points
CPU TDP ? TDP 15 W TDP 20 W TDP 23 W TDP 25 W TDP 28 W TDP 31 W TDP 37 W TDP 38 W TDP 45 W TDP 55 W TDP 60 W TDP 65 W 86% 90% 97% 97% 99% 97% 97% 100% 99% 89% 89% 86% 85%
Cinebench R11.5 - Cinebench R11.5 CPU Multi 64 Bit
17.6 Points (23%)
18.7 Points (24%)
CPU TDP ? TDP 31 W 100% 94%
Cinebench R11.5 - Cinebench R11.5 CPU Single 64 Bit
2.7 Points (67%)
2.4 Points (60%)
CPU TDP ? TDP 31 W 90% 100%
Cinebench R10 - Cinebench R10 Rend. Single (32bit)
6108 Points (37%)
7803 Points (47%)
CPU TDP ? TDP 31 W 100% 78%
Cinebench R10 - Cinebench R10 Rend. Multi (32bit)
33735 Points (24%)
44805 Points (32%)
CPU TDP ? TDP 31 W 100% 75%
wPrime 2.10 - wPrime 2.0 1024m *
369.1 s (4%)
wPrime 2.10 - wPrime 2.0 32m *
10.4 s (2%)
5274 Points (8%)
7473 Points (12%)
CPU TDP ? TDP 31 W 100% 71%
7-Zip 18.03 - 7-Zip 18.03 Multli Thread 4 runs
min: 42735 avg: 45924 median: 45924 (26%) max: 49113 MIPS
min: 29844 avg: 43117 median: 44947 (26%) max: 49562 MIPS
CPU TDP ? TDP 31 W TDP 45 W TDP 55 W TDP 60 W TDP 65 W 94% 100% 91% 96% 100% 89%
min: 32204 avg: 37957 median: 37983 (22%) max: 42364 MIPS
CPU TDP ? TDP 15 W TDP 20 W TDP 23 W TDP 25 W TDP 28 W TDP 31 W TDP 37 W TDP 38 W TDP 45 W TDP 55 W TDP 60 W TDP 65 W 94% 70% 80% 80% 82% 83% 100% 89% 92% 91% 96% 100% 89%
7-Zip 18.03 - 7-Zip 18.03 Single Thread 4 runs
min: 5218 avg: 5269 median: 5269 (63%) max: 5320 MIPS
min: 5071 avg: 5360 median: 5319 (64%) max: 5780 MIPS
CPU TDP ? TDP 31 W TDP 45 W TDP 55 W TDP 60 W TDP 65 W 92% 91% 100% 97% 94% 92%
min: 5113 avg: 5328 median: 5339 (64%) max: 5544 MIPS
CPU TDP ? TDP 15 W TDP 20 W TDP 23 W TDP 25 W TDP 28 W TDP 31 W TDP 37 W TDP 38 W TDP 45 W TDP 55 W TDP 60 W TDP 65 W 92% 88% 91% 92% 94% 91% 91% 96% 93% 100% 97% 94% 92%
X264 HD Benchmark 4.0 - x264 Pass 2
95 fps (33%)
103 fps (36%)
CPU TDP ? TDP 31 W 100% 92%
X264 HD Benchmark 4.0 - x264 Pass 1
221 fps (51%)
242.4 fps (56%)
CPU TDP ? TDP 31 W 100% 91%
HWBOT x265 Benchmark v2.2 - HWBOT x265 4k Preset
min: 11.5 avg: 12.1 median: 12.1 (21%) max: 12.6 fps
min: 7.27 avg: 11.7 median: 12.1 (21%) max: 14.1 fps
CPU TDP ? TDP 31 W TDP 45 W TDP 55 W TDP 60 W TDP 65 W 98% 100% 91% 99% 99% 91%
min: 8.17 avg: 10.3 median: 10.7 (19%) max: 11.6 fps
CPU TDP ? TDP 15 W TDP 20 W TDP 23 W TDP 25 W TDP 28 W TDP 31 W TDP 37 W TDP 38 W TDP 45 W TDP 55 W TDP 60 W TDP 65 W 98% 68% 90% 83% 83% 89% 100% 90% 96% 91% 99% 99% 91%
TrueCrypt - TrueCrypt Serpent
0.5 GB/s (0%)
1.1 GB/s (0%)
CPU TDP ? TDP 31 W 100% 42%
TrueCrypt - TrueCrypt Twofish
0.7 GB/s (12%)
1.8 GB/s (31%)
CPU TDP ? TDP 31 W 100% 37%
TrueCrypt - TrueCrypt AES
4.2 GB/s (11%)
10.3 GB/s (27%)
CPU TDP ? TDP 31 W 100% 41%
Blender - Blender 3.3 Classroom CPU *
min: 523 avg: 528 median: 528 (7%) max: 533 Seconds
min: 583 avg: 694 median: 674 (9%) max: 820 Seconds
CPU TDP 15 W TDP 20 W TDP 23 W TDP 25 W TDP 28 W TDP 31 W TDP 37 W TDP 38 W 100% 101% 101% 102% 102% 104% 103% 103%
Blender - Blender 2.79 BMW27 CPU *
min: 298 avg: 301.5 median: 301.5 (2%) max: 305 Seconds
min: 258.6 avg: 327 median: 322.5 (2%) max: 535 Seconds
CPU TDP ? TDP 31 W TDP 45 W TDP 55 W TDP 60 W TDP 65 W 100% 100% 100% 100% 100% 100%
min: 330 avg: 377.3 median: 362 (3%) max: 469 Seconds
CPU TDP ? TDP 15 W TDP 20 W TDP 23 W TDP 25 W TDP 28 W TDP 31 W TDP 37 W TDP 38 W TDP 45 W TDP 55 W TDP 60 W TDP 65 W 101% 100% 101% 101% 101% 101% 101% 101% 101% 101% 101% 101% 101%
R Benchmark 2.5 - R Benchmark 2.5 *
min: 0.543 avg: 0.5 median: 0.5 (12%) max: 0.553 sec
min: 0.546 avg: 0.6 median: 0.6 (13%) max: 0.662 sec
CPU TDP ? TDP 31 W TDP 45 W TDP 55 W TDP 60 W TDP 65 W 100% 101% 101% 101% 100% 100%
min: 0.515 avg: 0.5 median: 0.5 (11%) max: 0.567 sec
CPU TDP ? TDP 15 W TDP 20 W TDP 23 W TDP 25 W TDP 28 W TDP 31 W TDP 37 W TDP 38 W TDP 45 W TDP 55 W TDP 60 W TDP 65 W 100% 100% 101% 101% 101% 101% 101% 102% 101% 101% 101% 100% 100%
3DMark 06 - CPU - 3DMark 06 - CPU
8758 Points (19%)
min: 12228 avg: 12945 median: 12944.5 (28%) max: 13661 Points
CPU TDP ? TDP 31 W 100% 68%
Super Pi mod 1.5 XS 1M - Super Pi mod 1.5 XS 1M *
8.5 s (2%)
7.7 s (2%)
CPU TDP ? TDP 31 W 100% 100%
Super Pi mod 1.5 XS 2M - Super Pi mod 1.5 XS 2M *
18 s (1%)
16.8 s (1%)
CPU TDP ? TDP 31 W 100% 100%
Super Pi Mod 1.5 XS 32M - Super Pi mod 1.5 XS 32M *
456.7 s (2%)
431.7 s (2%)
CPU TDP ? TDP 31 W 100% 100%
3DMark Vantage - 3DM Vant. Perf. CPU no Physx
min: 55236 avg: 55318 median: 55317.5 (48%) max: 55399 Points
3DMark 11 - 3DM11 Performance Physics
min: 7418 avg: 10822 median: 10821.5 (29%) max: 14225 Points
min: 11778 avg: 16439 median: 16622 (45%) max: 18773 Points
CPU TDP ? TDP 31 W TDP 45 W TDP 55 W TDP 60 W TDP 65 W 95% 62% 98% 95% 100% 93%
min: 10189 avg: 11861 median: 12224 (33%) max: 12926 Points
CPU TDP ? TDP 15 W TDP 20 W TDP 23 W TDP 25 W TDP 28 W TDP 31 W TDP 37 W TDP 38 W TDP 45 W TDP 55 W TDP 60 W TDP 65 W 94% 61% 72% 59% 65% 74% 62% 72% 69% 98% 95% 100% 93%
3DMark - 3DMark Ice Storm Physics
63367 Points (51%)
min: 75967 avg: 78857 median: 78857 (64%) max: 81747 Points
CPU TDP ? TDP 25 W TDP 37 W 78% 93% 100%
3DMark - 3DMark Ice Storm Extreme Physics
84092 Points (68%)
3DMark - 3DMark Ice Storm Unlimited Physics
min: 60620 avg: 65215 median: 65828 (55%) max: 67661 Points
CPU TDP ? TDP 45 W TDP 55 W TDP 60 W TDP 65 W 96% 100% 99% 95% 98%
87410 Points (74%)
CPU TDP ? TDP 37 W TDP 45 W TDP 55 W TDP 60 W TDP 65 W 74% 100% 77% 76% 73% 75%
3DMark - 3DMark Cloud Gate Physics
min: 12097 avg: 14052 median: 14052 (36%) max: 16007 Points
min: 8202 avg: 14143 median: 15133 (38%) max: 16966 Points
CPU TDP ? TDP 31 W TDP 45 W TDP 55 W TDP 60 W TDP 65 W 93% 93% 100% 95% 94% 92%
min: 9155 avg: 11259 median: 11233 (28%) max: 12903 Points
CPU TDP ? TDP 15 W TDP 20 W TDP 23 W TDP 25 W TDP 31 W TDP 37 W TDP 45 W TDP 55 W TDP 60 W TDP 65 W 93% 60% 81% 71% 74% 93% 85% 100% 95% 94% 92%
3DMark - 3DMark Fire Strike Standard Physics
min: 20193 avg: 20887 median: 20887 (37%) max: 21581 Points
min: 15535 avg: 20404 median: 21228 (38%) max: 22530 Points
CPU TDP ? TDP 31 W TDP 45 W TDP 55 W TDP 60 W TDP 65 W 96% 98% 94% 92% 100% 89%
min: 14264 avg: 18380 median: 19207 (34%) max: 20296 Points
CPU TDP ? TDP 15 W TDP 20 W TDP 23 W TDP 25 W TDP 28 W TDP 31 W TDP 37 W TDP 38 W TDP 45 W TDP 55 W TDP 60 W TDP 65 W 96% 67% 91% 77% 83% 89% 98% 93% 95% 94% 92% 100% 89%
3DMark - 3DMark Time Spy CPU
min: 4961 avg: 5989 median: 5988.5 (25%) max: 7016 Points
min: 5192 avg: 8699 median: 8946 (38%) max: 10140 Points
CPU TDP ? TDP 31 W TDP 45 W TDP 55 W TDP 60 W TDP 65 W 87% 60% 89% 86% 100% 88%
min: 4384 avg: 5399 median: 5619 (24%) max: 5891 Points
CPU TDP ? TDP 15 W TDP 20 W TDP 23 W TDP 28 W TDP 31 W TDP 37 W TDP 38 W TDP 45 W TDP 55 W TDP 60 W TDP 65 W 86% 44% 57% 47% 59% 60% 59% 55% 89% 86% 100% 88%
Geekbench 6.2 - Geekbench 6.2 Single-Core
min: 1889 avg: 1895 median: 1894.5 (51%) max: 1900 Points
min: 1913 avg: 1941 median: 1941 (52%) max: 1969 Points
CPU TDP 25 W TDP 31 W TDP 38 W 97% 96% 100%
Geekbench 6.2 - Geekbench 6.2 Multi-Core
min: 5685 avg: 6336 median: 6336 (25%) max: 6987 Points
min: 6099 avg: 6500 median: 6500 (26%) max: 6901 Points
CPU TDP 25 W TDP 31 W TDP 38 W 88% 92% 100%
Geekbench 5.5 - Geekbench 5.1 - 5.4 64 Bit Single-Core
min: 1416 avg: 1438 median: 1437.5 (61%) max: 1459 Points
min: 1233 avg: 1304 median: 1300 (55%) max: 1371 Points
CPU TDP ? TDP 31 W TDP 45 W TDP 55 W TDP 60 W TDP 65 W 90% 100% 94% 94% 91% 91%
min: 1393 avg: 1464 median: 1479 (62%) max: 1498 Points
CPU TDP ? TDP 15 W TDP 20 W TDP 23 W TDP 25 W TDP 28 W TDP 31 W TDP 37 W TDP 38 W TDP 45 W TDP 55 W TDP 60 W TDP 65 W 87% 93% 99% 96% 98% 99% 96% 100% 100% 90% 90% 88% 87%
Geekbench 5.5 - Geekbench 5.1 - 5.4 64 Bit Multi-Core
min: 5972 avg: 6560 median: 6559.5 (12%) max: 7147 Points
min: 5715 avg: 7734 median: 7799 (14%) max: 8620 Points
CPU TDP ? TDP 31 W TDP 45 W TDP 55 W TDP 60 W TDP 65 W 95% 80% 94% 90% 100% 90%
min: 5475 avg: 6121 median: 6390 (11%) max: 6648 Points
CPU TDP ? TDP 15 W TDP 20 W TDP 23 W TDP 25 W TDP 28 W TDP 31 W TDP 37 W TDP 38 W TDP 45 W TDP 55 W TDP 60 W TDP 65 W 95% 70% 79% 67% 69% 81% 80% 78% 80% 94% 90% 100% 90%
Geekbench 5.0 - Geekbench 5.0 64 Bit Single-Core
min: 1188 avg: 1255 median: 1264 (5%) max: 1306 Points
CPU TDP ? TDP 65 W 95% 100%
min: 1312 avg: 1377 median: 1376.5 (6%) max: 1441 Points
CPU TDP ? TDP 20 W TDP 28 W TDP 65 W 86% 91% 100% 91%
Geekbench 5.0 - Geekbench 5.0 64 Bit Multi-Core
min: 6700 avg: 7399 median: 7370 (23%) max: 8130 Points
CPU TDP ? TDP 65 W 89% 100%
min: 6233 avg: 6397 median: 6396.5 (20%) max: 6560 Points
CPU TDP ? TDP 20 W TDP 28 W TDP 65 W 89% 77% 81% 100%
Geekbench 4.4 - Geekbench 4.1 - 4.4 64 Bit Single-Core
min: 5616 avg: 5830 median: 5803 (58%) max: 6016 Points
CPU TDP ? TDP 65 W 100% 99%
Geekbench 4.4 - Geekbench 4.1 - 4.4 64 Bit Multi-Core
min: 28711 avg: 30765 median: 31346 (34%) max: 31934 Points
CPU TDP ? TDP 65 W 95% 100%
Geekbench 4.0 - Geekbench 4.0 64 Bit Single-Core
6013 Points (82%)
Geekbench 4.0 - Geekbench 4.0 64 Bit Multi-Core
30783 Points (75%)
PassMark PerformanceTest 9 - PerformanceTest 9.0 CPU Mark
min: 19061 avg: 19077 median: 19077 (100%) max: 19093 Points
Mozilla Kraken 1.1 - Kraken 1.1 Total Score *
648 ms (1%)
min: 746 avg: 765 median: 757 (1%) max: 848 ms
CPU TDP ? TDP 31 W TDP 45 W TDP 55 W TDP 60 W TDP 65 W 100% 100% 100% 100% 100% 100%
min: 614 avg: 650 median: 629 (1%) max: 770 ms
CPU TDP ? TDP 15 W TDP 20 W TDP 23 W TDP 28 W TDP 31 W TDP 37 W TDP 38 W TDP 45 W TDP 55 W TDP 60 W TDP 65 W 100% 100% 100% 100% 100% 100% 100% 100% 100% 100% 100% 100%
Octane V2 - Octane V2 Total Score
71022 Points (62%)
72262 Points (63%)
CPU TDP 31 W TDP 38 W 98% 100%
WebXPRT 4 - WebXPRT 4 Score
min: 183.4 avg: 205.6 median: 209 (60%) max: 214 Points
CPU TDP 15 W TDP 20 W TDP 23 W TDP 28 W TDP 37 W TDP 38 W 96% 98% 86% 98% 100% 100%
WebXPRT 3 - WebXPRT 3 Score
254 Points (53%)
min: 212 avg: 238.5 median: 239 (50%) max: 262 Points
CPU TDP ? TDP 31 W TDP 45 W TDP 55 W TDP 60 W TDP 65 W 93% 100% 99% 93% 99% 96%
min: 244 avg: 261.5 median: 264 (55%) max: 272 Points
CPU TDP ? TDP 15 W TDP 20 W TDP 23 W TDP 28 W TDP 31 W TDP 37 W TDP 38 W TDP 45 W TDP 55 W TDP 60 W TDP 65 W 87% 94% 98% 90% 100% 93% 99% 96% 92% 86% 92% 90%
CrossMark - CrossMark Overall
1207 Points (46%)
min: 1029 avg: 1228 median: 1231 (47%) max: 1336 Points
CPU TDP 15 W TDP 20 W TDP 23 W TDP 28 W TDP 31 W TDP 37 W TDP 38 W 93% 91% 77% 92% 90% 100% 99%
Power Consumption - Prime95 Power Consumption - external Monitor *
44.2 Watt (8%)
min: 69 avg: 98.9 median: 104.8 (18%) max: 117 Watt
CPU TDP ? TDP 31 W TDP 45 W TDP 60 W 105% 116% 105% 100%
min: 27.5 avg: 41.4 median: 41.8 (7%) max: 52.5 Watt
CPU TDP ? TDP 15 W TDP 20 W TDP 23 W TDP 25 W TDP 28 W TDP 31 W TDP 37 W TDP 38 W TDP 45 W TDP 60 W 105% 119% 117% 116% 118% 116% 116% 114% 114% 105% 100%
Power Consumption - Cinebench R15 Multi Power Consumption - external Monitor *
min: 71 avg: 110.8 median: 117 (21%) max: 138 Watt
CPU TDP ? TDP 45 W TDP 60 W 105% 104% 100%
min: 32.2 avg: 47.1 median: 48.2 (9%) max: 59.9 Watt
CPU TDP ? TDP 20 W TDP 28 W TDP 37 W TDP 38 W TDP 45 W TDP 60 W 105% 122% 120% 117% 116% 104% 100%
Power Consumption - Idle Power Consumption - external Monitor *
7.1 Watt (5%)
min: 3.43 avg: 5.5 median: 6 (4%) max: 7.3 Watt
CPU TDP 15 W TDP 20 W TDP 23 W TDP 25 W TDP 28 W TDP 31 W TDP 37 W TDP 38 W 101% 101% 100% 100% 102% 100% 103% 102%
Power Consumption - Idle Power Consumption 150cd 1min *
9.1 Watt (10%)
min: 5.25 avg: 6.5 median: 6.4 (7%) max: 7.64 Watt
CPU TDP 15 W TDP 20 W TDP 23 W TDP 25 W TDP 28 W TDP 31 W TDP 38 W 104% 103% 105% 102% 104% 100% 103%
Power Consumption - Cinebench R15 Multi Power Efficiency - external Monitor
min: 13.2 avg: 14 median: 13.6 (10%) max: 15.6 Points per Watt
CPU TDP ? TDP 45 W TDP 60 W 100% 96% 93%
min: 26.7 avg: 32 median: 28.8 (21%) max: 40.5 Points per Watt
CPU TDP ? TDP 20 W TDP 37 W TDP 38 W TDP 45 W TDP 60 W 36% 100% 71% 66% 34% 33%
Average Benchmarks AMD Ryzen 7 PRO 7730U → 100% n=19 Average Benchmarks Intel Core i7-10875H → 102% n=19 Average Benchmarks AMD Ryzen 5 7530U → 95% n=19
- Range of benchmark values for this graphics card
- Average benchmark values for this graphics card
* Smaller numbers mean a higher performance
1 This benchmark is not used for the average calculation
v1.28
log 01. 22:32:29
#0 checking url part for id 16350 +0s ... 0s
#1 checking url part for id 11949 +0s ... 0s
#2 checking url part for id 14958 +0s ... 0s
#3 redirected to Ajax server, took 1719865949 +0s ... 0s
#4 did not recreate cache, as it is less than 5 days old! Created at Mon, 01 Jul 2024 05:15:43 +0200 +0s ... 0s
#5 composed specs +0.008s ... 0.008s
#6 did output specs +0s ... 0.008s
#7 getting avg benchmarks for device 16350 +0.002s ... 0.01s
#8 got single benchmarks 16350 +0s ... 0.01s
#9 getting avg benchmarks for device 11949 +0.002s ... 0.012s
#10 got single benchmarks 11949 +0.006s ... 0.017s
#11 getting avg benchmarks for device 14958 +0.004s ... 0.022s
#12 got single benchmarks 14958 +0.013s ... 0.035s
#13 got avg benchmarks for devices +0s ... 0.035s
#14 min, max, avg, median took s +0.056s ... 0.09s
#15 return log +0s ... 0.09s
Please share our article, every link counts!
Redaktion, 2017-09- 8 (Update: 2023-07- 1)
 Deutsch
 English
 Español
 Français
 Italiano
 Nederlands
 Polski
 Português
 Русский
 Türkçe
 Svenska
 Chinese
 Magyar