Notebookcheck Logo

AMD Ryzen 7 7700X vs AMD Ryzen 9 7845HX

AMD Ryzen 7 7700X

► remove from comparison AMD R7 7700X

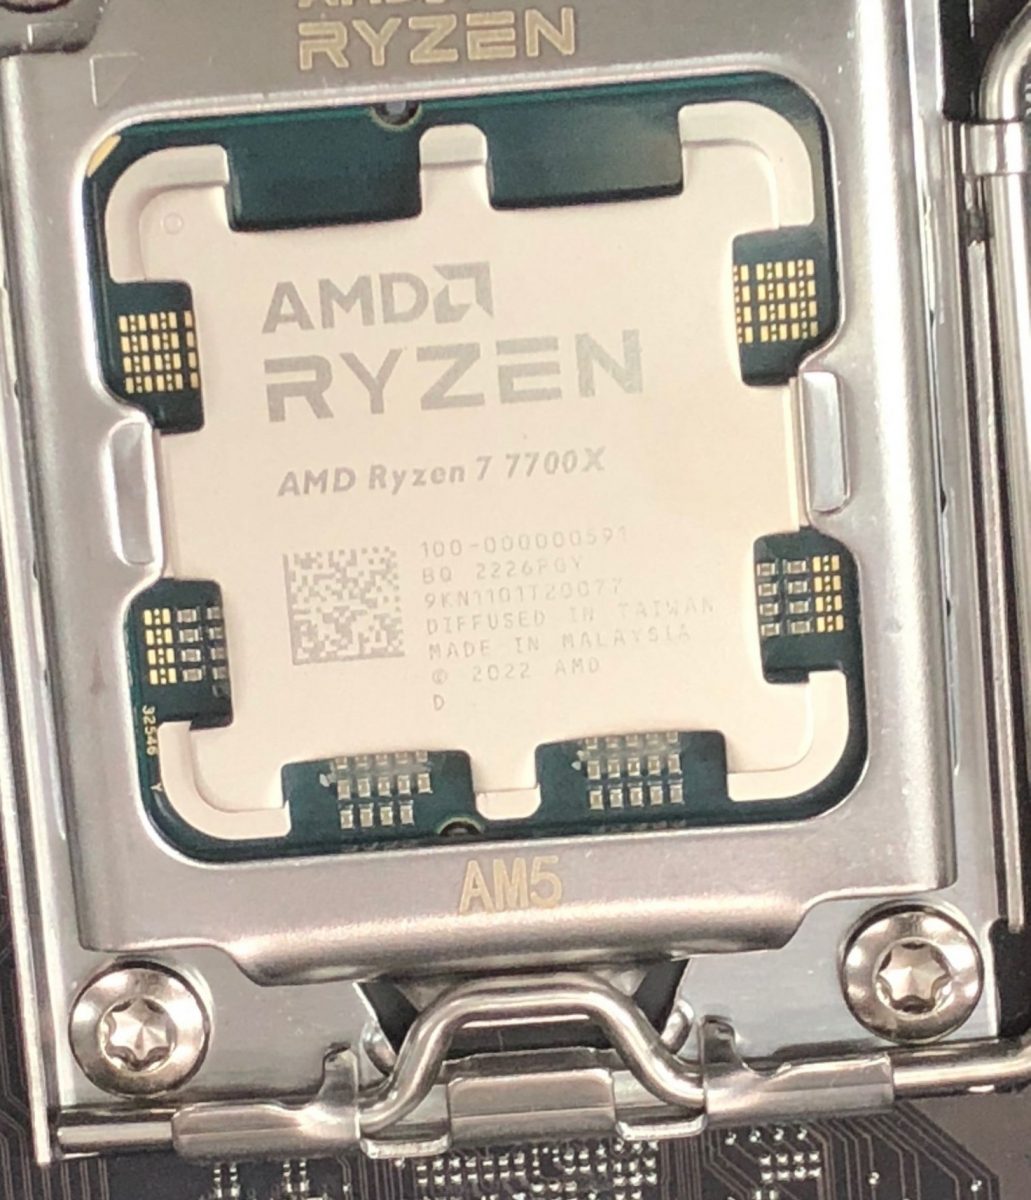
The AMD Ryzen 7 7700X is a fast high-end desktop processor of the Raphael series. It offers 8 cores based on the Zen 4 architecture that supports hyperthreading (16 threads). The cores clock from 4.5 (base) up to 5.4 GHz (single core boost). Compared to the faster Ryzen 9 CPUs (like the 7900X), the R7 offers less cores and slightly lower clock speeds.

The performance of the R7 7700X is clearly better than the old Ryzen 7 of the 5000 generation thanks to the improved architecture and modern 5nm process. Compared to Intels Alder Lake Core i7-12900K the performance is quite similar but stays behind the newer Rocket Lake i5-13600K (multi-threaded).

The Raphael series still uses a chiplet design with two CCD-clusters (each with 8 possible cores, so only one used for the 7700X) in 5nm and an IO-die (including the memory controller and the Radeon Graphics iGPU) in 6nm.

AMD Ryzen 9 7845HX

► remove from comparison AMD R9 7845HX

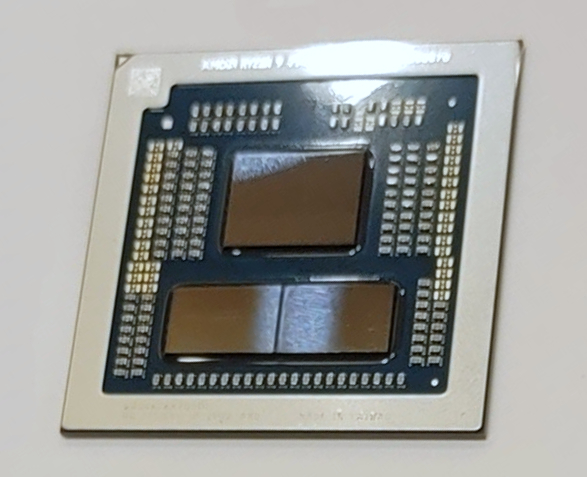
The AMD Ryzen 9 7845HX is a fast high-end laptop processor of the Dragon Range series. It offers 12 of the 16 cores based on the Zen 4 architecture that supports hyperthreading (24 threads). The cores clock from 3 (base) up to 5.2 GHz (single core boost). The 7845HX is the second-fastest mobile Ryzen CPU at launch and derived from the desktop Ryzen 9 7900X.

The Dragon Range series still uses a chiplet design with two CCD-clusters (each with 8 possible cores) in 5nm and an IO-die (including the memory controller and the Radeon 610M iGPU) in 6nm. The chip integrates 4x USB 3.2 Gen2 (10 Gbps) ports (no USB4), 28 PCIe 5.0 lanes (for GPU and SSDs) and a dual-channel DDR5-5200 memory controller.

Performance

The average 7845HX in our database is in the same league as the Core i9-13900HX, as far as multi-thread benchmark scores are concerned. This is a super-fast chip, as of mid 2023; of course, your mileage may vary depending on how competent the cooling solution of your laptop is and how high the CPU power limits are.

The R9 7845HX is rated at a TDP of 55 Watt and can be configured from 45 to 75 Watt (cTDP).

ModelAMD Ryzen 7 7700XAMD Ryzen 9 7845HX
SeriesAMD Raphael (Zen 4, Ryzen 7000)AMD Dragon Range (Zen 4, Ryzen 7045)
CodenameRaphael (Zen4)Dragon Range-HX (Zen 4)
Series: Dragon Range (Zen 4, Ryzen 7045) Dragon Range-HX (Zen 4)
AMD Ryzen 9 7950X3D compare4.2 - 5.7 GHz16 / 32 cores128 MB L3
AMD Ryzen 9 7900X compare4.7 - 5.6 GHz12 / 24 cores64 MB L3
AMD Ryzen 9 7900 compare3.7 - 5.4 GHz12 / 24 cores64 MB L3
AMD Ryzen 7 7700X « 4.5 - 5.4 GHz8 / 16 cores32 MB L3
AMD Ryzen 7 7700 compare3.8 - 5.3 GHz8 / 16 cores32 MB L3
AMD Ryzen 7 7800X3D compare4.2 - 5 GHz8 / 16 cores96 MB L3
AMD Ryzen 5 7600X compare4.7 - 5.3 GHz6 / 12 cores32 MB L3
AMD Ryzen 5 7600 compare3.8 - 5.1 GHz6 / 12 cores32 MB L3
AMD Ryzen 9 7945HX3D compare2.3 - 5.4 GHz16 / 32 cores128 MB L3
AMD Ryzen 9 7945HX compare2.5 - 5.4 GHz16 / 32 cores64 MB L3
AMD Ryzen 9 7940HX compare2.4 - 5.2 GHz16 / 32 cores64 MB L3
AMD Ryzen 9 7845HX « 3 - 5.2 GHz12 / 24 cores64 MB L3
AMD Ryzen 9 7840HX compare2.9 - 5.1 GHz12 / 24 cores64 MB L3
Clock4500 - 5400 MHz3000 - 5200 MHz
L1 Cache512 KB768 KB
L2 Cache8 MB12 MB
L3 Cache32 MB64 MB
Cores / Threads8 / 1612 / 24
12 x 5.2 GHz AMD Zen 4
TDP170 Watt55 Watt
Transistors9.9 Million9900 Million
Technology5 nm, 0.650 - 1.475VCCD = 5 nm, I/O = 6 nm
Die Size2x 70 (CCD) mm2 + 122 (I/O) mm2
max. Temp.95 °C100 °C
SocketAM5 (LGA 1718)FL1
FeaturesMMX(+), SSE, SSE2, SSE3, SSSE3, SSE4.1, SSE4.2, SSE4A, x86-64, AMD-V, AES, AVX, AVX2, AVX512F, FMA3, SHA, Precision Boost 2DDR5-5200 RAM, PCIe 5, MMX, SSE, SSE2, SSE3, SSSE3, SSE4A, SSE4.1, SSE4.2, AVX, AVX2, AVX-512, BMI2, ABM, FMA, ADX, SMEP, SMAP, SMT, CPB, AES-NI, RDRAND, RDSEED, SHA, SME
iGPUAMD Radeon Graphics (Ryzen 7000) (400 - 2200 MHz)AMD Radeon 610M (400 - 2200 MHz)
Architecturex86x86
Announced
Manufacturerwww.amd.comwww.amd.com

Benchmarks

Performance Rating - CB R15 + R20 + 7-Zip + X265 + Blender + 3DM11 CPU - R7 7700X
51.5 pt (71%)
Performance Rating - CB R15 + R20 + 7-Zip + X265 + Blender + 3DM11 CPU - R9 7845HX
51.8 pt (72%)
Cinebench R23 - Cinebench R23 Multi Core
min: 18667     avg: 19088     median: 19088 (18%)     max: 19509 Points
26876 Points (25%)
Cinebench R23 - Cinebench R23 Single Core
min: 1986     avg: 1987     median: 1987 (85%)     max: 1988 Points
1852 Points (79%)
Cinebench R20 - Cinebench R20 CPU (Single Core)
min: 772     avg: 773     median: 772.5 (86%)     max: 773 Points
719 Points (80%)
Cinebench R20 - Cinebench R20 CPU (Multi Core)
min: 7308     avg: 7463     median: 7462.5 (18%)     max: 7617 Points
10492 Points (26%)
Cinebench R15 - Cinebench R15 CPU Multi 64 Bit
min: 3036     avg: 3114     median: 3113.5 (20%)     max: 3191 Points
4320 Points (27%)
Cinebench R15 - Cinebench R15 CPU Single 64 Bit
min: 314     avg: 315     median: 315 (95%)     max: 316 Points
295 Points (89%)
Cinebench R11.5 - Cinebench R11.5 CPU Multi 64 Bit
36.1 Points (47%)
Cinebench R11.5 - Cinebench R11.5 CPU Single 64 Bit
3.7 Points (92%)
Cinebench R10 - Cinebench R10 Rend. Single (32bit)
8633 Points (52%)
Cinebench R10 - Cinebench R10 Rend. Multi (32bit)
56024 Points (41%)
wPrime 2.10 - wPrime 2.0 1024m *
61.1 s (1%)
wPrime 2.10 - wPrime 2.0 32m *
2.2 s (0%)
WinRAR - WinRAR 4.0
14879 Points (24%)
7-Zip 18.03 - 7-Zip 18.03 Multli Thread 4 runs
min: 85624     avg: 85707     median: 85706.5 (49%)     max: 85789 MIPS
106033 MIPS (61%)
7-Zip 18.03 - 7-Zip 18.03 Single Thread 4 runs
min: 8052     avg: 8074     median: 8074 (97%)     max: 8096 MIPS
7018 MIPS (84%)
X264 HD Benchmark 4.0 - x264 Pass 2
181.2 fps (63%)
X264 HD Benchmark 4.0 - x264 Pass 1
373.5 fps (86%)
HWBOT x265 Benchmark v2.2 - HWBOT x265 4k Preset
min: 24.8     avg: 25.5     median: 25.5 (45%)     max: 26.1 fps
29.7 fps (52%)
TrueCrypt - TrueCrypt Serpent
1.4 GB/s (0%)
TrueCrypt - TrueCrypt Twofish
2.3 GB/s (40%)
TrueCrypt - TrueCrypt AES
17.5 GB/s (46%)
Blender - Blender 3.3 Classroom CPU *
min: 255     avg: 261     median: 261 (3%)     max: 267 Seconds
185 Seconds (2%)
Blender - Blender 2.79 BMW27 CPU *
min: 160     avg: 163     median: 163 (1%)     max: 166 Seconds
117 Seconds (1%)
R Benchmark 2.5 - R Benchmark 2.5 *
min: 0.3758     avg: 0.4     median: 0.4 (8%)     max: 0.383 sec
0.4 sec (9%)
3DMark 06 - CPU - 3DMark 06 - CPU
18115 Points (39%)
Super Pi mod 1.5 XS 1M - Super Pi mod 1.5 XS 1M *
6.3 s (1%)
Super Pi mod 1.5 XS 2M - Super Pi mod 1.5 XS 2M *
13.6 s (1%)
Super Pi Mod 1.5 XS 32M - Super Pi mod 1.5 XS 32M *
322.8 s (1%)
3DMark 11 - 3DM11 Performance Physics
31467 Points (85%)
22073 Points (60%)
3DMark - 3DMark Fire Strike Standard Physics
35357 Points (63%)
36557 Points (65%)
3DMark - 3DMark Time Spy CPU
14182 Points (60%)
11961 Points (50%)
Geekbench 6.2 - Geekbench 6.2 Single-Core
2729 Points (73%)
Geekbench 6.2 - Geekbench 6.2 Multi-Core
12585 Points (50%)
Geekbench 5.5 - Geekbench 5.1 - 5.4 64 Bit Single-Core
2218 Points (94%)
2008 Points (85%)
Geekbench 5.5 - Geekbench 5.1 - 5.4 64 Bit Multi-Core
min: 13889     avg: 14131     median: 14131 (25%)     max: 14373 Points
15068 Points (27%)
Geekbench 5.0 - Geekbench 5.0 64 Bit Single-Core
2123 Points (9%)
Geekbench 5.0 - Geekbench 5.0 64 Bit Multi-Core
14215 Points (45%)
Geekbench 4.4 - Geekbench 4.1 - 4.4 64 Bit Single-Core
8991 Points (90%)
Geekbench 4.4 - Geekbench 4.1 - 4.4 64 Bit Multi-Core
56909 Points (62%)
Mozilla Kraken 1.1 - Kraken 1.1 Total Score *
440 ms (1%)
475 ms (1%)
WebXPRT 4 - WebXPRT 4 Score
301 Points (86%)
282 Points (81%)
WebXPRT 3 - WebXPRT 3 Score
355 Points (74%)
357 Points (74%)
CrossMark - CrossMark Overall
min: 2297     avg: 2313     median: 2312.5 (89%)     max: 2328 Points
1992 Points (76%)
Power Consumption - Prime95 Power Consumption - external Monitor *
min: 189.8     avg: 209.9     median: 209.9 (36%)     max: 230 Watt
190.6 Watt (33%)
Power Consumption - Cinebench R15 Multi Power Consumption - external Monitor *
min: 196.1     avg: 218.1     median: 218.1 (40%)     max: 240 Watt
207 Watt (38%)
Power Consumption - Idle Power Consumption - external Monitor *
min: 89.8     avg: 94     median: 94 (62%)     max: 98.2 Watt
39.7 Watt (26%)
Power Consumption - Idle Power Consumption 150cd 1min *
41.9 Watt (46%)
Power Consumption - Cinebench R15 Multi Power Efficiency - external Monitor
min: 13.3     avg: 14.4     median: 14.4 (11%)     max: 15.5 Points per Watt
20.9 Points per Watt (16%)

Average Benchmarks AMD Ryzen 7 7700X → 100% n=21

Average Benchmarks AMD Ryzen 9 7845HX → 103% n=21

- Range of benchmark values for this graphics card
- Average benchmark values for this graphics card
* Smaller numbers mean a higher performance
1 This benchmark is not used for the average calculation

Add one or more devices and compare

In the following list you can select (and also search for) devices that should be added to the comparison. You can select more than one device.

restrict list:

show all (including archived), 2024, 2023
v1.28
log 01. 22:37:49

#0 checking url part for id 14655 +0s ... 0s

#1 checking url part for id 14938 +0s ... 0s

#2 redirected to Ajax server, took 1719866269 +0s ... 0s

#3 did not recreate cache, as it is less than 5 days old! Created at Mon, 01 Jul 2024 05:15:43 +0200 +0s ... 0s

#4 composed specs +0.006s ... 0.006s

#5 did output specs +0s ... 0.006s

#6 getting avg benchmarks for device 14655 +0.003s ... 0.009s

#7 got single benchmarks 14655 +0.004s ... 0.014s

#8 getting avg benchmarks for device 14938 +0.003s ... 0.017s

#9 got single benchmarks 14938 +0.005s ... 0.022s

#10 got avg benchmarks for devices +0s ... 0.022s

#11 min, max, avg, median took s +0.032s ... 0.053s

#12 return log +0.002s ... 0.056s

Please share our article, every link counts!
> Expert Reviews and News on Laptops, Smartphones and Tech Innovations > Benchmarks / Tech > Processor Comparison - Head 2 Head
Redaktion, 2017-09- 8 (Update: 2023-07- 1)