The AMD Ryzen 7 7700 is a fast high-end desktop processor of the Raphael series. It offers 8 cores based on the Zen 4 architecture that supports hyperthreading (16 threads). The cores clock from 3.8 (base) up to 5.3 GHz (single core boost). Compared to the faster Ryzen 9 CPUs (like the 7900X), the R7 offers less cores and slightly lower clock speeds.
The performance of the R7 7700 is slightly below the higher clocked AMD R7 7700X (that also features a higher TDP).
The Raphael series still uses a chiplet design with two CCD-clusters (each with 8 possible cores, so only one used for the 7700X) in 5nm and an IO-die (including the memory controller and the Radeon Graphics iGPU) in 6nm.
The Ryzen 7 7700 is rated at a TDP of only 65 Watt and therefore suited for smaller desktops (and cooling solutions).
The Apple M2 Pro 10-Core is a System on a Chip (SoC) from Apple that is found in the early 2023 MacBook Pro 14 and Mac Mini entry level models. It offers 10 of the 12 cores available in the chip divided in six performance cores (P-cores) and four power-efficiency cores (E-cores). The E-cores clock with up to 3.4 GHz, the P-Cores up to 3.7 GHz (mostly 3.3 GHz in multi-threaded workloads and 3.4 GHz in single threaded).
The big cores (codename Avalanche) offer 192 KB instruction cache, 128 KB data cache, and 36 MB shared L2 cache (up from 24 MB in the M1 Pro). The four efficiency cores (codename Blizzard) are a lot smaller and offer only 128 KB instruction cache, 64 KB data cache, and 4 MB shared cache. CPU and GPU can both use the 24 MB SLC (System Level Cache).
The unified memory (16 or 32 GB LPDDR5-6400) next to the chip is connected by a 256 Bit memory controller (200 GB/s bandwidth) and can be used by the GPU and CPU.
The performance of the M2 Pro 10-Core should be similar to the old M1 Pro with all 10 cores. The multi-threaded performance should be slower, as the M2 10-core has two p-cores less (and 2 e-cores more) but the single-threaded performance should be better due to the faster clock speed and architectural improvements. The old M1 Pro 8-core should be noticeably slower.
The integrated graphics card in the M1 Pro 10-core offers all 16 of the 19 cores.
Furthermore, the SoC integrates a fast 16 core neural engine (faster than M1 Pro), a secure enclave (e.g., for encryption), a unified memory architecture, Thunderbolt 4 controller, an ISP, and media de- and encoders (including ProRes).
The M2 Pro is manufactured in 5 nm at TSMC (second generation) and integrates 40 billion transistors.
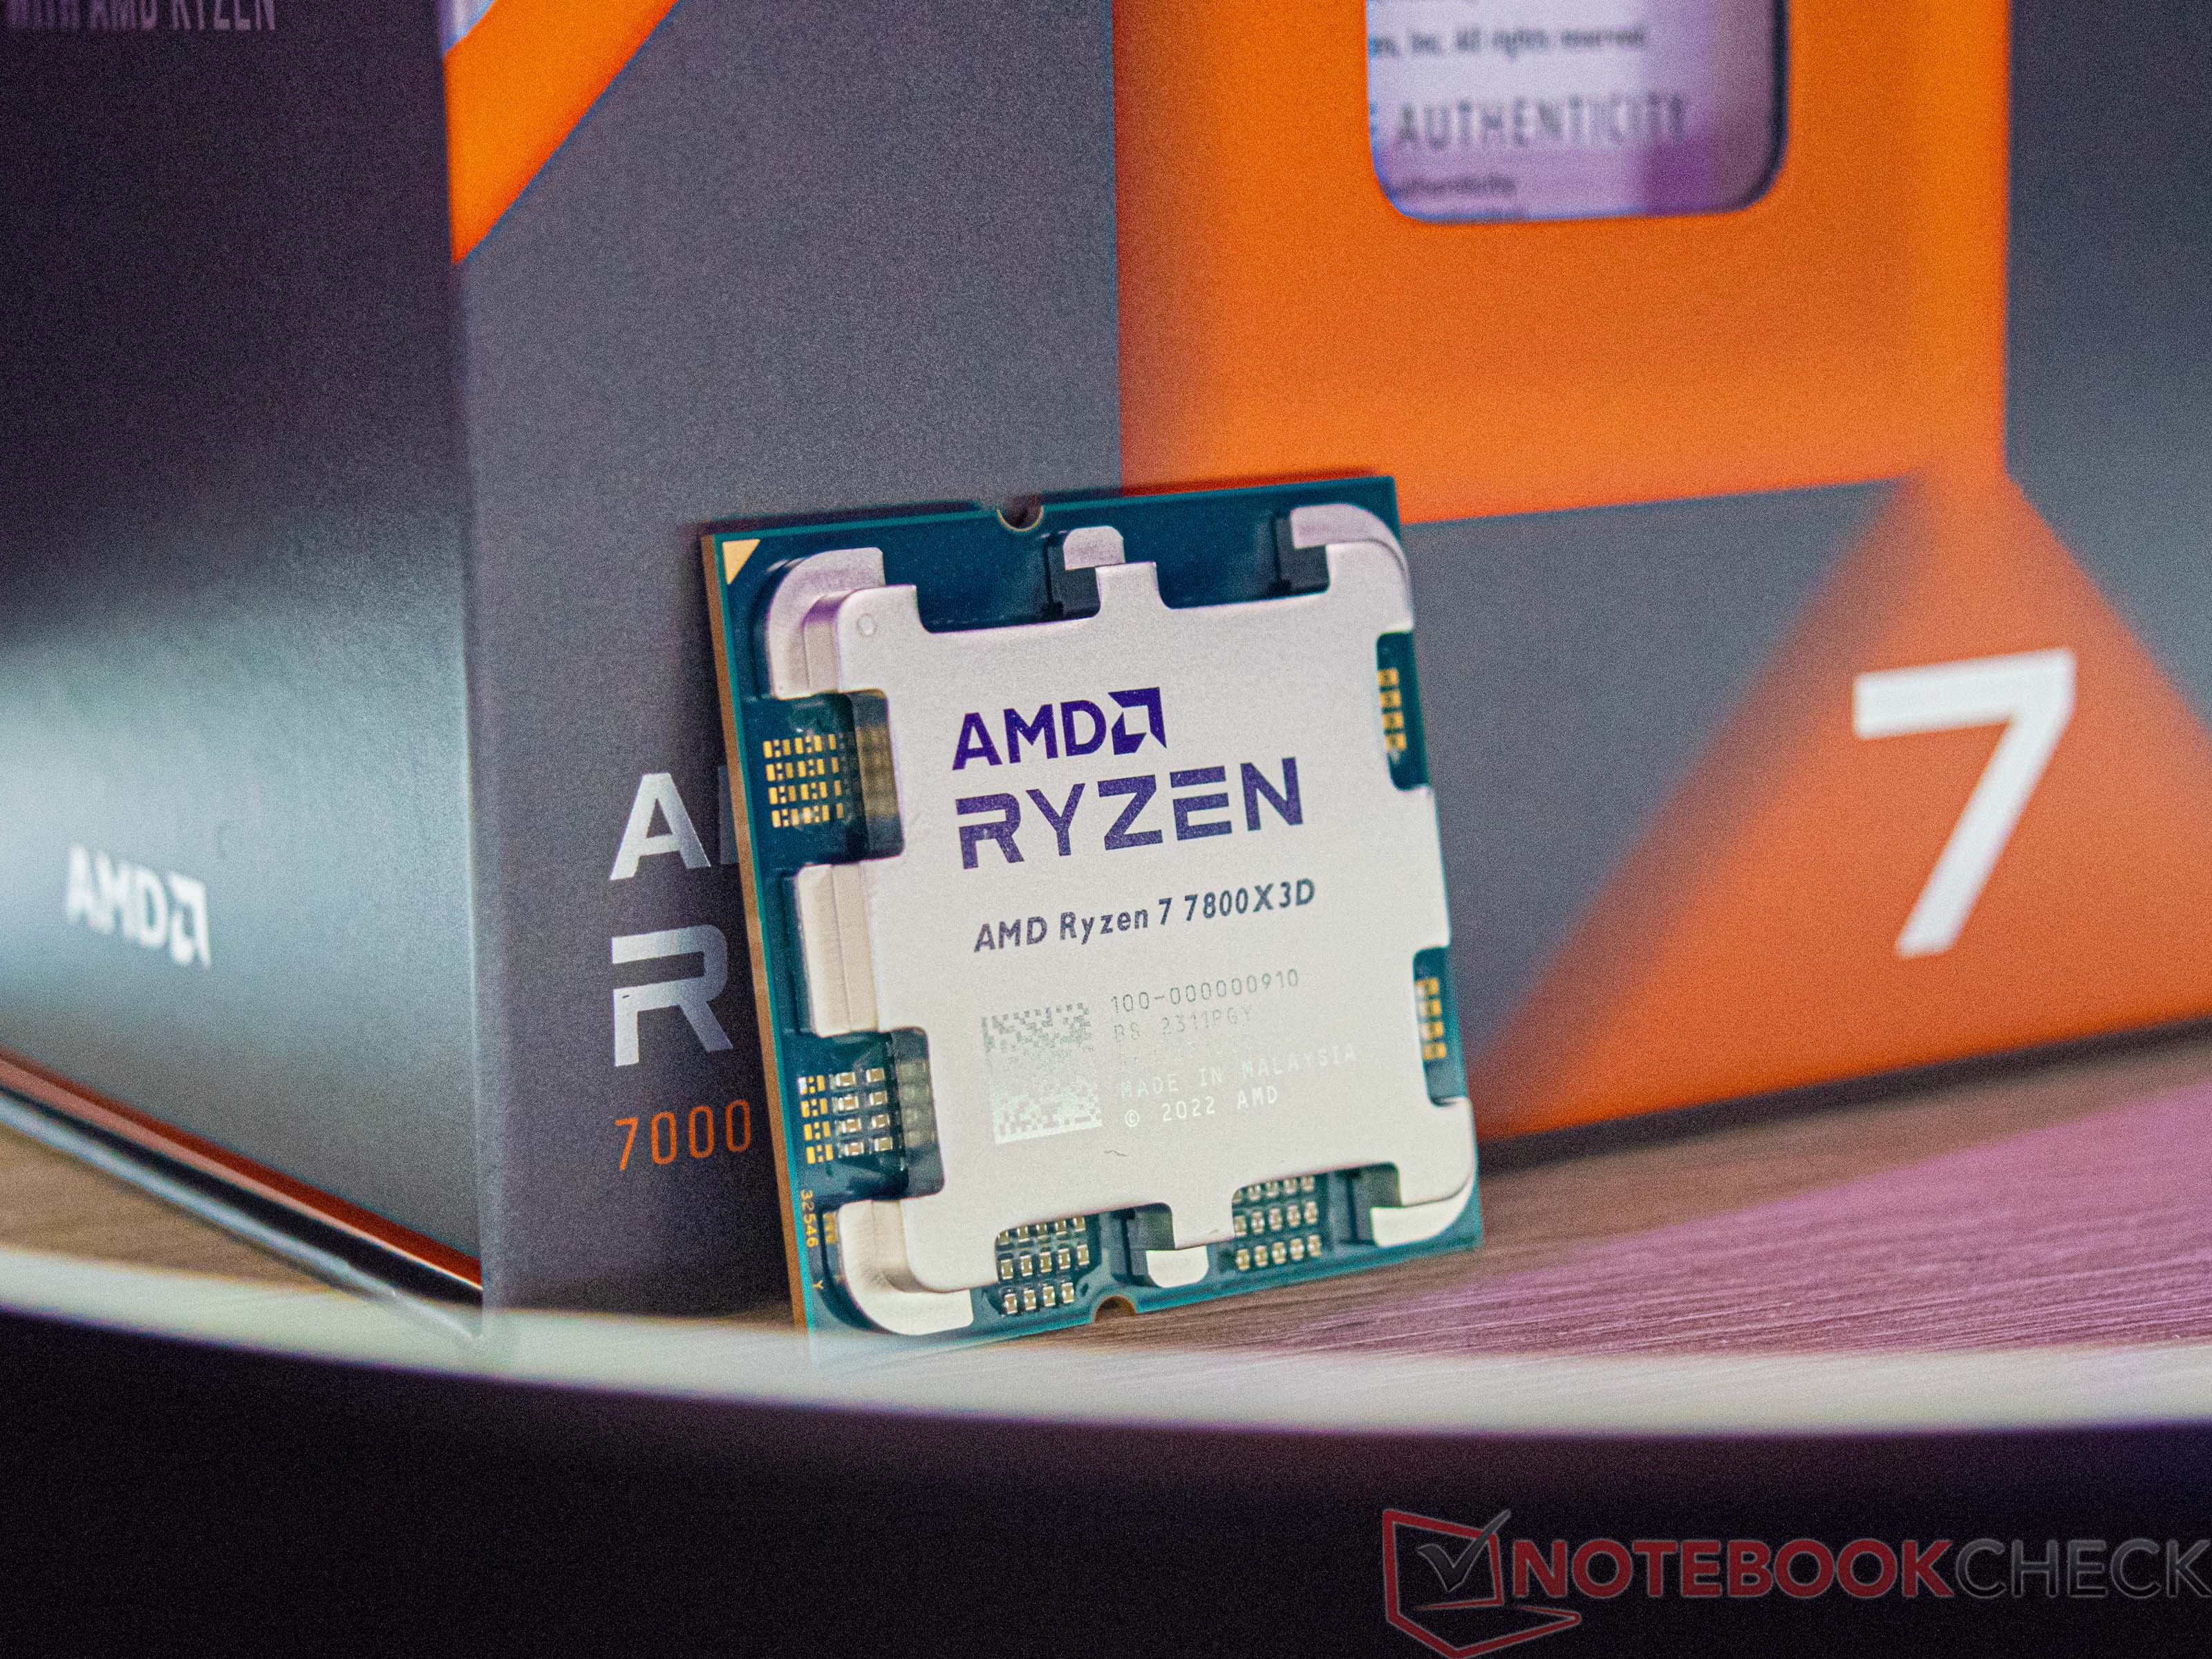
The AMD Ryzen 7 7800X3D is a high-end desktop processor from the Raphael series with 8 Zen 4 cores and SMT (Simultaneous Multithreading), allowing it to handle up to 16 threads simultaneously. After its announcement in January 2023 at CES in Las Vegas, it was launched in April 2023. Following the launch of the two top models, the AMD Ryzen 9 7900X3D and the AMD Ryzen 9 7950X3D, the third model was introduced, which offers significantly more gaming performance with the 3D V-Cache.
The CPU cores have a base clock of 4.2 GHz and can be boosted up to 5 GHz (single-core turbo). The AMD Ryzen 7 7800X3D features a CCD with 8 cores, which includes the fast 3D V-Cache. This differs significantly from the two Ryzen 9 models, as they have two CCDs, but only one of them can utilize the 3D V-Cache.
The performance of the AMD Ryzen 7 7800X3D is consistently good, although its multi-threaded performance suffers a bit due to the eight native compute cores. However, the real strength of the AMD Ryzen 7 7800X3D lies in gaming performance, where it excels. In tests, we see consistently high gaming performance, even surpassing that of an Intel Core i9-13900K.
In terms of power consumption, the AMD Ryzen 7 7800X3D aligns with the other two models featuring 3D V-Cache, making the 8-core processor extremely power-efficient. In numbers, this means that the AMD Ryzen 7 7800X3D is specified with a TDP of up to 120 watts. The PPT (Package Power Tracking) is also rated up to 162 watts. For comparison, an AMD Ryzen 9 7950X is specified with 170 watts (TDP) or 230 watts (PPT).
- Range of benchmark values for this graphics card - Average benchmark values for this graphics card * Smaller numbers mean a higher performance 1 This benchmark is not used for the average calculation
v1.28
log 03. 09:32:18
#0 checking url part for id 14944 +0s ... 0s
#1 checking url part for id 14977 +0s ... 0s
#2 checking url part for id 15064 +0s ... 0s
#3 redirected to Ajax server, took 1719991938 +0s ... 0s
#4 did not recreate cache, as it is less than 5 days old! Created at Mon, 01 Jul 2024 05:15:43 +0200 +0s ... 0s
#5 composed specs +0.007s ... 0.007s
#6 did output specs +0s ... 0.007s
#7 getting avg benchmarks for device 14944 +0.004s ... 0.011s
#8 got single benchmarks 14944 +0.004s ... 0.014s
#9 getting avg benchmarks for device 14977 +0.001s ... 0.015s
#10 got single benchmarks 14977 +0.004s ... 0.019s
#11 getting avg benchmarks for device 15064 +0.004s ... 0.023s
#12 got single benchmarks 15064 +0.006s ... 0.028s
#13 got avg benchmarks for devices +0s ... 0.028s
#14 min, max, avg, median took s +0.054s ... 0.083s
 Deutsch
 English
 Español
 Français
 Italiano
 Nederlands
 Polski
 Português
 Русский
 Türkçe
 Svenska
 Chinese
 Magyar