Notebookcheck Logo

AMD Ryzen 7 5800X vs Intel Core i7-14650HX vs Intel Core i9-14900HX

AMD Ryzen 7 5800X

► remove from comparison AMD R7 5800X

The AMD Ryzen 7 5800X is an 8-core desktop processor with Simultaneous Multithreading (SMT), which allows it to process 16 threads simultaneously. With its launch on 08.10.2020, it is the fastest 8-core processor from AMD. The second fastest 8-core processor will be the AMD Ryzen 7 3800XT, followed by the more economical AMD Ryzen 7 3700X, also with 8 cores and 16 threads.

The Ryzen 7 5800X clocks with a base clock of 3.8 GHz and reaches up to 4.7 GHz on one core in turbo mode. When all 8 cores are utilized, the AMD Ryzen 7 5800X, like the AMD Ryzen 9 5900X, achieves up to 4.5 GHz.

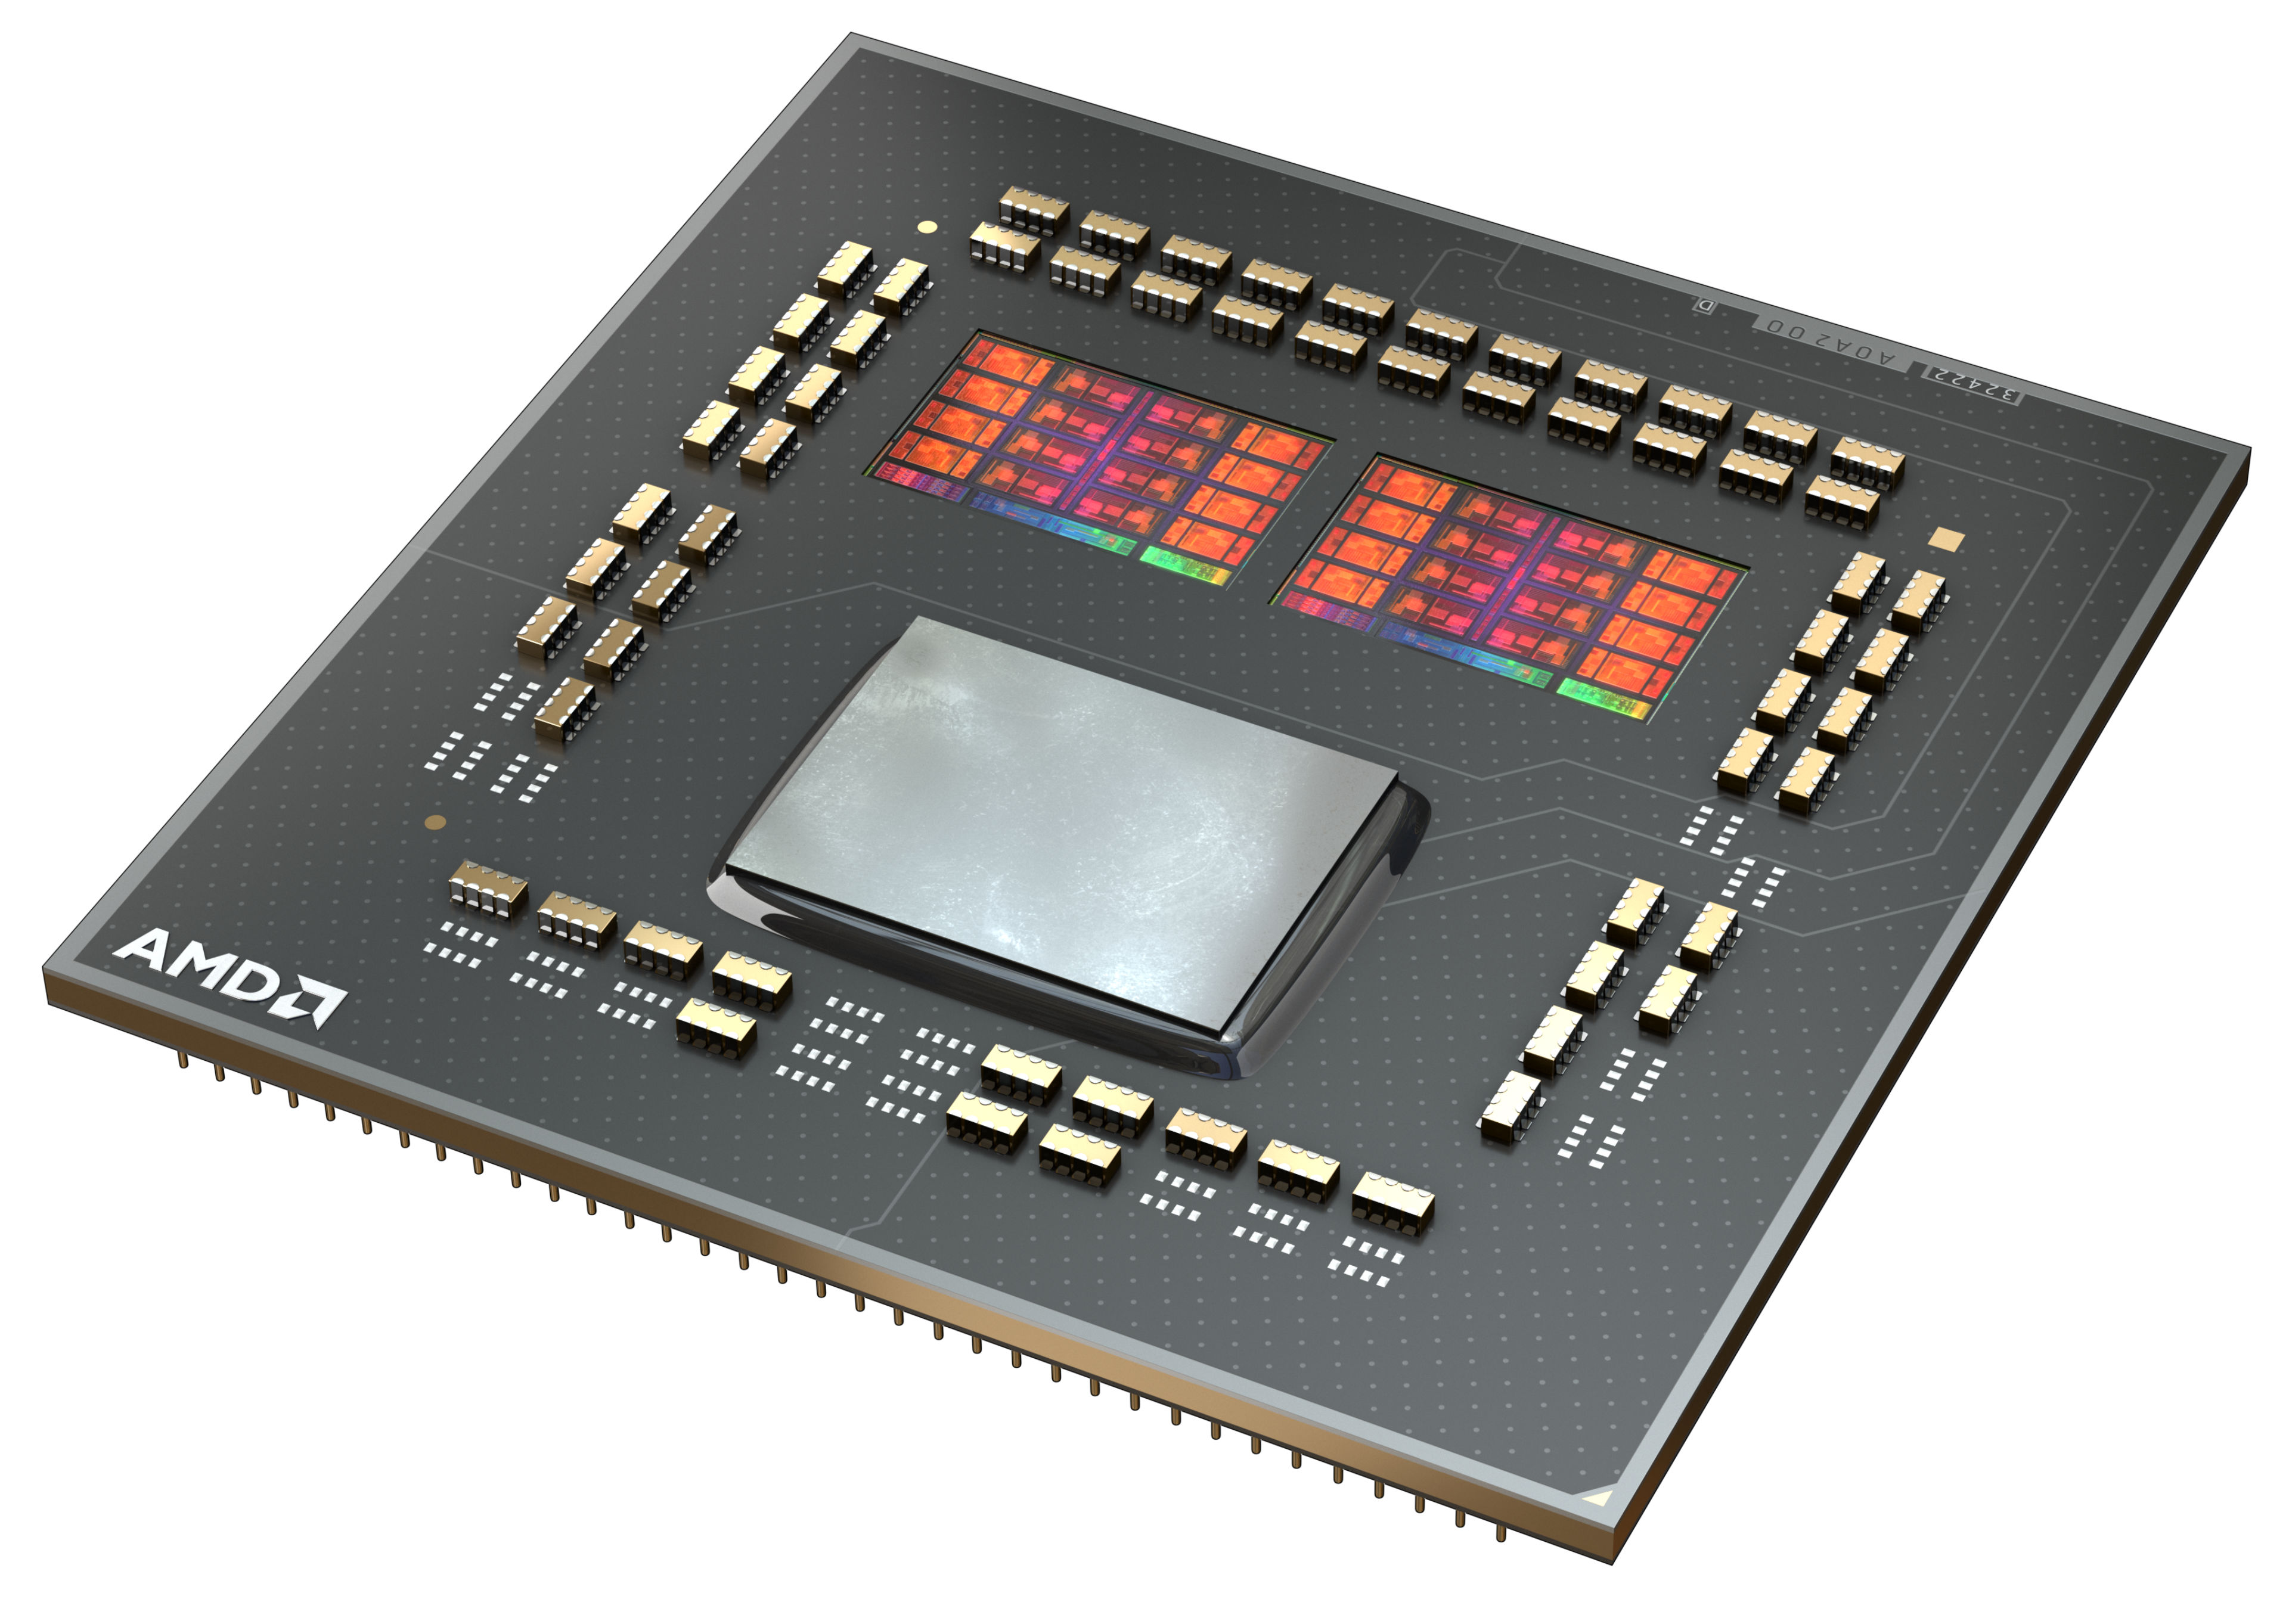
At first glance, the internal structure of the processor has not changed fundamentally. The CCX structure has changed somewhat compared to Zen2, because now a CCX consists of up to 8-CPU cores. So each individual core can access the complete L3 cache (32 MByte). Furthermore the CCX modules are connected to each other via the same I/O die, which we already know from Zen2. According to AMD, the Infinity-Fabric should now reach clock rates of up to 2Ghz, which in turn allows a RAM clock of 4.000 MHz without performance loss.

Performance

The average 5800X in our database is in the same league as the Core i9-10900K and also the Core i7-12700F, as far as multi-thread benchmark scores are concerned.

In games, AMD's Ryzen 7 5800X can convince with its significantly improved IPC and even put Intel in its place. With the AMD Ryzen 7 5800X, gamers are well prepared for the future as simultaneous streaming is no problem with the new Ryzen 7 5800X. Semi-professional content creators, who need even more power, can choose a Ryzen 9 5900X or the Ryzen 9 5950X on the shelf.

Power consumption

The Ryzen 7 has a default TDP (also known as the long-term power limit) of 105 W. This applies as long as the CPU runs at stock clock speeds.

Ryzen 7 5800X is built with TSMC's 7 nm process; as rumors have it, the I/O die is manufactured separately on the 12 nm Global Foundries process.

Intel Core i7-14650HX

► remove from comparison Intel i7-14650HX

The Intel Core i7-14650HX is a high-end CPU based on the new Raptor Lake architecture for large and heavy notebooks. The CPU was introduced at the beginning of 2024 and is similar to the older Core i7-13700HX except for slightly higher CPU clock rates (max 200 MHz).

The total of 24 threads are divided into P-cores and E-cores, which we already know from Alder-Lake. The 13700HX offers 8 performance cores (P-cores) with hyperthreading and 8 efficiency cores (E-cores) without hyperthreading. A total of 20 threads are therefore supported. The P-cores clock from 2.2 to 5.2 GHz (single core) or 4.5 GHz (all cores) and the E-cores from 1.6 to 3.7 GHz. The integrated memory controller supports a maximum of DDR5 with 4800 MHz (and not 5600 MHz like the i9 HX models).

Compared to Alder Lake, the new Raptor Lake architecture offers improved P-cores (Raptor Cove architecture with more cache), more E-cores (same Gracemont architecture) and higher clock rates thanks to the improved Intel 7 process. Furthermore, Intel now supports faster DDR5 main memory in the top models (up to 5600 MHz in the i9).

The performance should be slightly above the older Core i7-13700HX (with the same TDP settings and cooling). This makes the CPU ideal for demanding tasks and games.

The 14650HX continues to be manufactured using Intel's improved 10nm FinFET process (Intel 7 process) and is specified with 55 watts of base power and 157 watts of turbo power.

Intel Core i9-14900HX

► remove from comparison Intel i9-14900HX

The Intel Core i9-14900HX is a high-end CPU based on the Raptor Lake architecture for large and heavy notebooks. The CPU was introduced at the beginning of 2024 and is a slightly higher clocked variant of the older Core i9-13980HX.

The total of 32 threads are divided into P-cores and E-cores, which we already know from Alder-Lake. Here, 8 performance cores (P-cores) with hyperthreading are used and 16 efficiency cores, so that a total of 32 threads can be processed simultaneously. The P-cores clock from 2.2 GHz (base clock) to 5.8 GHz (single-core turbo) and the E-cores from 1.6 GHz to 4.1 GHz.

Performance

Due to the slightly higher maximum clock rates, the single-core performance of the 14900HX in particular increases slightly compared to the 13980HX. Compared to AMD's top model, the Ryzen 9 7945HX or 7945HX3D the 14900HX comes in just behind (on average in our benchmarks). However, the performance depends on the benchmark and the cooling and is usually very comparable.

Graphics

Like the Intel Core i9-12900HX, the Intel Core i9-14900HX offers an integrated graphics unit. The Intel Iris XE architecture continues to serve as the basis. In terms of performance, however, not much has changed with the Intel UHD Graphics 770.

The 14900HX is manufactured on the improved 10nm FinFET process at Intel (Intel 7 process) and is specified with 55 watts of base power and 157 watts of turbo power.

ModelAMD Ryzen 7 5800XIntel Core i7-14650HXIntel Core i9-14900HX
SeriesAMD Vermeer (Ryzen 5000)Intel Raptor Lake-HXIntel Raptor Lake-HX
CodenameVermeer (Zen 3)Raptor Lake-HX RefreshRaptor Lake-HX Refresh
Series: Raptor Lake-HX Raptor Lake-HX Refresh
AMD Ryzen 9 5950X3.4 - 4.9 GHz16 / 32 cores64 MB L3
AMD Ryzen 7 5800X « 3.8 - 4.7 GHz8 / 16 cores32 MB L3
AMD Ryzen 7 5700X3.4 - 4.6 GHz8 / 16 cores32 MB L3
AMD Ryzen 5 5600X3.7 - 4.6 GHz6 / 12 cores32 MB L3
Intel Core i9-14900HX1.6 - 5.8 GHz24 / 32 cores36 MB L3
Intel Core i7-14700HX3.9 - 5.5 GHz20 / 28 cores30 MB L3
Intel Core i7-14650HX « 1.6 - 5.2 GHz16 / 24 cores30 MB L3
Intel Core i5-14500HX1.8 - 5 GHz14 / 20 cores24 MB L3
Intel Core i5-14450HX1.8 - 4.8 GHz10 / 16 cores20 MB L3
Intel Core i9-14900HX « 1.6 - 5.8 GHz24 / 32 cores36 MB L3
Intel Core i7-14700HX3.9 - 5.5 GHz20 / 28 cores30 MB L3
Intel Core i7-14650HX1.6 - 5.2 GHz16 / 24 cores30 MB L3
Intel Core i5-14500HX1.8 - 5 GHz14 / 20 cores24 MB L3
Intel Core i5-14450HX1.8 - 4.8 GHz10 / 16 cores20 MB L3
Clock3800 - 4700 MHz1600 - 5200 MHz1600 - 5800 MHz
L1 Cache512 KB
L2 Cache4 MB24 MB32 MB
L3 Cache32 MB30 MB36 MB
Cores / Threads8 / 1616 / 24
8 x 5.2 GHz Intel Raptor Cove P-Core
8 x 3.7 GHz Intel Gracemont E-Core
24 / 32
8 x 5.8 GHz Intel Raptor Cove P-Core
16 x 4.1 GHz Intel Gracemont E-Core
TDP105 Watt55 Watt55 Watt
Technology7 nm10 nm10 nm
Die Size2 x 80.7 sq. mm; I/O = 125 mm2257 mm2257 mm2
max. Temp.90 °C100 °C100 °C
SocketAM4 (LGA1331)BGA1964BGA1964
FeaturesDDR4-3200 RAM, PCIe 4, MMX (+), SSE, SSE2, SSE3, SSSE3, SSE4.1, SSE4.2, SSE4A, AES, AVX, AVX2, FMA3, SHADDR4-3200/DDR5-4800 RAM, PCIe 5, Thr. Director, DL Boost, GNA, MMX, SSE, SSE2, SSE3, SSSE3, SSE4.1, SSE4.2, AVX, AVX2, BMI2, ABM, FMA, ADX, VMX, SMEP, SMAP, EIST, TM1, TM2, HT, Turbo, SST, AES-NI, RDRAND, RDSEED, SHADDR4-3200/DDR5-5600 RAM, PCIe 5, Thr. Dir., DL B., GNA, MMX, SSE, SSE2, SSE3, SSSE3, SSE4.1, SSE4.2, AVX, AVX2, BMI2, ABM, FMA, ADX, VMX, SMEP, SMAP, EIST, TM1, TM2, HT, Turbo, SST, AES-NI, RDRAND, RDSEED, SHA
Architecturex86x86x86
$449 U.S.
Announced
Manufacturerwww.amd.comark.intel.comark.intel.com
TDP Turbo PL2157 Watt157 Watt
iGPUIntel UHD Graphics 770 ( - 1600 MHz)Intel UHD Graphics Xe 32EUs (Tiger Lake-H) ( - 1650 MHz)

Benchmarks

Performance Rating - CB R15 + R20 + 7-Zip + X265 + Blender + 3DM11 CPU - R7 5800X
44.8 pt (62%)
Performance Rating - CB R15 + R20 + 7-Zip + X265 + Blender + 3DM11 CPU - i7-14650HX
50 pt (69%)
Performance Rating - CB R15 + R20 + 7-Zip + X265 + Blender + 3DM11 CPU - i9-14900HX
55.4 pt (77%)
Cinebench 2024 - Cinebench 2024 CPU Single Core
117 Points (81%)
min: 120.1     avg: 128.1     median: 129.7 (90%)     max: 131.7 Points
Cinebench 2024 - Cinebench 2024 CPU Multi Core
1235 Points (23%)
min: 1107     avg: 1634     median: 1718 (32%)     max: 2071 Points
Cinebench R23 - Cinebench R23 Multi Core
min: 15241     avg: 15476     median: 15476 (14%)     max: 15711 Points
24455 Points (23%)
min: 20702     avg: 29638     median: 30560 (28%)     max: 36249 Points
Cinebench R23 - Cinebench R23 Single Core
min: 1554     avg: 1575     median: 1574.5 (67%)     max: 1595 Points
1963 Points (83%)
min: 1720     avg: 2160     median: 2194 (93%)     max: 2235 Points
Cinebench R20 - Cinebench R20 CPU (Single Core)
min: 624     avg: 625     median: 624.5 (69%)     max: 625 Points
754 Points (84%)
min: 657     avg: 827     median: 836.5 (93%)     max: 859 Points
Cinebench R20 - Cinebench R20 CPU (Multi Core)
min: 6068     avg: 6075     median: 6074.5 (15%)     max: 6081 Points
9349 Points (23%)
min: 8427     avg: 11271     median: 11619 (28%)     max: 13832 Points
Cinebench R15 - Cinebench R15 CPU Multi 64 Bit
min: 2601     avg: 2609     median: 2608.5 (16%)     max: 2616 Points
3799 Points (24%)
min: 3263     avg: 4503     median: 4611 (29%)     max: 5589 Points
Cinebench R15 - Cinebench R15 CPU Single 64 Bit
min: 265     avg: 265.5     median: 265.5 (80%)     max: 266 Points
287 Points (86%)
min: 247     avg: 306.7     median: 311 (94%)     max: 320 Points
Cinebench R11.5 - Cinebench R11.5 CPU Multi 64 Bit
29.3 Points (38%)
43.9 Points (57%)
Cinebench R11.5 - Cinebench R11.5 CPU Single 64 Bit
3.1 Points (77%)
3.4 Points (85%)
Cinebench R10 - Cinebench R10 Rend. Single (32bit)
6835 Points (41%)
15819 Points (96%)
Cinebench R10 - Cinebench R10 Rend. Multi (32bit)
45548 Points (33%)
112749 Points (82%)
Cinebench R10 - Cinebench R10 Rend. Multi (64bit)
83426 Points (58%)
Cinebench R10 - Cinebench R10 Rend. Single (64bit)
13039 Points (16%)
wPrime 2.10 - wPrime 2.0 1024m *
86.1 s (1%)
642 s (8%)
wPrime 2.10 - wPrime 2.0 32m *
3 s (1%)
14.8 s (3%)
WinRAR - WinRAR 4.0
15604 Points (25%)
38336 Points (61%)
7-Zip 18.03 - 7-Zip 18.03 Multli Thread 4 runs
min: 69921     avg: 72114     median: 72113.5 (41%)     max: 74306 MIPS
93686 MIPS (54%)
min: 87555     avg: 115052     median: 119352 (69%)     max: 136645 MIPS
7-Zip 18.03 - 7-Zip 18.03 Single Thread 4 runs
min: 6843     avg: 6907     median: 6906.5 (83%)     max: 6970 MIPS
6695 MIPS (80%)
min: 5452     avg: 7066     median: 7210.5 (86%)     max: 7508 MIPS
X264 HD Benchmark 4.0 - x264 Pass 2
152 fps (53%)
X264 HD Benchmark 4.0 - x264 Pass 1
339 fps (78%)
HWBOT x265 Benchmark v2.2 - HWBOT x265 4k Preset
min: 19.8     avg: 20.3     median: 20.3 (36%)     max: 20.8 fps
25.6 fps (45%)
min: 22.7     avg: 30.2     median: 30.8 (54%)     max: 38.9 fps
TrueCrypt - TrueCrypt Serpent
1.3 GB/s (0%)
1.9 GB/s (0%)
TrueCrypt - TrueCrypt Twofish
2 GB/s (34%)
3.7 GB/s (64%)
TrueCrypt - TrueCrypt AES
15 GB/s (39%)
19.8 GB/s (52%)
Blender - Blender 3.3 Classroom CPU *
min: 331     avg: 336     median: 336 (4%)     max: 341 Seconds
247 Seconds (3%)
min: 155     avg: 205.7     median: 195 (2%)     max: 298 Seconds
Blender - Blender 2.79 BMW27 CPU *
min: 196.8     avg: 196.9     median: 196.9 (1%)     max: 197 Seconds
141 Seconds (1%)
min: 91     avg: 116.4     median: 110.5 (1%)     max: 164 Seconds
R Benchmark 2.5 - R Benchmark 2.5 *
min: 0.4509     avg: 0.5     median: 0.5 (10%)     max: 0.4545 sec
0.4 sec (9%)
min: 0.3609     avg: 0.4     median: 0.4 (8%)     max: 0.4859 sec
3DMark 06 - CPU - 3DMark 06 - CPU
15873 Points (34%)
min: 19451     avg: 20120     median: 20119.5 (43%)     max: 20788 Points
Super Pi mod 1.5 XS 1M - Super Pi mod 1.5 XS 1M *
7.3 s (2%)
6.4 s (1%)
Super Pi mod 1.5 XS 2M - Super Pi mod 1.5 XS 2M *
15.8 s (1%)
14.1 s (1%)
Super Pi Mod 1.5 XS 32M - Super Pi mod 1.5 XS 32M *
365.8 s (2%)
337.3 s (1%)
3DMark Vantage - 3DM Vant. Perf. CPU no Physx
86050 Points (75%)
3DMark 11 - 3DM11 Performance Physics
min: 23381     avg: 23704     median: 23703.5 (64%)     max: 24026 Points
24163 Points (65%)
min: 16205     avg: 23670     median: 24087 (65%)     max: 29134 Points
3DMark - 3DMark Ice Storm Physics
94127 Points (76%)
92919 Points (76%)
3DMark - 3DMark Ice Storm Extreme Physics
94179 Points (76%)
94249 Points (76%)
3DMark - 3DMark Ice Storm Unlimited Physics
96702 Points (81%)
94081 Points (79%)
3DMark - 3DMark Cloud Gate Physics
22992 Points (58%)
min: 16565     avg: 21097     median: 22021 (56%)     max: 24768 Points
3DMark - 3DMark Fire Strike Standard Physics
min: 29163     avg: 30051     median: 30050.5 (54%)     max: 30938 Points
31988 Points (57%)
min: 32683     avg: 39023     median: 38894.5 (69%)     max: 46710 Points
3DMark - 3DMark Time Spy CPU
min: 11599     avg: 11652     median: 11652 (49%)     max: 11705 Points
15311 Points (65%)
min: 13797     avg: 16836     median: 16982 (72%)     max: 18847 Points
Geekbench 6.2 - Geekbench 6.2 Single-Core
2761 Points (74%)
min: 2419     avg: 2982     median: 3028.5 (82%)     max: 3129 Points
Geekbench 6.2 - Geekbench 6.2 Multi-Core
16010 Points (63%)
min: 15849     avg: 17715     median: 17918.5 (71%)     max: 19665 Points
Geekbench 5.5 - Geekbench 5.1 - 5.4 64 Bit Single-Core
min: 1665     avg: 1683     median: 1683 (71%)     max: 1701 Points
1933 Points (82%)
min: 1669     avg: 2095     median: 2128.5 (90%)     max: 2210 Points
Geekbench 5.5 - Geekbench 5.1 - 5.4 64 Bit Multi-Core
min: 10093     avg: 10724     median: 10723.5 (19%)     max: 11354 Points
16810 Points (30%)
min: 8618     avg: 19814     median: 20450 (37%)     max: 23194 Points
Geekbench 5.0 - Geekbench 5.0 64 Bit Single-Core
1673 Points (7%)
min: 2090     avg: 2104     median: 2103.5 (9%)     max: 2117 Points
Geekbench 5.0 - Geekbench 5.0 64 Bit Multi-Core
11246 Points (35%)
min: 19253     avg: 21215     median: 21214.5 (67%)     max: 23176 Points
Geekbench 4.4 - Geekbench 4.1 - 4.4 64 Bit Single-Core
7333 Points (73%)
Geekbench 4.4 - Geekbench 4.1 - 4.4 64 Bit Multi-Core
44131 Points (48%)
Mozilla Kraken 1.1 - Kraken 1.1 Total Score *
min: 558     avg: 576     median: 575.5 (1%)     max: 593 ms
486 ms (1%)
min: 428     avg: 447.2     median: 443 (1%)     max: 535 ms
Octane V2 - Octane V2 Total Score
98007 Points (86%)
min: 106992     avg: 109933     median: 109745 (96%)     max: 113875 Points
WebXPRT 4 - WebXPRT 4 Score
245 Points (70%)
283 Points (81%)
min: 246     avg: 298.4     median: 302.5 (87%)     max: 316 Points
WebXPRT 3 - WebXPRT 3 Score
min: 296     avg: 301.5     median: 301.5 (63%)     max: 307 Points
311 Points (65%)
min: 279     avg: 327.5     median: 328.5 (68%)     max: 345 Points
CrossMark - CrossMark Overall
1541 Points (59%)
2092 Points (80%)
min: 1877     avg: 2157     median: 2183 (84%)     max: 2344 Points
Power Consumption - Prime95 Power Consumption - external Monitor *
242.3 Watt (42%)
159.3 Watt (27%)
min: 89.1     avg: 176.6     median: 180 (31%)     max: 318 Watt
Power Consumption - Cinebench R15 Multi Power Consumption - external Monitor *
220.7 Watt (40%)
197 Watt (36%)
min: 185     avg: 239.1     median: 240.4 (44%)     max: 301 Watt
Power Consumption - Idle Power Consumption - external Monitor *
22.4 Watt (15%)
min: 14.8     avg: 23.8     median: 22.4 (15%)     max: 34.6 Watt
Power Consumption - Idle Power Consumption 150cd 1min *
17.6 Watt (19%)
min: 13.5     avg: 19.4     median: 18.1 (20%)     max: 35.2 Watt
Power Consumption - Cinebench R15 Multi Power Efficiency - external Monitor
11.9 Points per Watt (9%)
19.3 Points per Watt (14%)
min: 16     avg: 19.9     median: 20 (15%)     max: 24.1 Points per Watt

Average Benchmarks AMD Ryzen 7 5800X → 100% n=21

Average Benchmarks Intel Core i7-14650HX → 121% n=21

Average Benchmarks Intel Core i9-14900HX → 136% n=21

- Range of benchmark values for this graphics card
- Average benchmark values for this graphics card
* Smaller numbers mean a higher performance
1 This benchmark is not used for the average calculation

v1.28
log 04. 09:42:05

#0 checking url part for id 12783 +0s ... 0s

#1 checking url part for id 17170 +0s ... 0s

#2 checking url part for id 17163 +0s ... 0s

#3 redirected to Ajax server, took 1720078925 +0s ... 0s

#4 did not recreate cache, as it is less than 5 days old! Created at Thu, 04 Jul 2024 05:15:21 +0200 +0s ... 0s

#5 composed specs +0.009s ... 0.009s

#6 did output specs +0s ... 0.009s

#7 getting avg benchmarks for device 12783 +0.004s ... 0.013s

#8 got single benchmarks 12783 +0.006s ... 0.019s

#9 getting avg benchmarks for device 17170 +0.004s ... 0.023s

#10 got single benchmarks 17170 +0.004s ... 0.027s

#11 getting avg benchmarks for device 17163 +0.004s ... 0.031s

#12 got single benchmarks 17163 +0.029s ... 0.06s

#13 got avg benchmarks for devices +0s ... 0.06s

#14 min, max, avg, median took s +0.071s ... 0.131s

#15 return log +0s ... 0.132s

Please share our article, every link counts!
> Expert Reviews and News on Laptops, Smartphones and Tech Innovations > Benchmarks / Tech > Processor Comparison - Head 2 Head
Redaktion, 2017-09- 8 (Update: 2023-07- 1)