Notebookcheck Logo

AMD Ryzen 7 5700X vs Intel Core i5-1135G7 vs AMD Ryzen 9 5950X

AMD Ryzen 7 5700X

► remove from comparison AMD R7 5700X

The AMD Ryzen 7 5700X is a desktop processor with 8 cores and simultaneous multithreading (SMT), which means it can process 16 threads simultaneously. In April 2022, AMD presented the Ryzen 7 5700X, a new 8-core processor that is very similar to the AMD Ryzen 7 5800X. However, due to the lower TDP, there are no restrictions on the clock frequency. Nevertheless, the AMD Ryzen 7 5700X reaches up to 4.6 GHz in boost, which is only 100 MHz less than the AMD Ryzen 7 5800X. However, the base clock drops significantly to 3.4 GHz.

The performance of the AMD Ryzen 7 5700X is consistently excellent in all applications. The native 8-core can really show off its strengths, especially in multi-threaded applications, although the single-core performance has also been significantly improved compared to the older Zen 2 architecture.

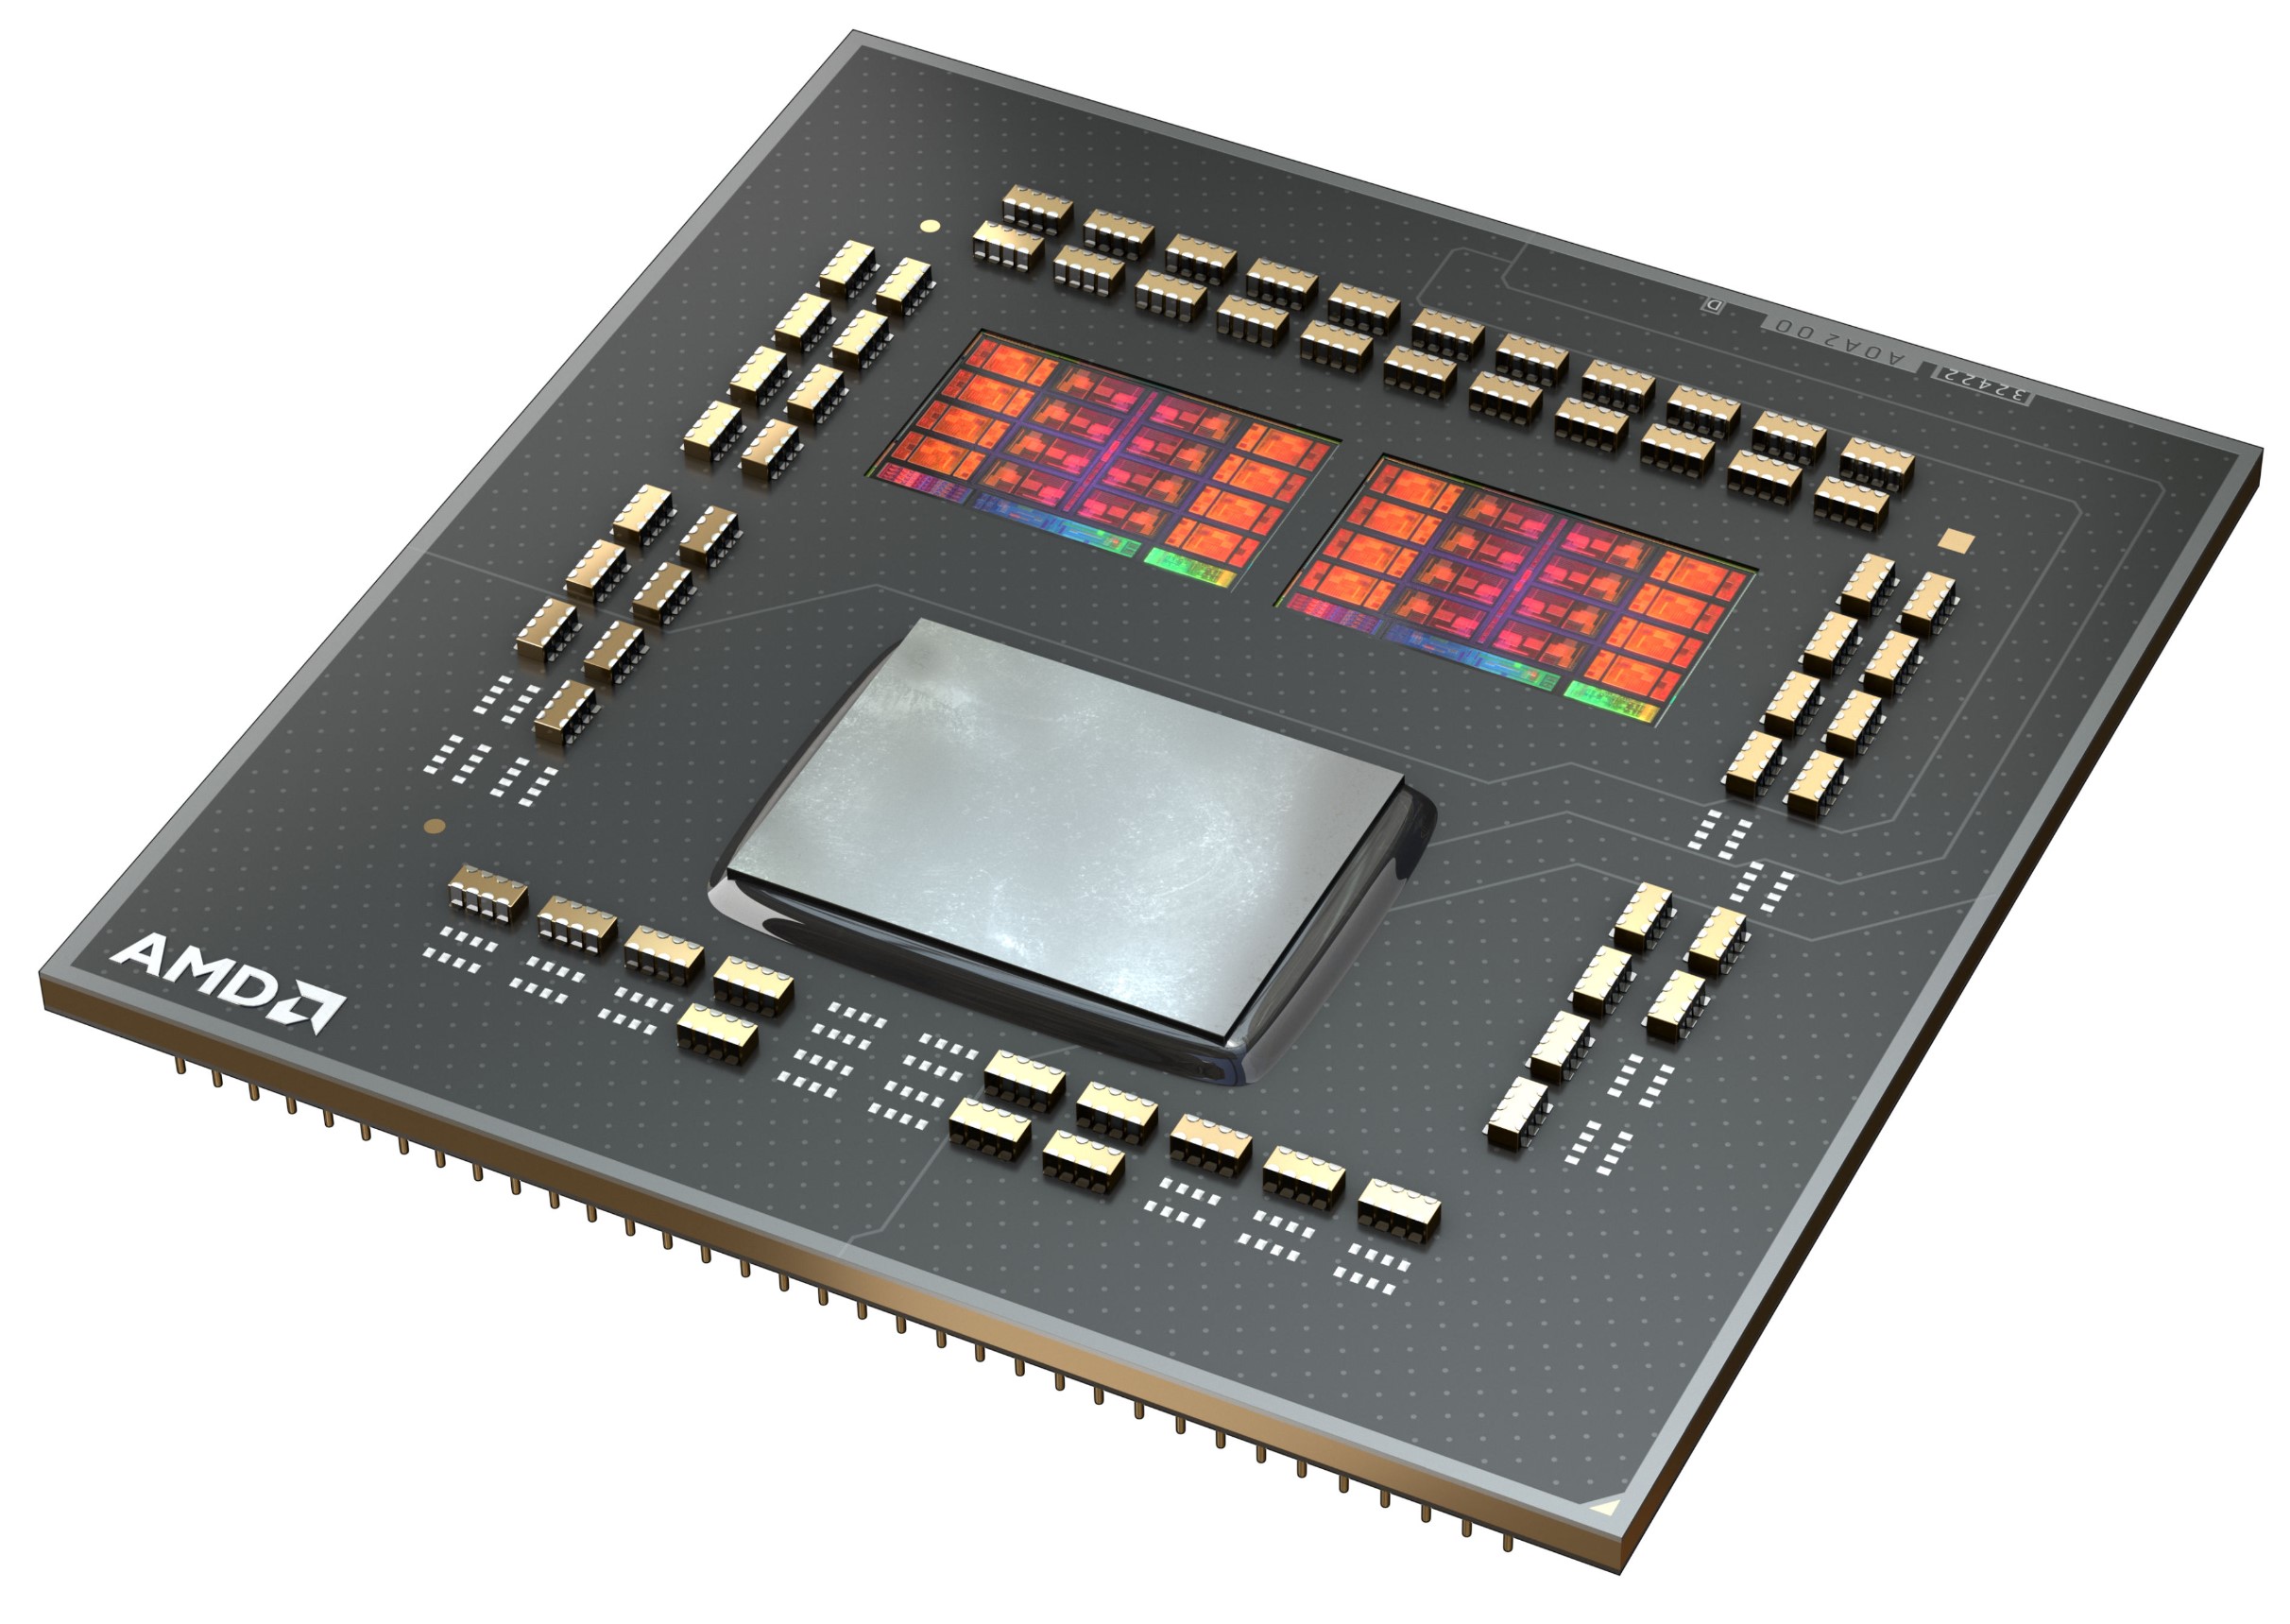
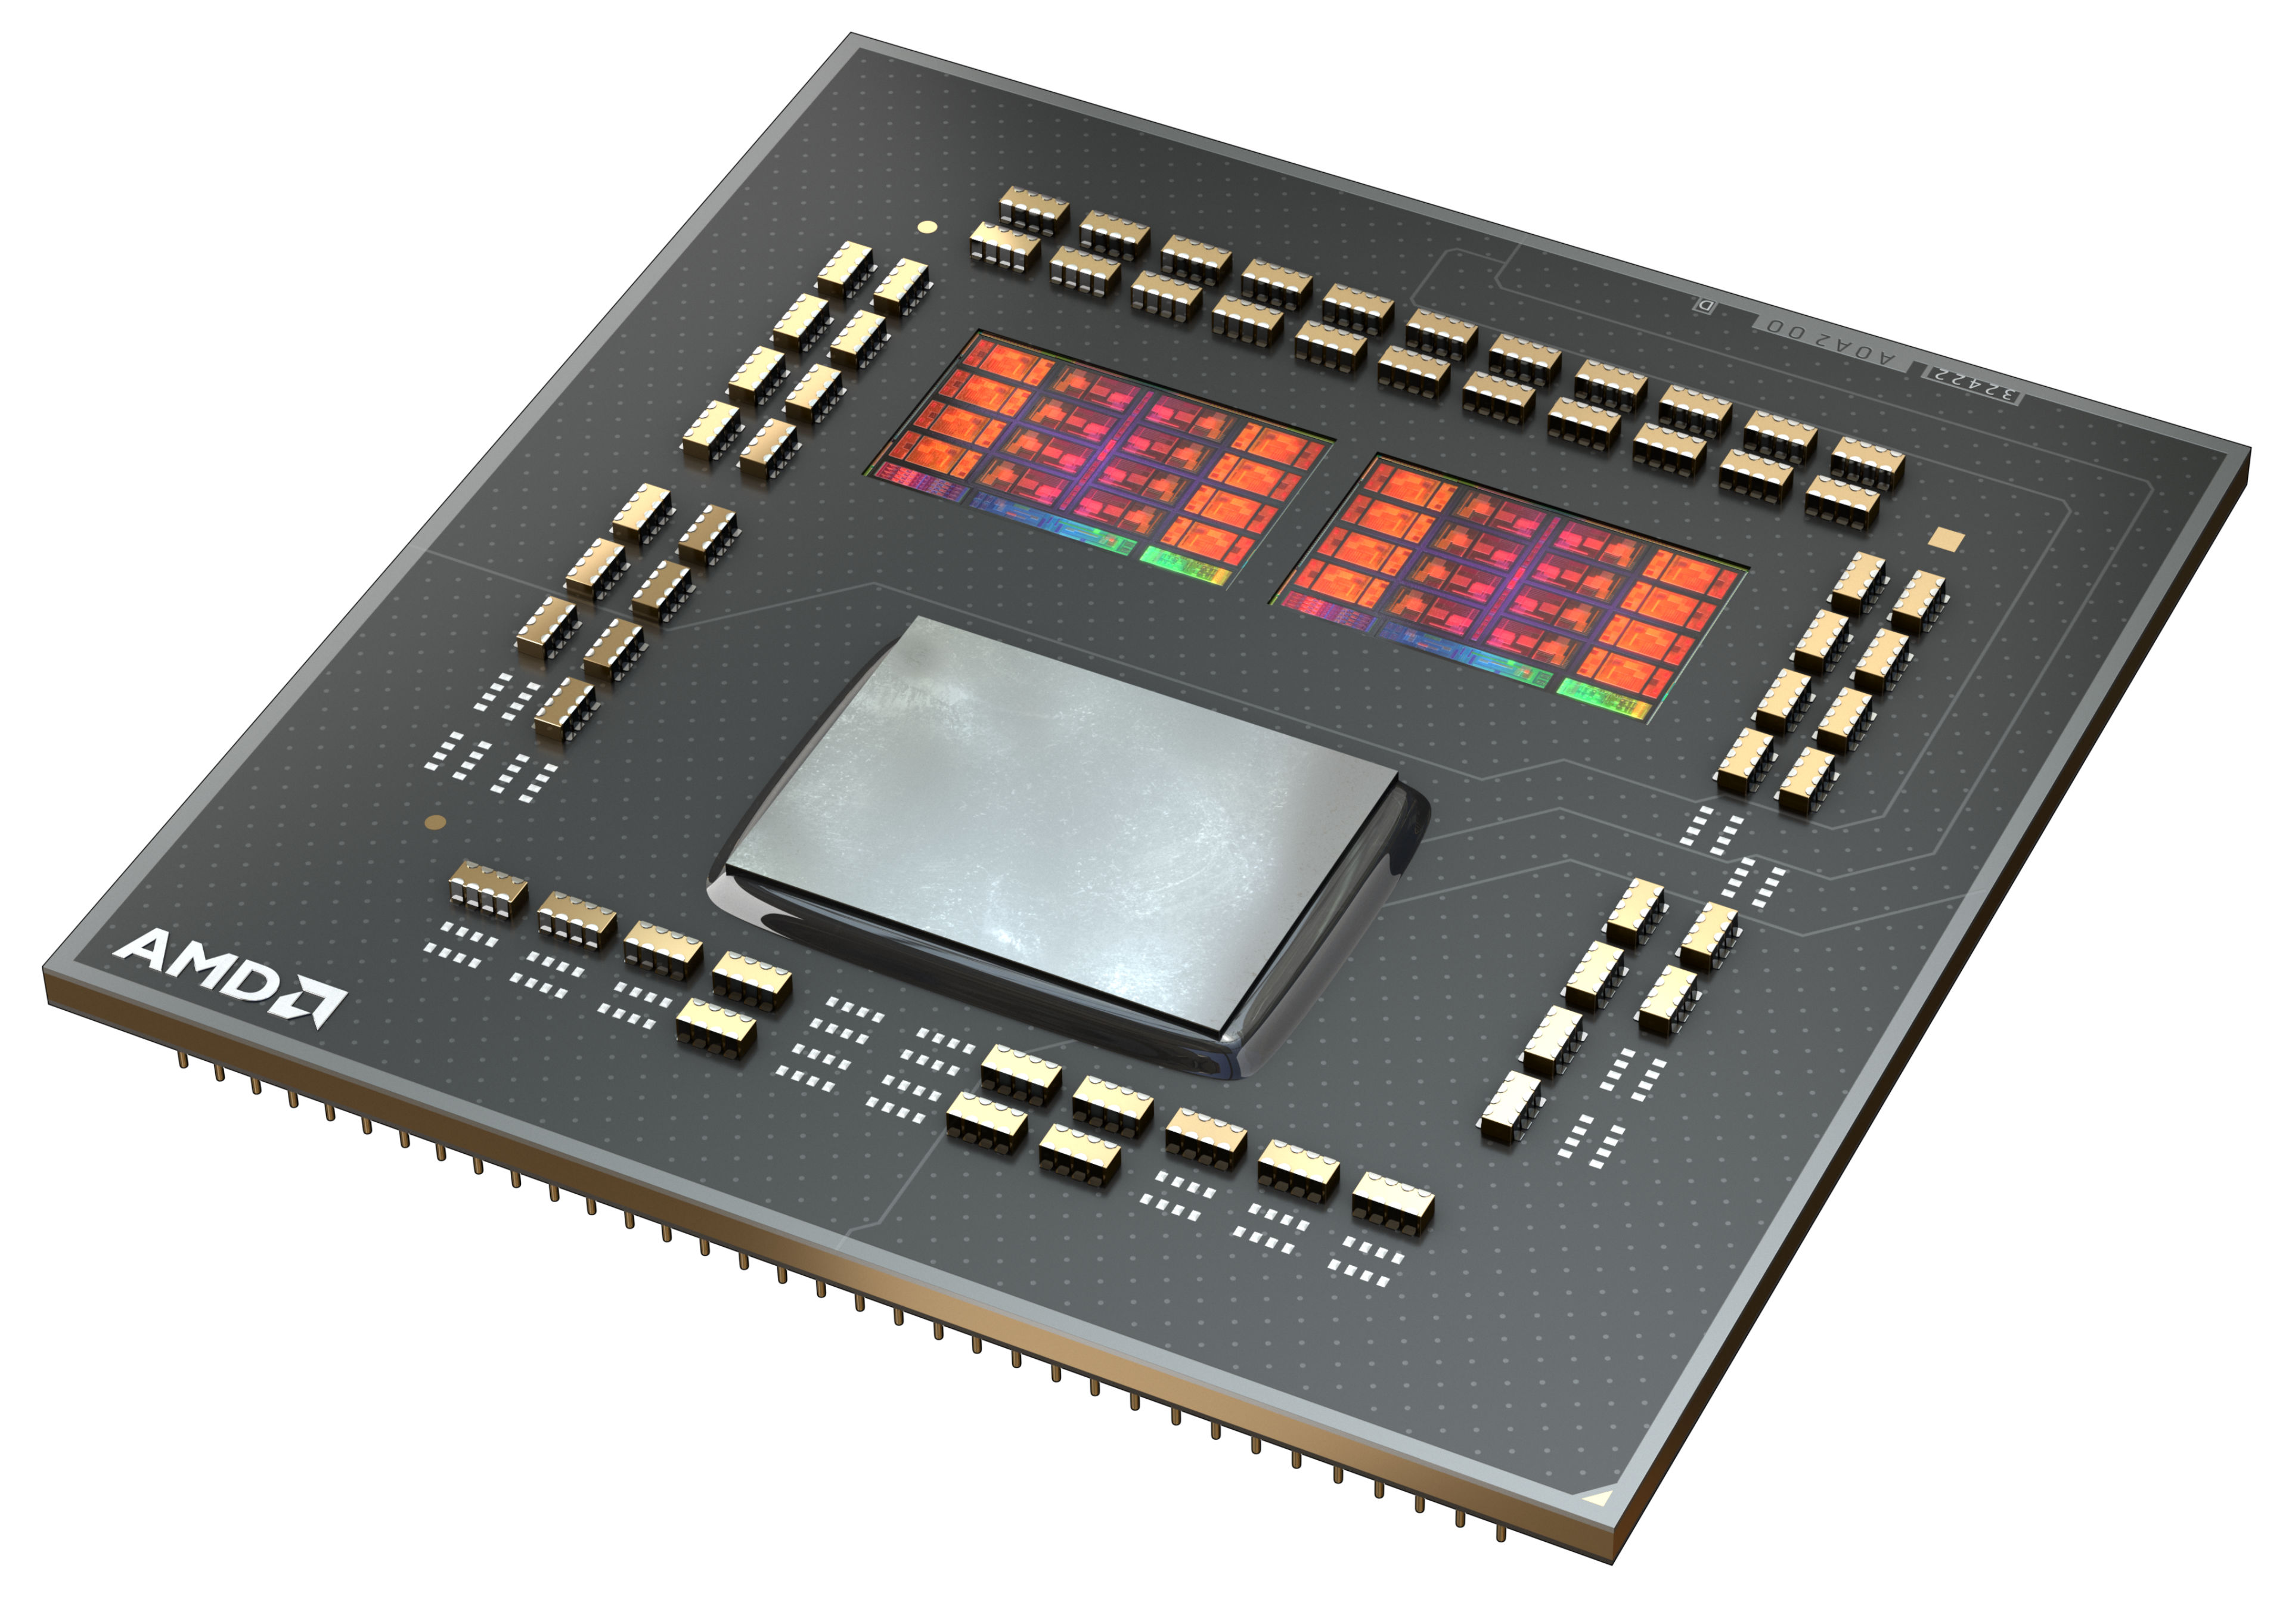
The internal structure of the processor is similar to the AMD Ryzen 7 5800X. The CCX modules are also connected to each other via the I/O die, which we already know from Zen2. However, according to AMD, the Infinity Fabric should now achieve clock rates of up to 2 GHz, which in turn enables a RAM clock rate of 4,000 MHz without any loss of performance.

In terms of manufacturing processes, AMD also relies on TSCM for the 7nm production of the CPU cores in the Vermeer processors, although the I/O die is still supplied in 12 nm by Globalfoundries.

The AMD Ryzen 7 5700X is impressive in gaming thanks to the significantly improved IPC compared to Zen2. In terms of power consumption, the AMD Ryzen 7 5700X impresses with its low TDP of just 65 watts. This means that the processor can also be operated with a compact air cooler without any problems. The AMD Ryzen 7 5800X is operated with a TDP of 105 watts.

Intel Core i5-1135G7

► remove from comparison Intel i5-1135G7

The Intel Core i5-1135G7 is a quad-core, mid-range SoC designed to be used in ultra-light laptops. The Tiger Lake-UP3 processor was introduced in September 2020. It features four Willow Cove CPU cores running at 2.4 GHz (base clock speed @ 28 W TDP) Boosting up to 4.2 GHz (1-core Boost). The all-core Boost clock speed sits at 3.8 GHz. This is a Hyper-Threading-enabled CPU, allowing for up to 8 concurrent processing threads.

Architecture

A sizeable performance-per-MHz boost is one of the multiple strengths of Tiger Lake compared to the older Ice Lake and Comet Lake product families. Core i5-1135G7 is compatible with dual-channel DDR4-3200 or quad-channel LPDDR4x-4267 RAM, supports PCI-Express 4.0 (4 lanes) and is capable of HW-accelerating AI workloads. Thunderbolt 4, USB 4 and Wi-Fi 6 support is partially baked into the chip. Four PCI-Express 4.0 lanes allow for read/write rates of up to 7.9 GB/s, provided a suitably fast NVMe SSD is used.

The i5 is manufactured on Intel's third-gen 10 nm process marketed as SuperFin that is supposedly comparable to TSMC's 7 nm process that Ryzen 4000 series laptop-grade processors are manufactured on. Both the CPU cores and the iGPU enjoy access to 8 MB of L3 cache. Higher-end Core i7-11x5 processors are notable for their larger Level 3 cache (12 MB versus 8 MB), faster iGPUs and higher clock speeds. Core i5-1135G7 is supposed to be permanently soldered to the motherboard (BGA1449 socket interface) and is thus not user-replaceable.

Performance

The average i5-1135G7 in our database delivers multi-thread benchmark scores close to those of the Core i7-10810U, Core i5-1145G7, Core i5-1230U and also the Ryzen 7 3780U. The performance may not be ground-breaking, but it’s still on the sunnier side. This Core i5 will have no difficulty coping with some light gaming and video editing on the go, and the usual web browsing and spreadsheet editing will pose no problem to it, either.

Thanks to its decent cooling solution and a long-term CPU power limit of 25 W, the Lenovo Yoga Slim 7 14ITL05 is among the fastest laptops built around the 1135G7 that we know of. It can be about 60% faster in CPU-bound workloads than the slowest system featuring the same chip in our database, as of August 2023.

Graphics

The 80 EU Iris Xe Graphics G7 is based on Intel's Gen 12 architecture. The iGPU is somewhat faster than the older Iris Plus G7 (Ice Lake) and much faster than the UHD 620 (Comet Lake). The 80 EUs are clocked at 400 MHz to 1,300 MHz. This graphics adapter can drive up to 4 monitors in resolutions up to SUHD 4320p@60 and hardware decode the AVC, HEVC, VP9 and last but not the least AV1 video streams. The iGPU's gaming performance is close to what a typical GeForce MX250 has in store; casual gamers will be happy with the Xe as it will easily handle most titles at 720p on low or medium quality settings. An important thing to keep in mind is that the iGPU has no video memory of its own, making fast RAM a necessity.

Power consumption

Just like all other Tiger Lake-UP3 chips, the i5-1135G7 has a default TDP of 12 W to 28 W, the expectation being that laptop makers will go for a higher value to get higher clock speeds and thus better performance. Either way, these values are a tad too high to allow for passively cooled designs.

The CPU is built with Intel's 3rd generation 10 nm process marketed as SuperFin for decent, as of mid 2022, energy efficiency.

AMD Ryzen 9 5950X

► remove from comparison AMD R9 5950X

The AMD Ryzen 9 5950X is a high-end 16-core, hyperthreaded (SMT) Vermeer Series desktop processor. With 32 threads, the new flagship offers as many threads as the AMD Ryzen 9 3950X. Introduced on October 8, 2020, the Ryzen 9 5950X is the fastest 16-core processor and is specified at 105 watts TDP.

The Ryzen 9 5950X runs at 3.4 GHz to 4.9 GHz (single core). Wen all 16 cores are loaded, up to 4.5 GHz are still possible.

The internal structure of the processor has not changed fundamentally at first glance. The CCX structure has changed a bit compared to Zen 2, because now a CCX consists of up to 8 CPU cores. So each individual core can access the complete L3 cache (32 MByte). Furthermore the CCX modules are connected to each other via the same I/O die, which we already know from Zen2. According to AMD, the Infinity fabric should now reach clock rates of up to 2 Ghz, which in turn allows a RAM clock of 4,000 MHz without performance loss.

Performance

The average 5950X in our database matches the Core i9-12900K, the Core i9-12900HX and also the Ryzen Threadripper 2970WX in multi-thread performance, making this Ryzen a great processor for pretty much any task imaginable as of mid 2022.

Power consumption

This Ryzen 9 series chip has a default TDP (also known as the long-term power limit) of 105 W. It will, however, happily consume much more than that as long as the cooling solution is able to handle the heat - even before one starts considering the possibility of overclocking the thing.

The Ryzen 9 5950X is built with TSMC's 7 nm process for average, as of mid 2023, energy efficiency.

ModelAMD Ryzen 7 5700XIntel Core i5-1135G7AMD Ryzen 9 5950X
SeriesAMD Vermeer (Ryzen 5000)Intel Tiger LakeAMD Vermeer (Ryzen 5000)
CodenameVermeer (Zen 3)Tiger Lake-UP3Vermeer (Zen 3)
Series: Vermeer (Ryzen 5000) Vermeer (Zen 3)
AMD Ryzen 9 5950X3.4 - 4.9 GHz16 / 32 cores64 MB L3
AMD Ryzen 7 5800X3.8 - 4.7 GHz8 / 16 cores32 MB L3
AMD Ryzen 7 5700X « 3.4 - 4.6 GHz8 / 16 cores32 MB L3
AMD Ryzen 5 5600X3.7 - 4.6 GHz6 / 12 cores32 MB L3
Intel Core i7-1195G72.9 - 5 GHz4 / 8 cores12 MB L3
Intel Core i7-1185G73 - 4.8 GHz4 / 8 cores12 MB L3
Intel Core i7-1165G72.8 - 4.7 GHz4 / 8 cores12 MB L3
Intel Core i5-1155G72.5 - 4.5 GHz4 / 8 cores8 MB L3
Intel Core i5-1145G72.6 - 4.4 GHz4 / 8 cores8 MB L3
Intel Core i5-1135G7 « 2.4 - 4.2 GHz4 / 8 cores8 MB L3
Intel Core i3-1125G42 - 3.7 GHz4 / 8 cores8 MB L3
Intel Core i3-1115G43 - 4.1 GHz2 / 4 cores6 MB L3
AMD Ryzen 9 5950X « 3.4 - 4.9 GHz16 / 32 cores64 MB L3
AMD Ryzen 7 5800X3.8 - 4.7 GHz8 / 16 cores32 MB L3
AMD Ryzen 7 5700X3.4 - 4.6 GHz8 / 16 cores32 MB L3
AMD Ryzen 5 5600X3.7 - 4.6 GHz6 / 12 cores32 MB L3
Clock3400 - 4600 MHz2400 - 4200 MHz3400 - 4900 MHz
L1 Cache512 KB320 KB1 MB
L2 Cache4 MB5 MB8 MB
L3 Cache32 MB8 MB64 MB
Cores / Threads8 / 164 / 816 / 32
TDP65 Watt28 Watt105 Watt
Technology7 nm10 nm7 nm
Die Size2 x 74 sq. mm; I/O = 125 sq. mm mm2CPU cores: 2x 80.7 sq. mm., I/O: 125 mm2
max. Temp.90 °C100 °C
Socket1331BGA1449AM4
FeaturesMMX(+), SSE, SSE2, SSE3, SSSE3, SSE4.1, SSE4.2, SSE4A, x86-64, AMD-V, AES, AVX, AVX2, FMA3, SHA, Precision Boost 2DDR4-3200/LPDDR4x-4266 RAM, PCIe 4, 4 GT/s bus, DL Boost, GNA, MMX, SSE, SSE2, SSE3, SSSE3, SSE4.1, SSE4.2, AVX, AVX2, AVX-512, BMI2, ABM, FMA, ADX, VMX, SMEP, SMAP, EIST, TM1, TM2, Hyper-Threading, Turbo, SST, AES-NI, RDRAND, RDSEED, SHADDR4-3200 RAM, PCIe 4, MMX (+), SSE, SSE2, SSE3, SSSE3, SSE4.1, SSE4.2, SSE4A, AES, AVX, AVX2, FMA3, SHA
Architecturex86x86x86
$299 U.S.$799 U.S.
Announced
Manufacturerwww.amd.comark.intel.comwww.amd.com
iGPUIntel Iris Xe Graphics G7 80EUs (400 - 1300 MHz)

Benchmarks

Performance Rating - CB R15 + R20 + 7-Zip + X265 + Blender + 3DM11 CPU - R7 5700X
42.8 pt (59%)
Performance Rating - CB R15 + R20 + 7-Zip + X265 + Blender + 3DM11 CPU - i5-1135G7
32.4 pt (45%)
Performance Rating - CB R15 + R20 + 7-Zip + X265 + Blender + 3DM11 CPU - R9 5950X
50.5 pt (70%)
Cinebench R23 - Cinebench R23 Multi Core
13184 Points (12%)
min: 2786     avg: 4724     median: 4894 (5%)     max: 6136 Points
min: 24972     avg: 26017     median: 26017 (24%)     max: 27062 Points
Cinebench R23 - Cinebench R23 Single Core
1499 Points (64%)
min: 1062     avg: 1322     median: 1345 (57%)     max: 1373 Points
min: 1579     avg: 1614     median: 1614 (69%)     max: 1649 Points
Cinebench R20 - Cinebench R20 CPU (Single Core)
595 Points (66%)
min: 375     avg: 507     median: 515 (57%)     max: 527 Points
min: 617     avg: 629     median: 629 (70%)     max: 641 Points
Cinebench R20 - Cinebench R20 CPU (Multi Core)
5405 Points (13%)
min: 979     avg: 1827     median: 1859 (5%)     max: 2382 Points
min: 9640     avg: 10061     median: 10061 (25%)     max: 10482 Points
Cinebench R15 - Cinebench R15 CPU Multi 64 Bit
2329 Points (15%)
min: 431     avg: 792     median: 822 (5%)     max: 941 Points
min: 4156     avg: 4324     median: 4324 (27%)     max: 4492 Points
Cinebench R15 - Cinebench R15 CPU Single 64 Bit
253 Points (76%)
min: 141.4     avg: 194.4     median: 198 (60%)     max: 205 Points
min: 261     avg: 266.5     median: 266.5 (80%)     max: 272 Points
Cinebench R11.5 - Cinebench R11.5 CPU Multi 64 Bit
26.5 Points (34%)
min: 6.37     avg: 8.5     median: 9.3 (12%)     max: 9.72 Points
min: 46.05     avg: 47.8     median: 47.8 (62%)     max: 49.6 Points
Cinebench R11.5 - Cinebench R11.5 CPU Single 64 Bit
2.9 Points (73%)
min: 2.31     avg: 2.3     median: 2.3 (58%)     max: 2.36 Points
min: 3.02     avg: 3.1     median: 3.1 (77%)     max: 3.14 Points
Cinebench R10 - Cinebench R10 Rend. Single (32bit)
6527 Points (39%)
min: 8116     avg: 8143     median: 8116 (49%)     max: 8198 Points
min: 6564     avg: 6690     median: 6689.5 (40%)     max: 6815 Points
Cinebench R10 - Cinebench R10 Rend. Multi (32bit)
42876 Points (31%)
min: 20445     avg: 24311     median: 25271 (18%)     max: 27216 Points
min: 55185     avg: 56641     median: 56640.5 (41%)     max: 58096 Points
Cinebench R10 - Cinebench R10 Rend. Multi (64bit)
74898 Points (52%)
min: 24499     avg: 30750     median: 30749.5 (21%)     max: 37000 Points
min: 99617     avg: 102128     median: 102128 (71%)     max: 104638 Points
Cinebench R10 - Cinebench R10 Rend. Single (64bit)
12419 Points (15%)
min: 10395     avg: 10455     median: 10455 (13%)     max: 10515 Points
min: 12655     avg: 12967     median: 12967 (16%)     max: 13279 Points
wPrime 2.10 - wPrime 2.0 1024m *
89.6 s (1%)
min: 231.3     avg: 259.1     median: 259.1 (3%)     max: 286.835 s
min: 52     avg: 58.5     median: 58.5 (1%)     max: 64.9 s
wPrime 2.10 - wPrime 2.0 32m *
3.4 s (1%)
min: 6.525     avg: 6.7     median: 6.7 (1%)     max: 6.799 s
min: 2.538     avg: 4.2     median: 4.2 (1%)     max: 5.928 s
WinRAR - WinRAR 4.0
12478 Points (20%)
min: 4185     avg: 6282     median: 5283 (8%)     max: 9377 Points
min: 12503     avg: 12736     median: 12735.5 (20%)     max: 12968 Points
7-Zip 18.03 - 7-Zip 18.03 Multli Thread 4 runs
65777 MIPS (38%)
min: 14745     avg: 21407     median: 21892.5 (13%)     max: 24873 MIPS
min: 118165     avg: 122979     median: 122978 (71%)     max: 127792 MIPS
7-Zip 18.03 - 7-Zip 18.03 Single Thread 4 runs
6522 MIPS (78%)
min: 3924     avg: 4674     median: 4723.5 (56%)     max: 4921 MIPS
min: 6729     avg: 6852     median: 6851.5 (82%)     max: 6974 MIPS
X264 HD Benchmark 4.0 - x264 Pass 2
134.7 fps (47%)
min: 36.7     avg: 41.4     median: 41.4 (14%)     max: 46.1 fps
min: 203     avg: 212     median: 212 (74%)     max: 221 fps
X264 HD Benchmark 4.0 - x264 Pass 1
305 fps (70%)
min: 165.55     avg: 182.5     median: 182.5 (42%)     max: 199.5 fps
min: 321.5     avg: 330     median: 330 (76%)     max: 338.5 fps
HWBOT x265 Benchmark v2.2 - HWBOT x265 4k Preset
17.1 fps (30%)
min: 3.57     avg: 5.9     median: 6 (10%)     max: 7.6 fps
min: 29.9     avg: 30.9     median: 30.9 (54%)     max: 31.8 fps
TrueCrypt - TrueCrypt Serpent
1.2 GB/s (0%)
min: 0.384     avg: 0.4     median: 0.4 (0%)     max: 0.449 GB/s
min: 2.3     avg: 2.4     median: 2.4 (0%)     max: 2.4 GB/s
TrueCrypt - TrueCrypt Twofish
1.9 GB/s (33%)
min: 0.593     avg: 0.7     median: 0.8 (13%)     max: 0.774 GB/s
min: 3.3     avg: 3.5     median: 3.5 (60%)     max: 3.7 GB/s
TrueCrypt - TrueCrypt AES
13.4 GB/s (35%)
min: 4.2     avg: 4.9     median: 5.2 (14%)     max: 5.3 GB/s
min: 25.1     avg: 26     median: 26 (68%)     max: 26.9 GB/s
Blender - Blender 3.3 Classroom CPU *
374 Seconds (5%)
min: 1046     avg: 1263     median: 1254 (16%)     max: 1548 Seconds
Blender - Blender 2.79 BMW27 CPU *
221 Seconds (2%)
min: 499     avg: 662     median: 649.5 (5%)     max: 1044 Seconds
min: 112.8     avg: 117.7     median: 117.7 (1%)     max: 122.5 Seconds
R Benchmark 2.5 - R Benchmark 2.5 *
0.5 sec (10%)
min: 0.619     avg: 0.6     median: 0.6 (14%)     max: 0.727 sec
min: 0.4556     avg: 0.5     median: 0.5 (10%)     max: 0.4698 sec
3DMark 06 - CPU - 3DMark 06 - CPU
14862 Points (32%)
min: 7455     avg: 8274     median: 8274 (18%)     max: 9093 Points
min: 17229     avg: 17657     median: 17656.5 (38%)     max: 18084 Points
Super Pi mod 1.5 XS 1M - Super Pi mod 1.5 XS 1M *
9.5 s (2%)
min: 8.015     avg: 8.1     median: 8.1 (2%)     max: 8.093 s
min: 7.065     avg: 7.2     median: 7.2 (2%)     max: 7.405 s
Super Pi mod 1.5 XS 2M - Super Pi mod 1.5 XS 2M *
20.4 s (1%)
min: 17.61     avg: 17.7     median: 17.7 (1%)     max: 17.81 s
min: 15.28     avg: 15.7     median: 15.7 (1%)     max: 16.02 s
Super Pi Mod 1.5 XS 32M - Super Pi mod 1.5 XS 32M *
460.7 s (2%)
min: 388     avg: 405.6     median: 412.7 (2%)     max: 416.065 s
min: 349.3     avg: 361.5     median: 361.5 (2%)     max: 373.7 s
3DMark Vantage - 3DM Vant. Perf. CPU no Physx
77709 Points (68%)
22734 Points (20%)
min: 84237     avg: 85367     median: 85367 (75%)     max: 86497 Points
3DMark 11 - 3DM11 Performance Physics
20010 Points (54%)
min: 6423     avg: 9300     median: 9456 (26%)     max: 11623 Points
min: 23012     avg: 25067     median: 25154.5 (68%)     max: 27383 Points
3DMark - 3DMark Ice Storm Physics
90009 Points (73%)
min: 38873     avg: 55717     median: 58666 (48%)     max: 63164 Points
min: 70120     avg: 77979     median: 79716 (65%)     max: 84100 Points
3DMark - 3DMark Ice Storm Extreme Physics
90305 Points (73%)
min: 39405     avg: 55009     median: 59162 (48%)     max: 63612 Points
min: 69902     avg: 78121     median: 80185 (65%)     max: 84275 Points
3DMark - 3DMark Ice Storm Unlimited Physics
92849 Points (78%)
min: 54397     avg: 63114     median: 64419 (54%)     max: 65372 Points
min: 82412     avg: 82452     median: 82452 (69%)     max: 82492 Points
3DMark - 3DMark Cloud Gate Physics
20598 Points (52%)
min: 4680     avg: 7779     median: 8064 (20%)     max: 9304 Points
min: 21419     avg: 22558     median: 22436 (57%)     max: 23939 Points
3DMark - 3DMark Fire Strike Standard Physics
27800 Points (50%)
min: 1015     avg: 11403     median: 11896 (21%)     max: 13480 Points
min: 34080     avg: 37236     median: 37498.5 (67%)     max: 39600 Points
3DMark - 3DMark Time Spy CPU
10432 Points (44%)
min: 2664     avg: 3871     median: 3850 (16%)     max: 5262 Points
min: 11111     avg: 12919     median: 13441 (57%)     max: 14559 Points
Geekbench 6.2 - Geekbench 6.2 Single-Core
2186 Points (59%)
Geekbench 6.2 - Geekbench 6.2 Multi-Core
9331 Points (37%)
Geekbench 5.5 - Geekbench 5.1 - 5.4 64 Bit Single-Core
1647 Points (69%)
min: 1147     avg: 1373     median: 1384 (58%)     max: 1428 Points
min: 1621     avg: 1652     median: 1651.5 (70%)     max: 1682 Points
Geekbench 5.5 - Geekbench 5.1 - 5.4 64 Bit Multi-Core
9353 Points (17%)
min: 3475     avg: 4663     median: 4688 (8%)     max: 5472 Points
min: 15605     avg: 16248     median: 16248 (29%)     max: 16891 Points
Geekbench 5.0 - Geekbench 5.0 64 Bit Single-Core
1587 Points (7%)
min: 1156     avg: 1365     median: 1379 (6%)     max: 1407 Points
min: 1625     avg: 1654     median: 1654 (7%)     max: 1683 Points
Geekbench 5.0 - Geekbench 5.0 64 Bit Multi-Core
9214 Points (29%)
min: 3937     avg: 4752     median: 4761.5 (15%)     max: 5268 Points
min: 15396     avg: 15983     median: 15983 (50%)     max: 16570 Points
Geekbench 4.4 - Geekbench 4.1 - 4.4 64 Bit Single-Core
6928 Points (69%)
min: 5194     avg: 5874     median: 5911 (59%)     max: 6081 Points
min: 7021     avg: 7119     median: 7118.5 (71%)     max: 7216 Points
Geekbench 4.4 - Geekbench 4.1 - 4.4 64 Bit Multi-Core
37730 Points (41%)
min: 16405     avg: 18945     median: 18889 (21%)     max: 20747 Points
min: 57584     avg: 60409     median: 60408.5 (66%)     max: 63233 Points
Mozilla Kraken 1.1 - Kraken 1.1 Total Score *
579 ms (1%)
min: 710     avg: 739     median: 721.5 (1%)     max: 1273 ms
min: 558     avg: 570     median: 569.5 (1%)     max: 581 ms
Sunspider - Sunspider 1.0 Total Score *
min: 137.6     avg: 152.5     median: 143.3 (2%)     max: 176.5 ms
Octane V2 - Octane V2 Total Score
min: 39503     avg: 57825     median: 58147 (51%)     max: 62664 Points
WebXPRT 4 - WebXPRT 4 Score
236 Points (68%)
min: 171.3     avg: 179.9     median: 180.4 (52%)     max: 186.4 Points
WebXPRT 3 - WebXPRT 3 Score
310 Points (65%)
min: 151     avg: 226.1     median: 226.5 (47%)     max: 244 Points
min: 288     avg: 289.5     median: 289.5 (60%)     max: 291 Points
CrossMark - CrossMark Overall
1423 Points (55%)
min: 1058     avg: 1176     median: 1169.5 (45%)     max: 1293 Points
1495 Points (57%)
Power Consumption - Prime95 Power Consumption - external Monitor *
185.9 Watt (32%)
min: 20     avg: 37     median: 37.4 (6%)     max: 56.8 Watt
min: 232.8     avg: 242.6     median: 242.6 (42%)     max: 252.3 Watt
Power Consumption - Cinebench R15 Multi Power Consumption - external Monitor *
155.2 Watt (28%)
min: 22.4     avg: 42.4     median: 42.6 (8%)     max: 61.2 Watt
min: 226.1     avg: 227.4     median: 227.4 (41%)     max: 228.7 Watt
Power Consumption - Idle Power Consumption - external Monitor *
40.9 Watt (27%)
min: 2.47     avg: 4.6     median: 3.8 (3%)     max: 7.02 Watt
Power Consumption - Idle Power Consumption 150cd 1min *
min: 3.56     avg: 6.4     median: 5.6 (6%)     max: 14.9 Watt
Power Consumption - Cinebench R15 Multi Power Efficiency - external Monitor
15 Points per Watt (11%)
min: 15     avg: 19.2     median: 18.2 (14%)     max: 32.1 Points per Watt
min: 18.2     avg: 19.1     median: 19.1 (14%)     max: 19.9 Points per Watt

Average Benchmarks AMD Ryzen 7 5700X → 100% n=46

Average Benchmarks Intel Core i5-1135G7 → 65% n=46

Average Benchmarks AMD Ryzen 9 5950X → 128% n=46

- Range of benchmark values for this graphics card
- Average benchmark values for this graphics card
* Smaller numbers mean a higher performance
1 This benchmark is not used for the average calculation

v1.28
log 01. 22:07:31

#0 checking url part for id 15075 +0s ... 0s

#1 checking url part for id 12238 +0s ... 0s

#2 checking url part for id 12787 +0s ... 0s

#3 redirected to Ajax server, took 1719864451 +0s ... 0s

#4 did not recreate cache, as it is less than 5 days old! Created at Mon, 01 Jul 2024 05:15:43 +0200 +0s ... 0s

#5 composed specs +0.008s ... 0.009s

#6 did output specs +0s ... 0.009s

#7 getting avg benchmarks for device 15075 +0.005s ... 0.014s

#8 got single benchmarks 15075 +0.006s ... 0.02s

#9 getting avg benchmarks for device 12238 +0.003s ... 0.023s

#10 got single benchmarks 12238 +0.045s ... 0.068s

#11 getting avg benchmarks for device 12787 +0.005s ... 0.072s

#12 got single benchmarks 12787 +0.009s ... 0.082s

#13 got avg benchmarks for devices +0s ... 0.082s

#14 min, max, avg, median took s +0.087s ... 0.169s

#15 return log +0s ... 0.169s

Please share our article, every link counts!
> Expert Reviews and News on Laptops, Smartphones and Tech Innovations > Benchmarks / Tech > Processor Comparison - Head 2 Head
Redaktion, 2017-09- 8 (Update: 2023-07- 1)