Notebookcheck Logo

AMD Ryzen 7 3800XT vs Intel Processor N50 vs AMD Ryzen 9 3900

AMD Ryzen 7 3800XT

► remove from comparison AMD R7 3800XT

The AMD Ryzen 7 3800XT is a fast desktop processor with 8 cores (octa core) based on the Zen 2 architecture. At launch it is the fastest 8-core-CPU of the Matisse series. The 3800XT clocks from 3.9 GHz (base) up to 4.7 GHz (Turbo). All eight cores can reach up to 4.2 GHz.

Performance

The average 3800XT in our database is in the same league as the Core i5-12500H, Core i5-13500H, Core i9-10910, Ryzen 7 5700G, Ryzen 7 7735HS, Ryzen 9 6900HS, Ryzen 9 6900HX, as far as multi-thread performance is concerned.

Power consumption

This Ryzen 7 series processor has a default TDP, also known as the long-term power limit, of 105 W. Needless to say, if one was to overclock it, the chip's power consumption would go up by a huge margin.

The R7 3800XT is built with TSMC's 7 nm process making for average, as of mid 2023, energy efficiency.

Intel Processor N50

► remove from comparison Intel N50

The Intel Processor N50 is an entry-level mobile CPU for thin and light laptops from the Alder Lake-N series. It was announced in early 2023 and offers no performance cores and 2 of the 8 efficient cores (E-cores, Gracemont architecture). The chip does not support HyperThreading and clocks with up to 3.4 GHz. The performance of the E-cores should be similar to old Skylake cores (compare to the Core i7-6700HQ). All cores can use up to 6 MB L3-cache. 

Performance

The performance is clearly lower than the Processor N100 (4 cores, 3.4 GHz) due to the reduced core count. The single thread performance however, should be similar. Compared to older processors, the N50 should be comparable to dual core Skylake based CPUs like the Intel Core m3-8100Y (2x 3.4 GHz, 5W).Features

The Alder Lake-N chips only support single channel memory with up to DDR5-4800, DDR4-3200 or LPDDR5-4800. The chip also supports Quick Sync and AV1 decoding (most likely same engine as in Alder Lake). Furthermore, Wi-Fi 6E and Bluetooth 5.2 are partly integrated (but no Thunderbolt). External chips can be connected via PCIe Gen3 x9 (via the PCH).

The integrated graphics adapter is based on the Xe-architecture and offers only 16 of the 32 EUs (Execution Units) operating at only up to 750 MHz. Due to the single channel memory, low clock speeds, and low shader count, the gaming performance of the iGPU is very limited.

Power consumption

The N50 has a base power consumption of only 6 W and is therefore suited for fanless cooling. The CPU is built with a further improved 10nm SuperFin process at Intel (called Intel 7).

AMD Ryzen 9 3900

► remove from comparison AMD R9 3900

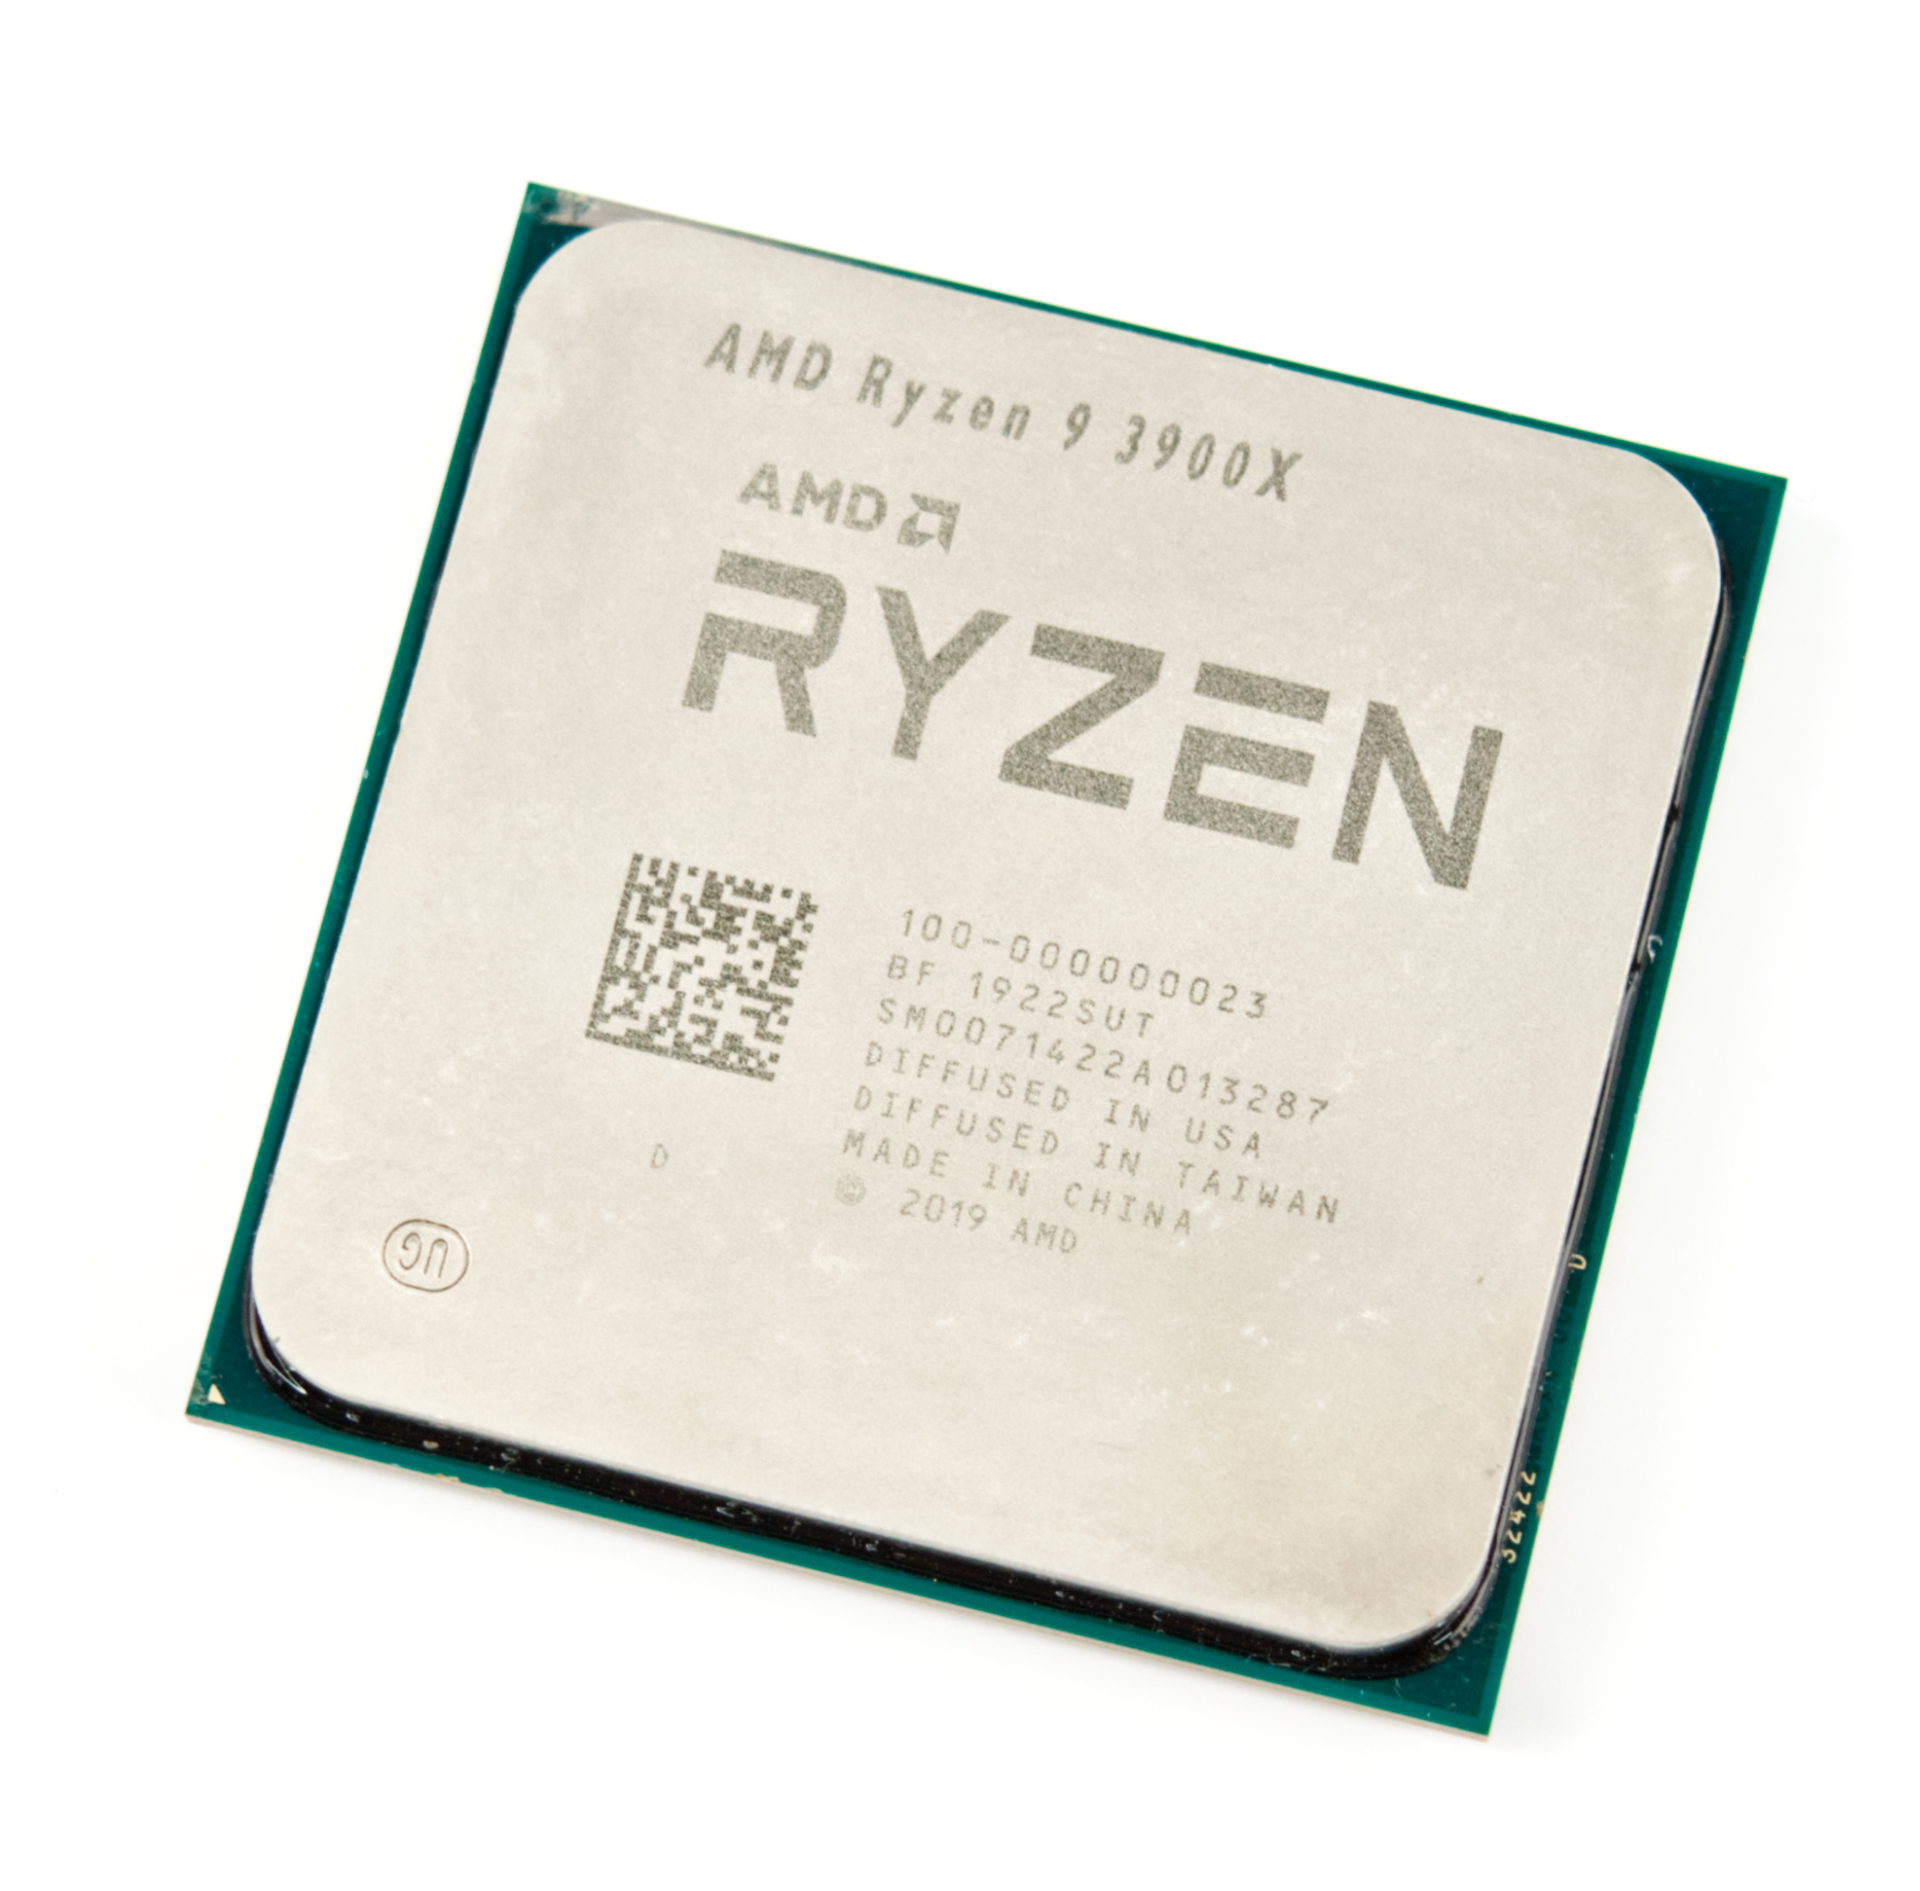
The Ryzen 9 3900 is a fast desktop CPU with 12 cores and 24 threads based on the Matisse series. It is the fastest 65 Watt CPU at launch in late 2019 and clocks the cores between 3.1 (base) to 4.3 (boost) clock (including Precision Boost). It uses 4 CCX-clusters where 3 of the 4 cores are activated. The CPU is manufactured in the modern 7nm process at TSMC. The I/O die on the package is separate and manufactured in 12 nm at Globalfoundries.

Due to the reduced Turbo speed, the Ryzen 9 3900 is aimed at content creators and other professionals that can make use of the 12 cores. For games, a fast 8-core CPU with higher boost clocks is the better choice.

ModelAMD Ryzen 7 3800XTIntel Processor N50AMD Ryzen 9 3900
SeriesAMD Matisse (Ryzen 3000 Desktop)Intel Alder Lake-NAMD Matisse (Ryzen 3000 Desktop)
CodenameMatisse (Zen 2)Alder Lake-NMatisse (Zen 2)
Series: Matisse (Ryzen 3000 Desktop) Matisse (Zen 2)
AMD Ryzen 9 3950X3.5 - 4.7 GHz16 / 32 cores64 MB L3
AMD Ryzen 9 3900X3.8 - 4.6 GHz12 / 24 cores64 MB L3
AMD Ryzen 9 39003.1 - 4.3 GHz12 / 24 cores64 MB L3
AMD Ryzen 7 3800XT « 3.9 - 4.7 GHz8 / 16 cores32 MB L3
AMD Ryzen 7 3700X3.6 - 4.4 GHz8 / 16 cores32 MB L3
AMD Ryzen 3 3300X3.8 - 4.3 GHz4 / 8 cores16 MB L3
AMD Ryzen 3 31003.6 - 3.9 GHz4 / 8 cores16 MB L3
Intel Core i3-N3051.8 - 3.8 GHz8 / 8 cores6 MB L3
Intel Core i3-N300 - 3.8 GHz8 / 8 cores6 MB L3
Intel Processor N2001 - 3.7 GHz4 / 4 cores6 MB L3
Intel Processor N97 - 3.6 GHz4 / 4 cores6 MB L3
Intel Processor N95 - 3.4 GHz4 / 4 cores6 MB L3
Intel Processor N1001 - 3.4 GHz4 / 4 cores6 MB L3
Intel Processor N50 « 1 - 3.4 GHz2 / 2 cores6 MB L3
AMD Ryzen 9 3950X3.5 - 4.7 GHz16 / 32 cores64 MB L3
AMD Ryzen 9 3900X3.8 - 4.6 GHz12 / 24 cores64 MB L3
AMD Ryzen 9 3900 « 3.1 - 4.3 GHz12 / 24 cores64 MB L3
AMD Ryzen 7 3800XT3.9 - 4.7 GHz8 / 16 cores32 MB L3
AMD Ryzen 7 3700X3.6 - 4.4 GHz8 / 16 cores32 MB L3
AMD Ryzen 3 3300X3.8 - 4.3 GHz4 / 8 cores16 MB L3
AMD Ryzen 3 31003.6 - 3.9 GHz4 / 8 cores16 MB L3
Clock3900 - 4700 MHz1000 - 3400 MHz3100 - 4300 MHz
L1 Cache512 KB768 KB
L2 Cache4 MB6 MB
L3 Cache32 MB6 MB64 MB
Cores / Threads8 / 162 / 2
2 x 3.4 GHz Intel Gracemont E-Core
12 / 24
TDP105 Watt6 Watt65 Watt
Technology7 nm10 nm7 nm
max. Temp.95 °C105 °C
SocketAM4 (LGA1331)AM4 (1331)
FeaturesDDR4-3200 RAM, PCIe 4, MMX, SSE, SSE2, SSE3, SSSE3, SSE4A, SSE4.1, SSE4.2, AVX, AVX2, BMI2, ABM, FMA, ADX, SMEP, SMAP, SMT, CPB, AES-NI, RDRAND, RDSEED, SHA, SMEMMX(+), SSE, SSE2, SSE3, SSSE3, SSE4.1, SSE4.2, SSE4A, x86-64, AMD-V, AES, AVX, AVX2, FMA3, SHA, Precision Boost 2
Architecturex86x86x86
$399 U.S.
Announced
Manufacturerwww.amd.comark.intel.com
iGPUIntel UHD Graphics Xe 16EUs (Tiger Lake-H) ( - 750 MHz)

Benchmarks

Performance Rating - CB R15 + R20 + 7-Zip + X265 + Blender + 3DM11 CPU - R7 3800XT
39.1 pt (54%)
Performance Rating - CB R15 + R20 + 7-Zip + X265 + Blender + 3DM11 CPU - R9 3900
39 pt (54%)
Cinebench R20 - Cinebench R20 CPU (Single Core)
544 Points (60%)
490 Points (54%)
Cinebench R20 - Cinebench R20 CPU (Multi Core)
5120 Points (12%)
123%
1 R9 3900 +
6321 Points (15%)
Cinebench R15 - Cinebench R15 CPU Multi 64 Bit
2230 Points (14%)
126%
1 R9 3900 +
2804 Points (18%)
Cinebench R15 - Cinebench R15 CPU Single 64 Bit
219 Points (66%)
197 Points (59%)
Cinebench R11.5 - Cinebench R11.5 CPU Multi 64 Bit
24.2 Points (31%)
128%
1 R9 3900 +
31 Points (40%)
Cinebench R11.5 - Cinebench R11.5 CPU Single 64 Bit
2.4 Points (59%)
2.2 Points (55%)
Cinebench R10 - Cinebench R10 Rend. Single (32bit)
6035 Points (36%)
5700 Points (34%)
Cinebench R10 - Cinebench R10 Rend. Multi (32bit)
40528 Points (29%)
109%
1 R9 3900 +
44191 Points (32%)
Cinebench R10 - Cinebench R10 Rend. Multi (64bit)
68388 Points (47%)
Cinebench R10 - Cinebench R10 Rend. Single (64bit)
10497 Points (13%)
wPrime 2.10 - wPrime 2.0 1024m *
81.4 s (1%)
wPrime 2.10 - wPrime 2.0 32m *
3.7 s (1%)
WinRAR - WinRAR 4.0
7467 Points (12%)
7145 Points (11%)
7-Zip 18.03 - 7-Zip 18.03 Multli Thread 4 runs
59247 MIPS (34%)
128%
1 R9 3900 +
75612 MIPS (43%)
7-Zip 18.03 - 7-Zip 18.03 Single Thread 4 runs
5516 MIPS (66%)
5134 MIPS (61%)
X264 HD Benchmark 4.0 - x264 Pass 2
119 fps (42%)
111%
1 R9 3900 +
131.9 fps (46%)
X264 HD Benchmark 4.0 - x264 Pass 1
271 fps (63%)
255.5 fps (59%)
HWBOT x265 Benchmark v2.2 - HWBOT x265 4k Preset
16.1 fps (28%)
117%
1 R9 3900 +
18.9 fps (33%)
TrueCrypt - TrueCrypt Serpent
1.2 GB/s (0%)
133%
1 R9 3900 +
1.6 GB/s (0%)
TrueCrypt - TrueCrypt Twofish
2 GB/s (34%)
120%
1 R9 3900 +
2.4 GB/s (41%)
TrueCrypt - TrueCrypt AES
11.4 GB/s (30%)
10.4 GB/s (27%)
Blender - Blender 2.79 BMW27 CPU *
222.7 Seconds (2%)
100%
1 R9 3900 +
179 Seconds (1%)
R Benchmark 2.5 - R Benchmark 2.5 *
0.5 sec (11%)
0.5 sec (12%)
3DMark 06 - CPU - 3DMark 06 - CPU
100%
1 R9 3900 +
13817 Points (29%)
Super Pi mod 1.5 XS 1M - Super Pi mod 1.5 XS 1M *
9.1 s (2%)
100%
1 R9 3900 +
9.6 s (2%)
Super Pi mod 1.5 XS 2M - Super Pi mod 1.5 XS 2M *
19.6 s (1%)
100%
1 R9 3900 +
20.9 s (1%)
Super Pi Mod 1.5 XS 32M - Super Pi mod 1.5 XS 32M *
508 s (2%)
100%
1 R9 3900 +
547 s (2%)
3DMark 11 - 3DM11 Performance Physics
18905 Points (51%)
16803 Points (45%)
3DMark - 3DMark Ice Storm Physics
82027 Points (67%)
3DMark - 3DMark Ice Storm Extreme Physics
82302 Points (67%)
3DMark - 3DMark Ice Storm Unlimited Physics
84207 Points (71%)
3DMark - 3DMark Cloud Gate Physics
14253 Points (36%)
115%
1 R9 3900 +
16410 Points (42%)
3DMark - 3DMark Fire Strike Standard Physics
25132 Points (45%)
104%
1 R9 3900 +
26216 Points (47%)
3DMark - 3DMark Time Spy CPU
10302 Points (43%)
104%
1 R9 3900 +
10725 Points (45%)
Geekbench 6.2 - Geekbench 6.2 Single-Core
100%
1 N50 +
1185 Points (32%)
Geekbench 6.2 - Geekbench 6.2 Multi-Core
100%
1 N50 +
2024 Points (8%)
Geekbench 5.5 - Geekbench 5.1 - 5.4 64 Bit Single-Core
1353 Points (57%)
66%
N50 +
891 Points (38%)
1246 Points (53%)
Geekbench 5.5 - Geekbench 5.1 - 5.4 64 Bit Multi-Core
8948 Points (16%)
15%
N50 +
1339 Points (2%)
10190 Points (18%)
Geekbench 5.0 - Geekbench 5.0 64 Bit Single-Core
1360 Points (6%)
1258 Points (5%)
Geekbench 5.0 - Geekbench 5.0 64 Bit Multi-Core
9163 Points (29%)
117%
1 R9 3900 +
10695 Points (34%)
Geekbench 4.4 - Geekbench 4.1 - 4.4 64 Bit Single-Core
5830 Points (58%)
5449 Points (54%)
Geekbench 4.4 - Geekbench 4.1 - 4.4 64 Bit Multi-Core
35526 Points (39%)
115%
1 R9 3900 +
40720 Points (45%)
Geekbench 4.0 - Geekbench 4.0 64 Bit Single-Core
100%
1 R9 3900 +
5482 Points (75%)
Geekbench 4.0 - Geekbench 4.0 64 Bit Multi-Core
100%
1 R9 3900 +
41058 Points (100%)
Mozilla Kraken 1.1 - Kraken 1.1 Total Score *
683 ms (1%)
100%
1 R9 3900 +
746 ms (1%)
WebXPRT 3 - WebXPRT 3 Score
249 Points (52%)
227 Points (47%)
Power Consumption - Prime95 Power Consumption - external Monitor *
191.8 Watt (33%)
Power Consumption - Cinebench R15 Multi Power Consumption - external Monitor *
193.7 Watt (35%)
Power Consumption - Cinebench R15 Multi Power Efficiency - external Monitor
11.5 Points per Watt (9%)

Average Benchmarks AMD Ryzen 7 3800XT → 100% n=2

Average Benchmarks Intel Processor N50 → 40% n=2

Average Benchmarks AMD Ryzen 9 3900 → 103% n=2

- Range of benchmark values for this graphics card
- Average benchmark values for this graphics card
* Smaller numbers mean a higher performance
1 This benchmark is not used for the average calculation

v1.28
log 04. 05:04:51

#0 checking url part for id 12265 +0s ... 0s

#1 checking url part for id 14971 +0s ... 0s

#2 checking url part for id 12174 +0s ... 0s

#3 redirected to Ajax server, took 1720062291 +0s ... 0s

#4 did not recreate cache, as it is less than 5 days old! Created at Mon, 01 Jul 2024 05:15:43 +0200 +0s ... 0s

#5 composed specs +0.007s ... 0.008s

#6 did output specs +0s ... 0.008s

#7 getting avg benchmarks for device 12265 +0.004s ... 0.011s

#8 got single benchmarks 12265 +0.004s ... 0.015s

#9 getting avg benchmarks for device 14971 +0.001s ... 0.016s

#10 got single benchmarks 14971 +0.003s ... 0.019s

#11 getting avg benchmarks for device 12174 +0.004s ... 0.022s

#12 got single benchmarks 12174 +0.004s ... 0.026s

#13 got avg benchmarks for devices +0s ... 0.026s

#14 min, max, avg, median took s +0.043s ... 0.069s

#15 return log +0s ... 0.069s

Please share our article, every link counts!
> Expert Reviews and News on Laptops, Smartphones and Tech Innovations > Benchmarks / Tech > Processor Comparison - Head 2 Head
Redaktion, 2017-09- 8 (Update: 2023-07- 1)