Notebookcheck Logo

AMD Ryzen 5 PRO 4650U vs AMD Ryzen 7 PRO 7840HS vs AMD Ryzen 5 7640HS

AMD Ryzen 5 PRO 4650U

► remove from comparison AMD R5 PRO 4650U

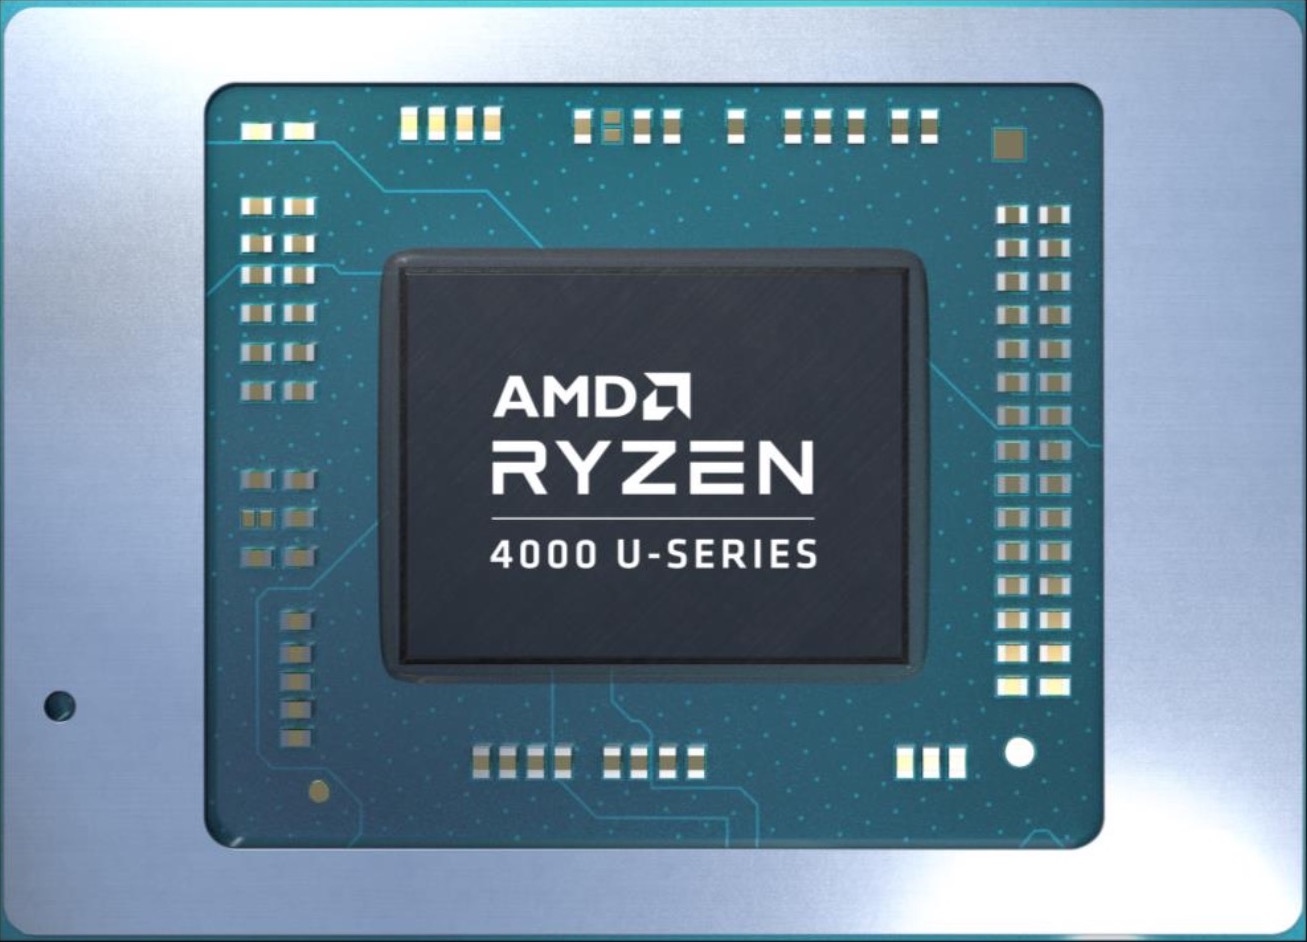
The AMD Ryzen 5 PRO 4650U is a processor for thin and light laptops based on the Renoir architecture. The 4650U integrates six cores based on the Zen 2 microarchitecture. They are clocked at 2.1 (guaranteed base clock) to 4 GHz (Turbo) with SMT for a total of 12 threads. The chip is manufactured on the modern 7 nm TSMC process and partly thanks to it AMD advertises a 2x improved performance per Watt for the Renoir chips.

The PRO processors offer a range of business features like hardware security (e.g., AMD Memory Guard), manageability (e.g., support for Microsoft Endpoint Manager), and longer availability and software stability.

In addition to the six CPU cores, the APU also integrates a Radeon RX Vega 6 integrated graphics adapter with 6 CUs at up to 1500 MHz. The dual channel memory controller supports DDR4-3200 and energy efficient LPDDR4-4266 RAM. Furthermore, 8 MB level 3 cache can be found on the chip. See our hub page on the Renoir Processors for more information.

Performance

The average 4650U in our database is just as fast as the Intel Core i7-11375H and the AMD Ryzen 5 4600U are in multi-thread workloads. This is a fairly decent mid-range CPU, as of late 2021.

Your mileage may vary depending on how high the CPU power limits are and how competent the cooling solution of your system is.

Power consumption

This Ryzen 5 series chip has a default TDP (also known as the long-term power limit) of 15 W. Which is a tad too high to allow for passively cooled designs, besides, laptop makers aren't really obliged to stick to it.

The AMD Ryzen 5 PRO 4650U is manufactured on TSMC's 7 nm process, leading to average, as of mid 2023, energy efficiency.

AMD Ryzen 7 PRO 7840HS

► remove from comparison AMD R7 PRO 7840HS

The AMD Ryzen 7 PRO 7840HS is a fast high-end laptop processor of the Phoenix series. It offers 8 cores (octa core) based on the Zen 4 architecture that supports hyperthreading (16 threads). The cores clock from 3.8 (base) up to 5.1 GHz (single core boost). The processor includes 8 MB L2 cache and 16 MB L3 cache.

Compared to the consumer Ryzen 7 7840HS, the PRO models offer additional security, manageability, and reliability features designed for professional users and workstation environments.

The performance of the R7 PRO 7840HS is only slightly below the fastest model, the R9 PRO 7940HS, as the clock speed difference is only minimal (e.g. -100 MHz / 2% slower single core boost). Therefore, the CPU should also perform slightly higher than the old top model Ryzen 9 6980HX (8 Zen 3 cores with up to 4.9 GHz) at 54W TDP and Ryzen 9 6980HS at 35W TDP. Compared to the higher end Dragon Range series, the 7840HS should be similar to the Ryzen 7 7745HX (also 8 Zen 4 cores, max 5.1 GHz, 55W TDP, 32 MB L3).

The chip integrates a modern and fast RDNA 3 graphics adapter (iGPU) called Radeon 780M with 12 CUs and up to 2.7 GHz clock speed. Furthermore, the Phoenix series include a video engine with AV1 de- and encoding, a new Xilinx FPGA based XDNA AI accelerator (Ryzen AI) that should be faster than the AI engine in the Apple M2 SOC and a dual-channel DDR5-5600 / LPDDR5x-7500 memory controller (with ECC support). The connectivity features includes 2 possible USB 4 (40 Gbps) ports and 20 PCIe 4.0 lanes for a GPU and SSDs.

The Phoenix series uses a single monolithic design (unlike the chiplet design of the 7045HX series) and is manufactured on the modern 4nm process at TSMC. The TDP can be configured between 35 and 45 Watt.

AMD Ryzen 5 7640HS

► remove from comparison AMD R5 7640HS

The Ryzen 5 7640HS is an upper mid-range processor (APU) of the Phoenix product family. It was brought to life in H1 2023 and it has 6 SMT-enabled Zen 4 cores (12 threads) running at 4.3 GHz to 5.0 GHz. The laptop chip is one of the first to feature Ryzen AI, AMD's answer to Intel's DL Boost and GNA technologies. The Radeon 760M iGPU is responsible for carrying out 3D calculations and similar duties.

Architecture & Features

Phoenix family chips are powered by the Zen 4 architecture, much like Dragon Range family chips are. The latter however lacks hardware AI workload acceleration capabilities that Phoenix has.

More importantly, Zen 4 introduces AVX512 support (Zen 3-powered chips did not have that) and, thanks to a plethora of other improvements including larger caches/registers/buffers across the board, is set to bring a double-digit IPC improvement.

Elsewhere, the 7640HS has 16 MB of L3 cache and a super-fast DDR5-5600 / LPDDR5x-7500 RAM controller. USB 4 (and thus Thunderbolt) is supported natively and so is PCIe 4. In fact, 20 PCIe 4 lanes are on offer; data transfer speeds of up to 7.8 GB/s will be possible provided a sufficiently fast NVMe SSD is used.

Systems powered by this Ryzen 5 series chip are expected to run 64-bit Windows 11, 64-bit Windows 10, or Linux. Please note that the APU is not overclockable and neither will you be able to replace it with a faster one as it gets soldered down permanently (FP7, FP7r2, FP8 socket interfaces).

Performance

The average 7640HS in our database is about as fast as the Ryzen 9 5900HX, Ryzen 7 6800H, Ryzen 7 7736U and also the Core i5-12500H, as far as multi-thread benchmark scores are concerned. This is a good if not record-breaking result as of mid 2023. Such a CPU will handle pretty much any task you can throw at it, gaming included.

Your mileage may vary depending on how high the CPU power limits are and how competent the cooling solution of your system is.

Graphics

The Radeon 760M has 8 CUs (512 shaders) running at up to 2,600 MHz. While this is not the best graphics adapter for gaming as it's only just fast enough for low quality settings and resolutions such as 1600 x 900, it will let you connect up to four SUHD 4320p monitors and it also HW-encodes and HW-decodes the most widely used video codecs such as AV1, HEVC and AVC.

Power consumption

The 7640HS has a long-term power limit (default TDP) of 35 W to 54 W, giving laptop makers a choice between improving battery life and giving the system they are working on more oomph. Either way, an active cooling solution is a must for any system powered by this chip.

The APU is built with TSMC's 4 nm process for high, as of late 2023, energy efficiency.

ModelAMD Ryzen 5 PRO 4650UAMD Ryzen 7 PRO 7840HSAMD Ryzen 5 7640HS
SeriesAMD Renoir (Ryzen 4000 APU)AMD Phoenix (Zen 4, Ryzen 7040)AMD Phoenix (Zen 4, Ryzen 7040)
CodenameRenoir-U PRO (Zen 2)Phoenix-HS (Zen 4)Phoenix-HS (Zen 4)
Series: Phoenix (Zen 4, Ryzen 7040) Phoenix-HS (Zen 4)
AMD Ryzen 7 PRO 4750U1.7 - 4.1 GHz8 / 16 cores8 MB L3
AMD Ryzen 5 PRO 4650U « 2.1 - 4 GHz6 / 12 cores8 MB L3
AMD Ryzen 9 7940HS4 - 5.2 GHz8 / 16 cores16 MB L3
AMD Ryzen 9 PRO 7940HS4 - 5.2 GHz8 / 16 cores16 MB L3
AMD Ryzen 7 7840HS3.8 - 5.1 GHz8 / 16 cores16 MB L3
AMD Ryzen 7 7840S3.8 - 5.1 GHz8 / 16 cores16 MB L3
AMD Ryzen 7 PRO 7840HS « 3.8 - 5.1 GHz8 / 16 cores16 MB L3
AMD Ryzen 5 7640HS4.3 - 5 GHz6 / 12 cores16 MB L3
AMD Ryzen 9 7940HS4 - 5.2 GHz8 / 16 cores16 MB L3
AMD Ryzen 9 PRO 7940HS4 - 5.2 GHz8 / 16 cores16 MB L3
AMD Ryzen 7 7840HS3.8 - 5.1 GHz8 / 16 cores16 MB L3
AMD Ryzen 7 7840S3.8 - 5.1 GHz8 / 16 cores16 MB L3
AMD Ryzen 7 PRO 7840HS3.8 - 5.1 GHz8 / 16 cores16 MB L3
AMD Ryzen 5 7640HS « 4.3 - 5 GHz6 / 12 cores16 MB L3
Clock2100 - 4000 MHz3800 - 5100 MHz4300 - 5000 MHz
L1 Cache384 KB512 KB384 KB
L2 Cache3 MB8 MB6 MB
L3 Cache8 MB16 MB16 MB
Cores / Threads6 / 128 / 16
8 x 5.1 GHz AMD Zen 4
6 / 12
TDP15 Watt35 Watt45 Watt
Technology7 nm4 nm4 nm
max. Temp.105 °C100 °C100 °C
SocketFP6FP7/FP8FP7/FP7r2/FP8
FeaturesDDR4-3200/LPDDR4-4266 RAM, PCIe 3, PRO, MMX, SSE, SSE2, SSE3, SSSE3, SSE4A, SSE4.1, SSE4.2, AVX, AVX2, BMI2, ABM, FMA, ADX, SMEP, SMAP, SMT, CPB, AES-NI, RDRAND, RDSEED, SHA, SMEDDR5-5600/LPDDR5x-7500 RAM, PCIe 4, Ryzen AI, AES, AVX, AVX2, AVX512, FMA3, MMX (+), SHA, SSE, SSE2, SSE3, SSE4.1, SSE4.2, SSE4A, SSSE3
iGPUAMD Radeon RX Vega 6 (Ryzen 4000/5000) ( - 1500 MHz)AMD Radeon 780M ( - 2700 MHz)AMD Radeon 760M ( - 2600 MHz)
Architecturex86x86x86
Announced
Manufacturerwww.amd.comwww.amd.comwww.amd.com
Die Size178 mm2178 mm2

Benchmarks

Performance Rating - CB R15 + R20 + 7-Zip + X265 + Blender + 3DM11 CPU - R5 PRO 4650U
31.4 pt (44%)
Performance Rating - CB R15 + R20 + 7-Zip + X265 + Blender + 3DM11 CPU - R7 PRO 7840HS
44.4 pt (62%)
Performance Rating - CB R15 + R20 + 7-Zip + X265 + Blender + 3DM11 CPU - R5 7640HS
43.2 pt (60%)
Cinebench 2024 - Cinebench 2024 CPU Single Core
min: 103.4     avg: 103.7     median: 103.7 (72%)     max: 104 Points
Cinebench 2024 - Cinebench 2024 CPU Multi Core
min: 852     avg: 882     median: 881.5 (16%)     max: 911 Points
Cinebench R23 - Cinebench R23 Multi Core
min: 14240     avg: 15052     median: 15051.5 (14%)     max: 15863 Points
13029 Points (12%)
Cinebench R23 - Cinebench R23 Single Core
min: 1691     avg: 1733     median: 1732.5 (74%)     max: 1774 Points
1715 Points (73%)
Cinebench R20 - Cinebench R20 CPU (Single Core)
min: 453     avg: 453.5     median: 453.5 (50%)     max: 454 Points
min: 651     avg: 672     median: 672 (75%)     max: 693 Points
667 Points (74%)
Cinebench R20 - Cinebench R20 CPU (Multi Core)
min: 2561     avg: 2613     median: 2599 (6%)     max: 2692 Points
min: 5327     avg: 5781     median: 5781 (14%)     max: 6235 Points
5044 Points (12%)
Cinebench R15 - Cinebench R15 CPU Multi 64 Bit
min: 1123     avg: 1153     median: 1161 (7%)     max: 1168 Points
min: 2361     avg: 2440     median: 2440 (15%)     max: 2519 Points
2079 Points (13%)
Cinebench R15 - Cinebench R15 CPU Single 64 Bit
min: 175     avg: 175.5     median: 175 (53%)     max: 177 Points
min: 262     avg: 269     median: 269 (81%)     max: 276 Points
271 Points (82%)
Cinebench R11.5 - Cinebench R11.5 CPU Multi 64 Bit
12.9 Points (17%)
Cinebench R11.5 - Cinebench R11.5 CPU Single 64 Bit
2 Points (50%)
Cinebench R10 - Cinebench R10 Rend. Single (32bit)
5289 Points (32%)
Cinebench R10 - Cinebench R10 Rend. Multi (32bit)
27559 Points (20%)
Cinebench R10 - Cinebench R10 Rend. Multi (64bit)
44658 Points (31%)
Cinebench R10 - Cinebench R10 Rend. Single (64bit)
9114 Points (11%)
wPrime 1.55 - wPrime 1.55 1024m *
235.7 s (1%)
wPrime 1.55 - wPrime 1.55 32m *
7.7 s (4%)
WinRAR - WinRAR 4.0
3795 Points (6%)
7-Zip 18.03 - 7-Zip 18.03 Multli Thread 4 runs
min: 30895     avg: 31827     median: 31980 (18%)     max: 32454 MIPS
min: 62497     avg: 66442     median: 66442 (38%)     max: 70387 MIPS
54954 MIPS (32%)
7-Zip 18.03 - 7-Zip 18.03 Single Thread 4 runs
min: 4202     avg: 4252     median: 4223 (50%)     max: 4359 MIPS
min: 6493     avg: 6496     median: 6495.5 (78%)     max: 6498 MIPS
6465 MIPS (77%)
HWBOT x265 Benchmark v2.2 - HWBOT x265 4k Preset
min: 7.82     avg: 7.9     median: 7.9 (14%)     max: 8.14 fps
min: 18.1     avg: 19     median: 19 (33%)     max: 19.9 fps
16.7 fps (29%)
TrueCrypt - TrueCrypt Serpent
0.8 GB/s (0%)
TrueCrypt - TrueCrypt Twofish
1.2 GB/s (21%)
TrueCrypt - TrueCrypt AES
5.4 GB/s (14%)
Blender - Blender 3.3 Classroom CPU *
min: 325     avg: 327     median: 327 (4%)     max: 329 Seconds
393 Seconds (5%)
Blender - Blender 2.79 BMW27 CPU *
min: 415     avg: 430     median: 428.5 (3%)     max: 448 Seconds
min: 201     avg: 203     median: 203 (1%)     max: 205 Seconds
245 Seconds (2%)
R Benchmark 2.5 - R Benchmark 2.5 *
min: 0.643     avg: 0.7     median: 0.7 (14%)     max: 0.663 sec
min: 0.44     avg: 0.4     median: 0.4 (10%)     max: 0.4487 sec
0.4 sec (10%)
3DMark 06 - CPU - 3DMark 06 - CPU
10182 Points (22%)
14772 Points (31%)
Super Pi mod 1.5 XS 1M - Super Pi mod 1.5 XS 1M *
7.2 s (2%)
Super Pi mod 1.5 XS 2M - Super Pi mod 1.5 XS 2M *
15.6 s (1%)
Super Pi Mod 1.5 XS 32M - Super Pi mod 1.5 XS 32M *
366 s (2%)
3DMark Vantage - 3DM Vant. Perf. CPU no Physx
79794 Points (70%)
3DMark 11 - 3DM11 Performance Physics
min: 8601     avg: 8770     median: 8703 (24%)     max: 9005 Points
min: 17015     avg: 20787     median: 20787 (56%)     max: 24559 Points
17294 Points (47%)
3DMark - 3DMark Cloud Gate Physics
9774 Points (25%)
13652 Points (35%)
3DMark - 3DMark Fire Strike Standard Physics
min: 14641     avg: 15359     median: 15448.5 (28%)     max: 15899 Points
min: 26669     avg: 27465     median: 27464.5 (49%)     max: 28260 Points
21442 Points (38%)
3DMark - 3DMark Time Spy CPU
min: 4299     avg: 4438     median: 4444 (19%)     max: 4565 Points
min: 10679     avg: 10990     median: 10990 (46%)     max: 11301 Points
7659 Points (32%)
Geekbench 6.2 - Geekbench 6.2 Single-Core
min: 2419     avg: 2546     median: 2581 (69%)     max: 2638 Points
2620 Points (71%)
Geekbench 6.2 - Geekbench 6.2 Multi-Core
min: 10518     avg: 12078     median: 12457 (49%)     max: 13259 Points
10936 Points (43%)
Geekbench 5.5 - Geekbench 5.1 - 5.4 64 Bit Single-Core
min: 1065     avg: 1077     median: 1071 (45%)     max: 1102 Points
min: 1822     avg: 1888     median: 1887.5 (80%)     max: 1953 Points
1941 Points (82%)
Geekbench 5.5 - Geekbench 5.1 - 5.4 64 Bit Multi-Core
min: 4581     avg: 4646     median: 4648.5 (8%)     max: 4705 Points
min: 10034     avg: 11037     median: 11036.5 (20%)     max: 12039 Points
9355 Points (17%)
Geekbench 4.4 - Geekbench 4.1 - 4.4 64 Bit Single-Core
4475 Points (45%)
Geekbench 4.4 - Geekbench 4.1 - 4.4 64 Bit Multi-Core
19220 Points (21%)
Geekbench 3 - Geekbench 3 32 Bit Multi-Core
22199 Points (39%)
Geekbench 3 - Geekbench 3 32 Bit Single-Core
4010 Points (78%)
Geekbench 3 - Geekbench 3 64 Bit Multi-Core
22604 Points (35%)
Geekbench 3 - Geekbench 3 64 Bit Single-Core
4202 Points (63%)
Mozilla Kraken 1.1 - Kraken 1.1 Total Score *
min: 866     avg: 867     median: 867 (1%)     max: 869 ms
539 ms (1%)
540 ms (1%)
Octane V2 - Octane V2 Total Score
min: 43657     avg: 44815     median: 44814.5 (39%)     max: 45972 Points
89380 Points (78%)
WebXPRT 4 - WebXPRT 4 Score
min: 222     avg: 242     median: 242 (70%)     max: 262 Points
257 Points (74%)
WebXPRT 3 - WebXPRT 3 Score
min: 185     avg: 187     median: 186 (39%)     max: 190 Points
min: 311     avg: 363     median: 363 (76%)     max: 415 Points
316 Points (66%)
CrossMark - CrossMark Overall
min: 1574     avg: 1620     median: 1620 (62%)     max: 1666 Points
Power Consumption - Prime95 Power Consumption - external Monitor *
min: 36.9     avg: 37.2     median: 37.2 (6%)     max: 37.5 Watt
min: 76.6     avg: 83     median: 83 (14%)     max: 89.4 Watt
Power Consumption - Cinebench R15 Multi Power Consumption - external Monitor *
min: 39.4     avg: 39.8     median: 39.8 (7%)     max: 40.1 Watt
min: 85.9     avg: 86.8     median: 86.8 (16%)     max: 87.7 Watt
Power Consumption - Idle Power Consumption - external Monitor *
min: 5.01     avg: 5.2     median: 5.2 (3%)     max: 5.32 Watt
Power Consumption - Idle Power Consumption 150cd 1min *
min: 5.11     avg: 6.3     median: 6.3 (7%)     max: 7.44 Watt
Power Consumption - Cinebench R15 Multi Power Efficiency - external Monitor
min: 28.9     avg: 29.2     median: 29.2 (22%)     max: 29.5 Points per Watt
27.5 Points per Watt (20%)

Average Benchmarks AMD Ryzen 5 PRO 4650U → 100% n=16

Average Benchmarks AMD Ryzen 7 PRO 7840HS → 182% n=16

Average Benchmarks AMD Ryzen 5 7640HS → 161% n=16

- Range of benchmark values for this graphics card
- Average benchmark values for this graphics card
* Smaller numbers mean a higher performance
1 This benchmark is not used for the average calculation

v1.28
log 30. 22:26:16

#0 checking url part for id 12193 +0s ... 0s

#1 checking url part for id 15054 +0s ... 0s

#2 checking url part for id 14950 +0s ... 0s

#3 redirected to Ajax server, took 1719779175 +0s ... 0s

#4 did not recreate cache, as it is less than 5 days old! Created at Fri, 28 Jun 2024 05:15:21 +0200 +0s ... 0s

#5 composed specs +0.009s ... 0.009s

#6 did output specs +0s ... 0.009s

#7 getting avg benchmarks for device 12193 +0.004s ... 0.013s

#8 got single benchmarks 12193 +0.007s ... 0.02s

#9 getting avg benchmarks for device 15054 +0.004s ... 0.024s

#10 got single benchmarks 15054 +0.006s ... 0.029s

#11 getting avg benchmarks for device 14950 +0.004s ... 0.033s

#12 got single benchmarks 14950 +0.005s ... 0.038s

#13 got avg benchmarks for devices +0s ... 0.038s

#14 min, max, avg, median took s +0.051s ... 0.089s

#15 return log +0s ... 0.089s

Please share our article, every link counts!
> Expert Reviews and News on Laptops, Smartphones and Tech Innovations > Benchmarks / Tech > Processor Comparison - Head 2 Head
Redaktion, 2017-09- 8 (Update: 2023-07- 1)