Notebookcheck Logo

AMD Ryzen 5 7545U vs AMD Ryzen 9 7900X

AMD Ryzen 5 7545U

► remove from comparison AMD R5 7545U

The AMD Ryzen 5 7545U is a fast mid-range laptop processor of the Phoenix series. It offers 6 cores (hexa core) based on the Zen 4 architecture that supports hyperthreading (12 threads). The cores clock from 3.2 (base) up to 4.9 GHz (single core boost). The processor includes 6 MB L2 cache and 16 MB L3 cache.

Thanks to the new Zen 4 architecture and higher clock speeds, the R5 7545U is clearly faster than the old Ryzen 5 6600U (Zen 3, 6 cores, 4.5 GHz). Compared to the similar 7640U, the 7545U offers a lower base clock and a slower iGPU. Compared to the similar Ryzen 5 7540U, the 7545U offers a higher clocked GPU and uses the smaller Zen 4c cores for 4 of the 6 CPU cores.

The chip integrates a modern and fasts RDNA 3 graphics card (iGPU) called Radeon 740M with 4 of the 12 CUs and 2.5 GHz clock speed. Furthermore, the Phoenix series include a video engine with AV1 de- and encoding, and a dual-channel DDR5-5600 / LPDDR5x-7500 memory controller (with ECC support). The connectivity features includes 2 possible USB 4 (40 Gbps) ports and 20 PCIe 4.0 lanes for a GPU and SSDs. The new Xilinx FPGA based XDNA AI accelerator (Ryzen AI) is not included in the 7545U.

The Phoenix series uses a single monolithic design (unlike the chiplet design of the 7045HX series) and is manufactured in the modern 4nm process at TSMC. The TDP can be configured between 15 and 30 Watt (28 Watt default).

AMD Ryzen 9 7900X

► remove from comparison AMD R9 7900X

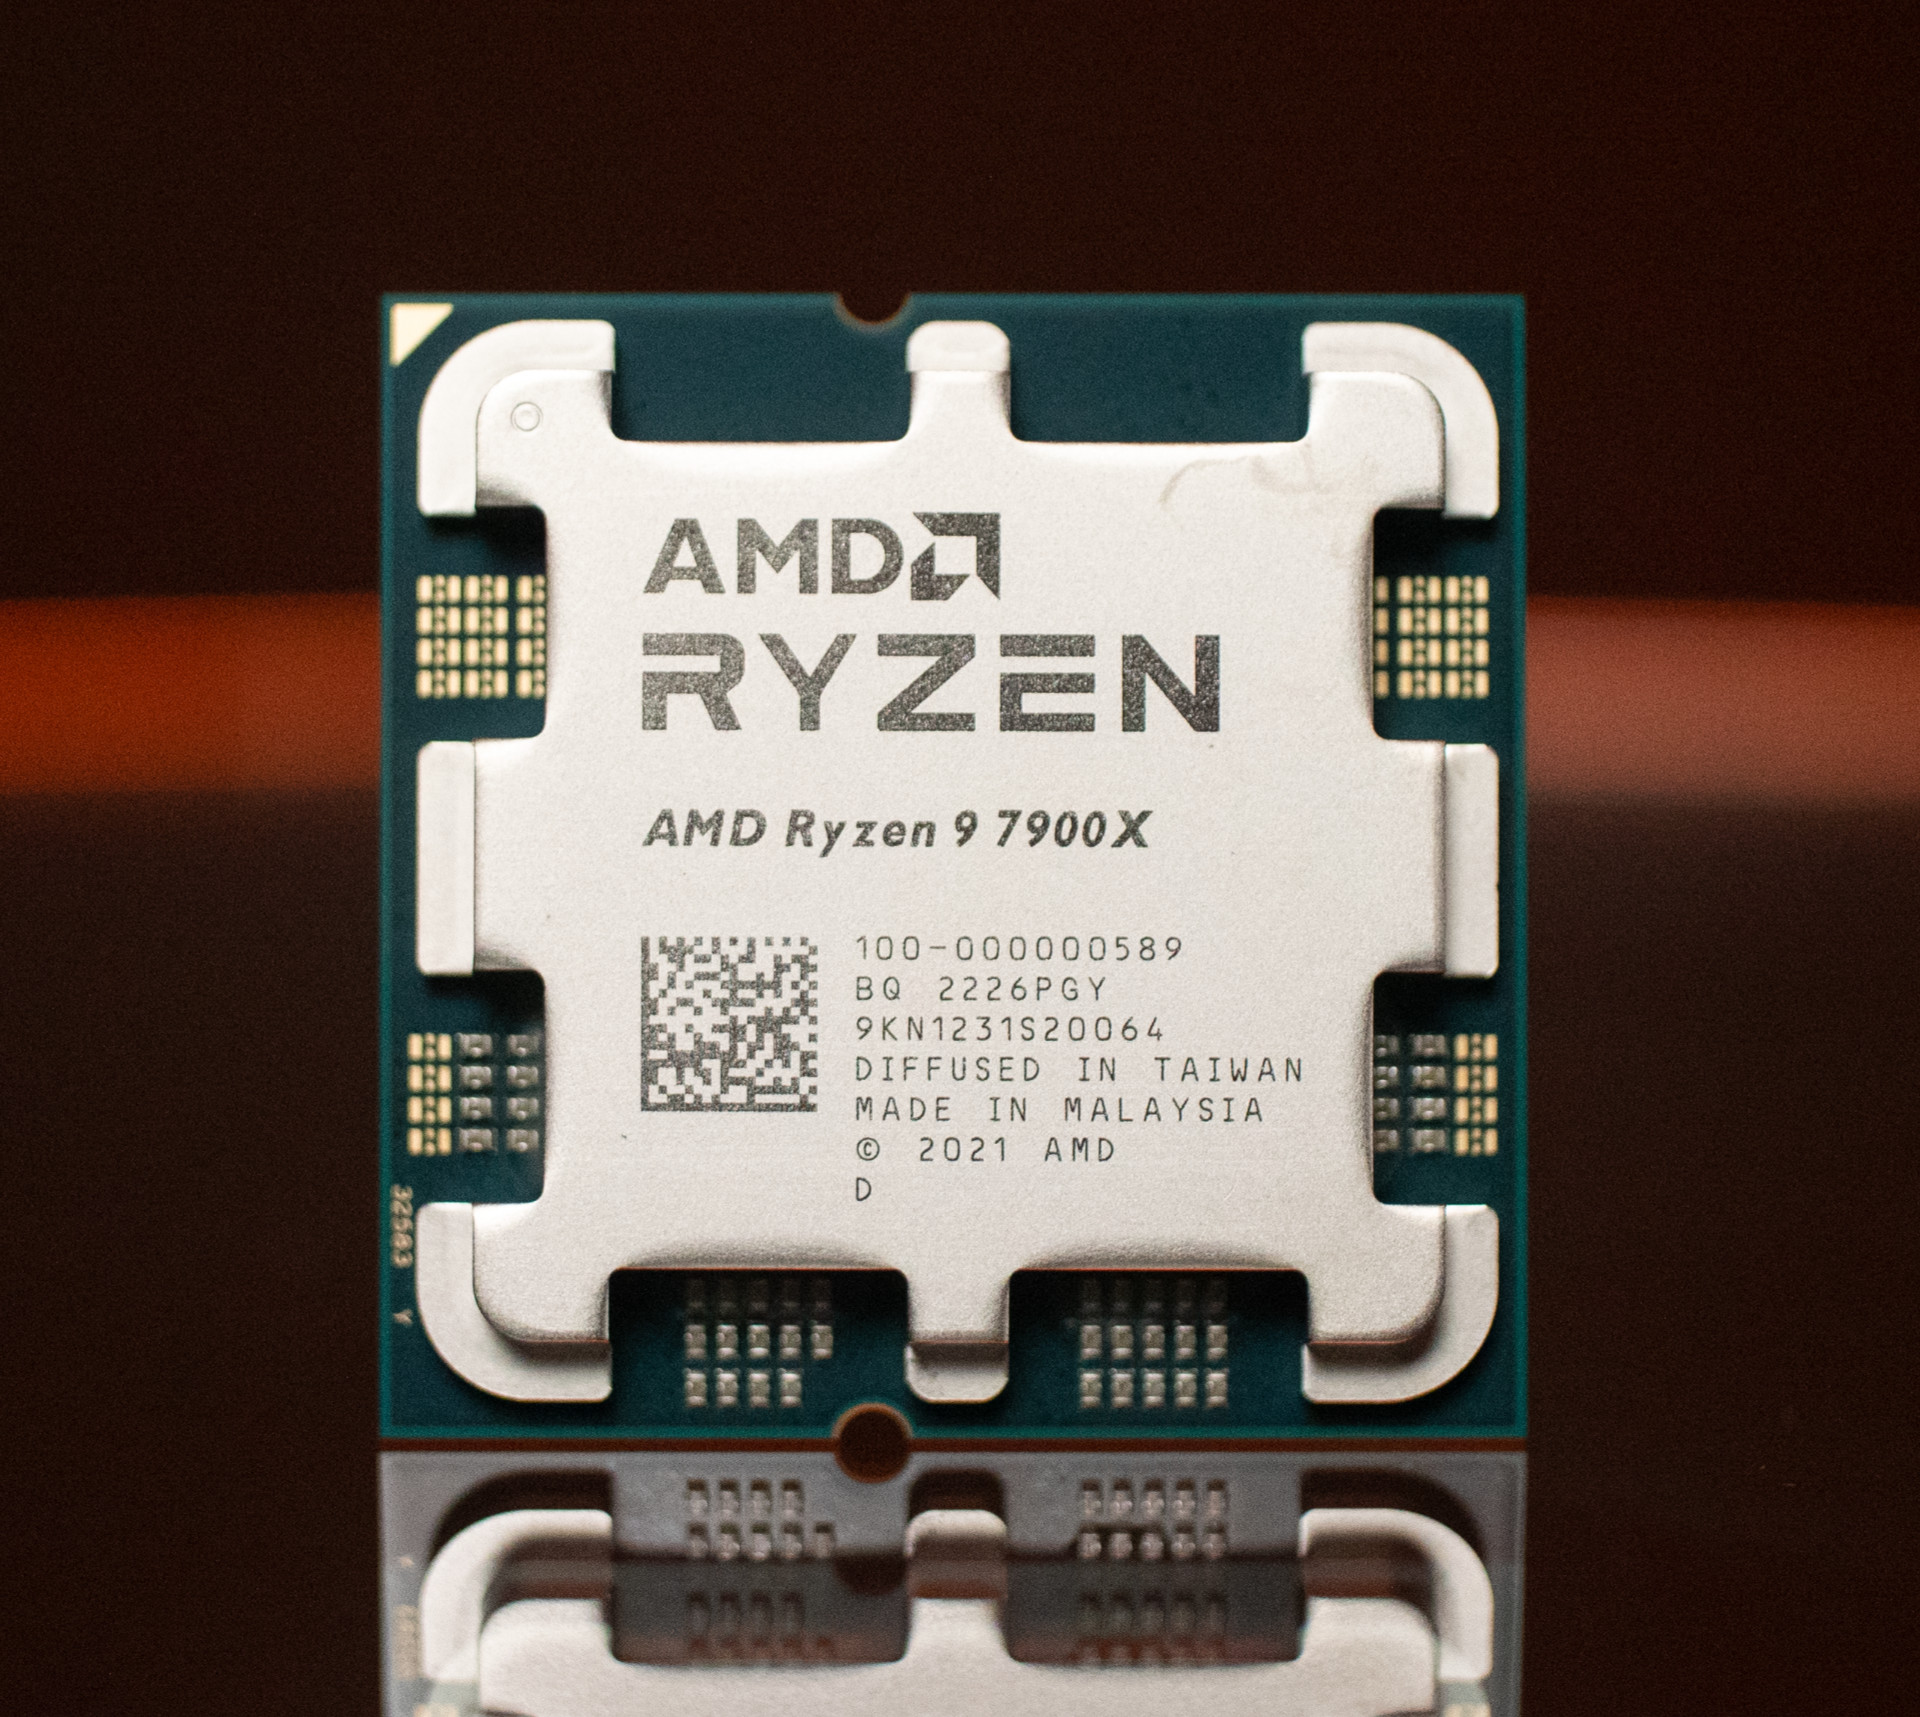
The AMD Ryzen 9 7900X is a fast high-end desktop processor of the Raphael series. It offers 12 cores based on the Zen 4 architecture that supports hyperthreading (24 threads). The cores clock from 4.7 (base) up to 5.7 GHz (single core boost). When all 12 cores are fully loaded, 5.1 GHz is the max. clock speed. The 7900X is the second fastest Ryzen at launch, only bested by the Ryzen 9 7950X with 4 more cores.

The performance of the R9 7900X is clearly better than the old Ryzen 9 5900X thanks to the improved architecture and modern 5nm process. Compared to Intels Raptor Lake Core i9-13700K the single-core performance is slightly lower and the multi-core performance slightly faster. The gaming performance is a bit lower, and is on average only on par with the Core i5-13600K and also lower than the old Ryzen 7 5800X3D.

The Raphael series still uses a chiplet design with two CCD-clusters (each with 8 possible cores) in 5nm and an IO-die (including the memory controller and the Radeon Graphics iGPU) in 6nm.

ModelAMD Ryzen 5 7545UAMD Ryzen 9 7900X
SeriesAMD Phoenix (Zen 4, Ryzen 7040)AMD Raphael (Zen 4, Ryzen 7000)
CodenamePhoenix (Zen4)Raphael (Zen4)
Series: Raphael (Zen 4, Ryzen 7000) Raphael (Zen4)
AMD Ryzen 5 PRO 7640HS compare4.3 - 5 GHz6 / 12 cores16 MB L3
AMD Ryzen Z1 compare3.2 - 4.9 GHz6 / 12 cores16 MB L3
AMD Ryzen 5 PRO 7640U compare3.5 - 4.9 GHz6 / 12 cores16 MB L3
AMD Ryzen 5 PRO 7540U compare3.2 - 4.9 GHz6 / 12 cores16 MB L3
AMD Ryzen 5 7545U « 3.2 - 4.9 GHz6 / 12 cores16 MB L3
AMD Ryzen 5 7540U compare3.2 - 4.9 GHz6 / 12 cores16 MB L3
AMD Ryzen 9 7950X3D compare4.2 - 5.7 GHz16 / 32 cores128 MB L3
AMD Ryzen 9 7900X « 4.7 - 5.6 GHz12 / 24 cores64 MB L3
AMD Ryzen 9 7900 compare3.7 - 5.4 GHz12 / 24 cores64 MB L3
AMD Ryzen 7 7700X compare4.5 - 5.4 GHz8 / 16 cores32 MB L3
AMD Ryzen 7 7700 compare3.8 - 5.3 GHz8 / 16 cores32 MB L3
AMD Ryzen 7 7800X3D compare4.2 - 5 GHz8 / 16 cores96 MB L3
AMD Ryzen 5 7600X compare4.7 - 5.3 GHz6 / 12 cores32 MB L3
AMD Ryzen 5 7600 compare3.8 - 5.1 GHz6 / 12 cores32 MB L3
Clock3200 - 4900 MHz4700 - 5600 MHz
L1 Cache384 KB768 KB
L2 Cache6 MB12 MB
L3 Cache16 MB64 MB
Cores / Threads6 / 12
2 x 4.9 GHz AMD Zen 4
4 x 4.9 GHz AMD Zen 4c
12 / 24
TDP28 Watt170 Watt
4 nm5 nm (CCD), 6 nm (I/O) nm, 0.650 - 1.475V
Die Size178 mm22x 70 (CCD) mm2 + 122 (I/O) mm2
max. Temp.100 °C95 °C
iGPUAMD Radeon 740M ( - 2800 MHz)AMD Radeon Graphics (Ryzen 7000)
Architecturex86x86
Announced
Manufacturerwww.amd.com
TransistorsCCD: 6,5 Mrd + IOD: 3,4 Mrd Million
SocketAM5 (LGA 1718)
FeaturesMMX(+), SSE, SSE2, SSE3, SSSE3, SSE4.1, SSE4.2, SSE4A, x86-64, AMD-V, AES, AVX, AVX2, AVX512F, FMA3, SHA, Precision Boost 2

Benchmarks

Performance Rating - CB R15 + R20 + 7-Zip + X265 + Blender + 3DM11 CPU - R9 7900X
57.1 pt (79%)
Cinebench R23 - Cinebench R23 Multi Core
min: 28925     avg: 29289     median: 29300 (27%)     max: 29628 Points
Cinebench R23 - Cinebench R23 Single Core
min: 2012     avg: 2020     median: 2016.5 (86%)     max: 2039 Points
Cinebench R20 - Cinebench R20 CPU (Single Core)
min: 780     avg: 783     median: 782.5 (87%)     max: 787 Points
Cinebench R20 - Cinebench R20 CPU (Multi Core)
min: 11353     avg: 11474     median: 11471.5 (28%)     max: 11623 Points
Cinebench R15 - Cinebench R15 CPU Multi 64 Bit
min: 4753     avg: 4818     median: 4820.5 (30%)     max: 4856 Points
Cinebench R15 - Cinebench R15 CPU Single 64 Bit
min: 319     avg: 322.2     median: 323 (97%)     max: 325 Points
Cinebench R11.5 - Cinebench R11.5 CPU Multi 64 Bit
min: 53.91     avg: 54.6     median: 54.7 (71%)     max: 55.26 Points
Cinebench R11.5 - Cinebench R11.5 CPU Single 64 Bit
min: 3.78     avg: 3.8     median: 3.8 (95%)     max: 3.85 Points
Cinebench R10 - Cinebench R10 Rend. Single (32bit)
min: 8465     avg: 8658     median: 8623 (52%)     max: 8858 Points
Cinebench R10 - Cinebench R10 Rend. Multi (32bit)
min: 67036     avg: 68658     median: 68579.5 (50%)     max: 70741 Points
Cinebench R10 - Cinebench R10 Rend. Multi (64bit)
min: 121250     avg: 126872     median: 125768 (87%)     max: 134469 Points
Cinebench R10 - Cinebench R10 Rend. Single (64bit)
min: 16151     avg: 16234     median: 16246 (20%)     max: 16338 Points
wPrime 2.10 - wPrime 2.0 1024m *
min: 39.576     avg: 40.4     median: 40.3 (0%)     max: 41.122 s
wPrime 2.10 - wPrime 2.0 32m *
min: 1.781     avg: 1.8     median: 1.8 (0%)     max: 1.872 s
WinRAR - WinRAR 4.0
17225 Points (27%)
7-Zip 18.03 - 7-Zip 18.03 Multli Thread 4 runs
min: 124975     avg: 127080     median: 127195 (73%)     max: 129087 MIPS
7-Zip 18.03 - 7-Zip 18.03 Single Thread 4 runs
min: 8252     avg: 8280     median: 8269 (99%)     max: 8345 MIPS
X264 HD Benchmark 4.0 - x264 Pass 2
241 fps (84%)
X264 HD Benchmark 4.0 - x264 Pass 1
376 fps (87%)
HWBOT x265 Benchmark v2.2 - HWBOT x265 4k Preset
min: 36.2     avg: 36.8     median: 36.9 (65%)     max: 37.1 fps
TrueCrypt - TrueCrypt Serpent
1.5 GB/s (0%)
TrueCrypt - TrueCrypt Twofish
2.8 GB/s (48%)
TrueCrypt - TrueCrypt AES
14.8 GB/s (39%)
Blender - Blender 3.3 Classroom CPU *
min: 165     avg: 166.4     median: 166 (2%)     max: 168 Seconds
Blender - Blender 2.79 BMW27 CPU *
min: 105     avg: 106.2     median: 106 (1%)     max: 107 Seconds
R Benchmark 2.5 - R Benchmark 2.5 *
min: 0.3643     avg: 0.4     median: 0.4 (8%)     max: 0.3758 sec
3DMark 06 - CPU - 3DMark 06 - CPU
min: 20439     avg: 21223     median: 21284 (45%)     max: 21659 Points
Super Pi mod 1.5 XS 1M - Super Pi mod 1.5 XS 1M *
6.1 s (1%)
Super Pi mod 1.5 XS 2M - Super Pi mod 1.5 XS 2M *
13.3 s (1%)
Super Pi Mod 1.5 XS 32M - Super Pi mod 1.5 XS 32M *
313.4 s (1%)
3DMark Vantage - 3DM Vant. Perf. CPU no Physx
min: 82063     avg: 100438     median: 102019 (89%)     max: 102765 Points
3DMark 11 - 3DM11 Performance Physics
min: 26455     avg: 27800     median: 27731 (75%)     max: 28963 Points
3DMark - 3DMark Ice Storm Physics
min: 96003     avg: 102745     median: 103232 (84%)     max: 105350 Points
3DMark - 3DMark Ice Storm Extreme Physics
min: 97281     avg: 102964     median: 103220 (84%)     max: 106230 Points
3DMark - 3DMark Ice Storm Unlimited Physics
min: 94657     avg: 102993     median: 101826 (86%)     max: 108551 Points
3DMark - 3DMark Cloud Gate Physics
min: 25631     avg: 26260     median: 26310.5 (67%)     max: 26732 Points
3DMark - 3DMark Fire Strike Standard Physics
min: 40436     avg: 42329     median: 42325 (75%)     max: 43200 Points
3DMark - 3DMark Time Spy CPU
min: 13634     avg: 15940     median: 15959.5 (67%)     max: 16721 Points
Geekbench 5.5 - Geekbench 5.1 - 5.4 64 Bit Single-Core
min: 2274     avg: 2290     median: 2294 (97%)     max: 2297 Points
Geekbench 5.5 - Geekbench 5.1 - 5.4 64 Bit Multi-Core
min: 19987     avg: 20553     median: 20667.5 (37%)     max: 20799 Points
Geekbench 5.0 - Geekbench 5.0 64 Bit Single-Core
min: 2183     avg: 2195     median: 2196 (10%)     max: 2201 Points
Geekbench 5.0 - Geekbench 5.0 64 Bit Multi-Core
min: 19975     avg: 20532     median: 20658 (65%)     max: 20765 Points
Geekbench 4.4 - Geekbench 4.1 - 4.4 64 Bit Single-Core
min: 9193     avg: 9260     median: 9275 (93%)     max: 9311 Points
Geekbench 4.4 - Geekbench 4.1 - 4.4 64 Bit Multi-Core
min: 74731     avg: 76662     median: 77033 (85%)     max: 77769 Points
Mozilla Kraken 1.1 - Kraken 1.1 Total Score *
min: 431     avg: 438     median: 440 (1%)     max: 441 ms
WebXPRT 4 - WebXPRT 4 Score
min: 300     avg: 305.8     median: 304.5 (88%)     max: 314 Points
WebXPRT 3 - WebXPRT 3 Score
min: 371     avg: 383.8     median: 383 (80%)     max: 395 Points
CrossMark - CrossMark Overall
min: 2315     avg: 2370     median: 2370 (91%)     max: 2408 Points
Power Consumption - Prime95 Power Consumption - external Monitor *
319 Watt (55%)
Power Consumption - Cinebench R15 Multi Power Consumption - external Monitor *
313 Watt (57%)
Power Consumption - Idle Power Consumption - external Monitor *
94.1 Watt (62%)
Power Consumption - Cinebench R15 Multi Power Efficiency - external Monitor
15.5 Points per Watt (12%)

Average Benchmarks AMD Ryzen 9 7900X → 0% n=

- Range of benchmark values for this graphics card
- Average benchmark values for this graphics card
* Smaller numbers mean a higher performance
1 This benchmark is not used for the average calculation

Add one or more devices and compare

In the following list you can select (and also search for) devices that should be added to the comparison. You can select more than one device.

restrict list:

show all (including archived), 2024, 2023
v1.28
log 04. 06:14:16

#0 checking url part for id 16407 +0s ... 0s

#1 checking url part for id 14608 +0s ... 0s

#2 redirected to Ajax server, took 1720066456 +0s ... 0s

#3 did not recreate cache, as it is less than 5 days old! Created at Thu, 04 Jul 2024 05:15:21 +0200 +0s ... 0s

#4 composed specs +0.006s ... 0.006s

#5 did output specs +0s ... 0.006s

#6 getting avg benchmarks for device 16407 +0.001s ... 0.007s

#7 got single benchmarks 16407 +0s ... 0.007s

#8 getting avg benchmarks for device 14608 +0.003s ... 0.01s

#9 got single benchmarks 14608 +0.018s ... 0.028s

#10 got avg benchmarks for devices +0s ... 0.028s

#11 min, max, avg, median took s +0.027s ... 0.055s

#12 return log +0.002s ... 0.057s

Please share our article, every link counts!
> Expert Reviews and News on Laptops, Smartphones and Tech Innovations > Benchmarks / Tech > Processor Comparison - Head 2 Head
Redaktion, 2017-09- 8 (Update: 2023-07- 1)