AMD Ryzen 5 7530U vs AMD Ryzen 7 4800U vs AMD Ryzen 7 7730U
AMD Ryzen 5 7530U ► remove from comparison
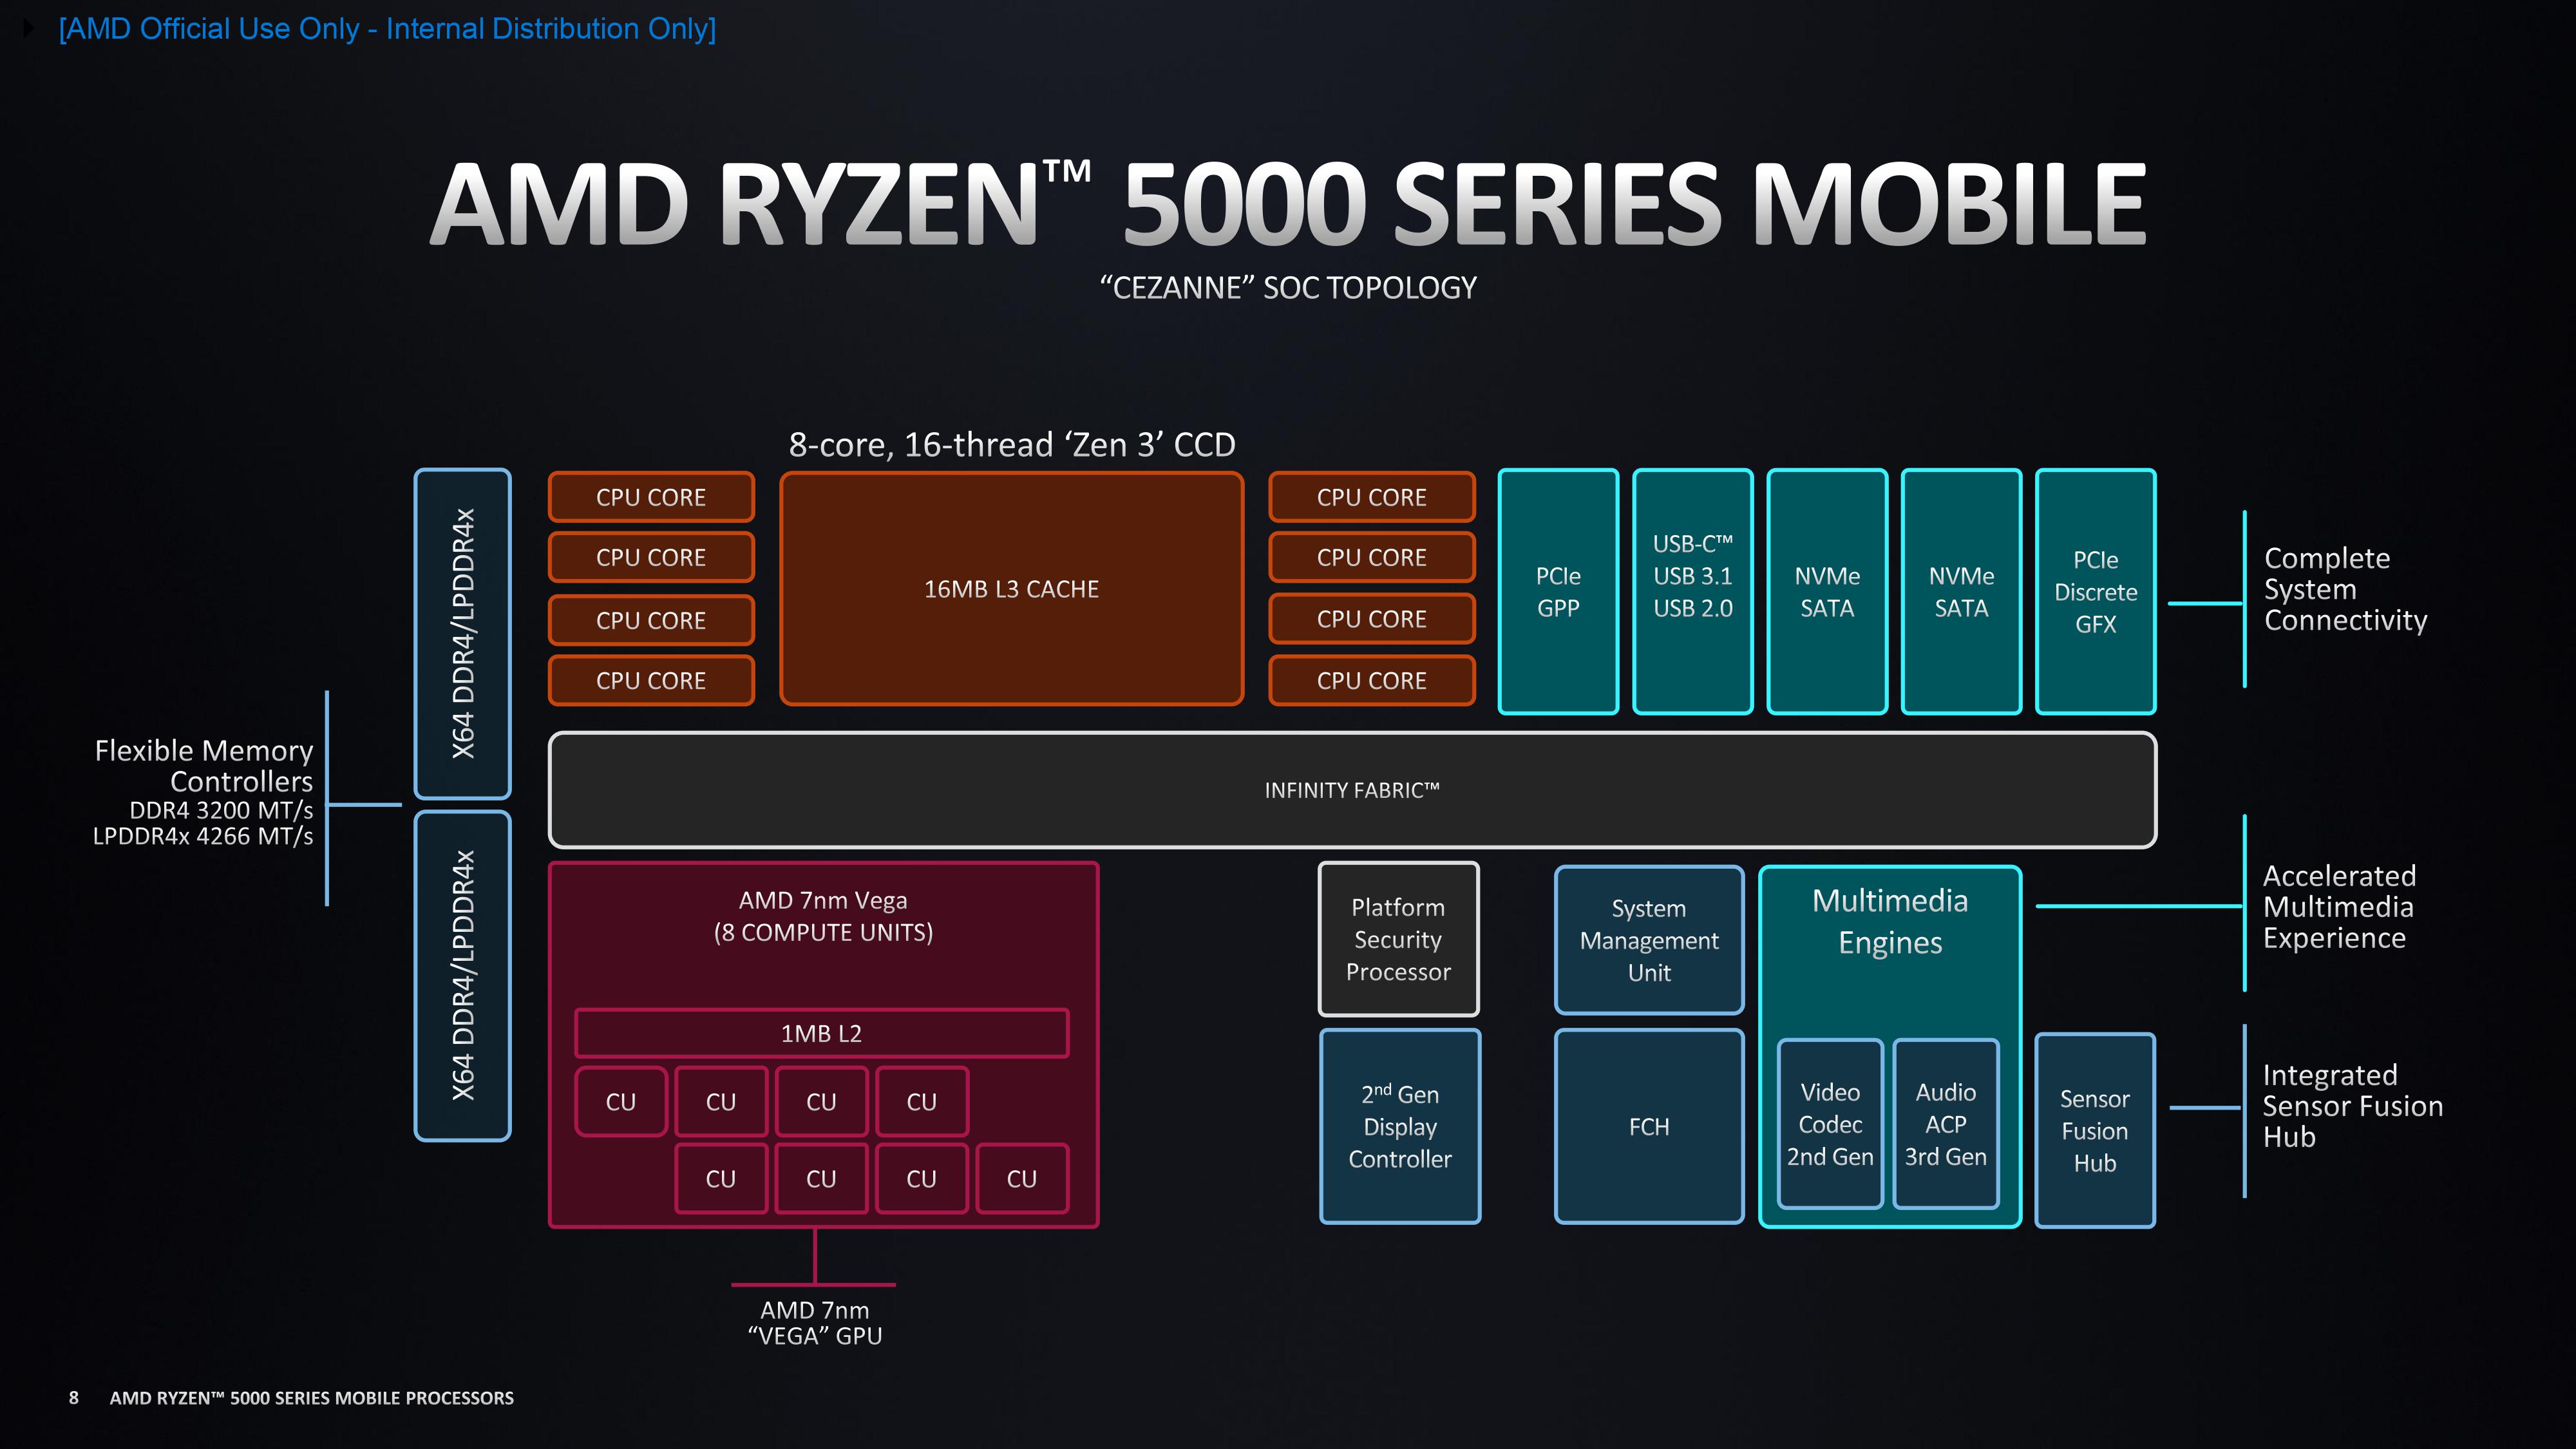
The AMD Ryzen 5 7530U is a processor for thin and light laptops based on the Cezanne generation. It is part of the second "Barcelo" refresh in early 2023 and offers 200 MHz higher boost clock for the CPU cores compared to the old Ryzen 5 5625U (but a slower base clock speed). The R5 7530U integrates six of the eight cores based on the Zen 3 microarchitecture. The cores are clocked at 2 (guaranteed base clock) to 4.5 GHz (single core boost) and support SMT for a total of 12 threads. The chip is manufactured in 7 nm at TSMC.
Performance
The average 7530U in our database is in the same league as the Ryzen 5 5625U , Ryzen 7 4800U , Ryzen 7 PRO 5850U , Core i5-1335U , as far as multi-thread benchmark scores are concerned.
Thanks to its decent cooling solution and a long-term CPU power limit of 37 W, the VivoBook 15X OLED M3504YA is among the fastest laptops built around the 7530U that we know of. It can be roughly 40% faster in CPU-bound workloads than the slowest system featuring the same chip in our database, as of August 2023.
In addition to the six CPU cores, the APU also integrates a Radeon RX Vega 7 (now only called Radeon Graphics) integrated graphics card with 7 CUs at up to 2 GHz. The dual channel memory controller supports DDR4-3200 and energy efficient LPDDR4-4266 RAM. Furthermore, 16 MB level 3 cache (up from 8 MB at the 4800U) can be found on the chip.
Power consumption
This Ryzen has a default TDP of 15 W (also known as the Power Limit 1).
AMD Ryzen 7 4800U ► remove from comparison
The AMD Ryzen 7 4800U is a processor for thin and light laptops based on the Renoir architecture . The 4800U integrates all eight cores based on the Zen 2 microarchitecture. They are clocked at 1.8 (guaranteed base clock) to 4.2 GHz (Turbo) and support SMT / Hyperthreading (16 threads). The chip is manufactured in the modern 7 nm process at TSMC and partly thanks to it AMD advertises a 2x improved performance per Watt for the Renoir chips. Compared to the similar named Ryzen 7 4800H, the 4800U offers a lower TDP (15 versus 45 Watt) and base clock (1.8 versus 2.9 GHz).
According to AMD, the Ryzen 7 4800U is 4% faster in Cinebench R20 single thread test and 90 % faster in the multithreaded test compared to the fast Intel Core i7-1065G7 (Ice Lake, 4 cores, 3.9 GHz). This means the CPU should be one of the fastest processors in the 15 Watt TDP range and well suited for demanding tasks. The sustained performance however ist strongly depending on the cooling system and the TDP settings of the laptop.
In addition to the eight CPU cores, the APU also integrates a Radeon RX Vega 8 integrated graphics card with 8 CUs and up to 1750 MHz. The dual channel memory controller supports DDR4-3200 and energy efficient LPDDR4-4266 RAM. Furthermore, 8 MB level 3 cache can be found on the chip. See our hub page on the Renoir Processors for more information.
The TDP of the APU is specified at 15 Watt (default) and can be configured from 10 to 25 Watt by the laptop vendor. That means the chip is intended for thin and light laptops (but with fans).
AMD Ryzen 7 7730U ► remove from comparison
The AMD Ryzen 7 7730U is a processor for thin and light laptops based on the Cezanne generation. It is part of the second "Barcelo" refresh in early 2023 and offers the same specifications as the old Ryzen 7 5825U . The CPU integrates all eight cores based on the Zen 3 microarchitecture clocked at 2 (guaranteed base clock) to 4.5 GHz (Turbo) and support SMT / Hyperthreading (16 threads). The chip is manufactured in 7nm at TSMC.
The Zen 3 microarchitecture offers a significantly higher IPC (instructions per clock) compared to Zen 2 but stays behind the current Zen 4 based CPUs (e.g. 7040HS series).
Performance
The average 7730U in our database is in the same league as the Ryzen 7 5825U , Ryzen 7 6800U , Ryzen 7 PRO 6850U and also the Core i7-1360P , as far as multi-thread benchmark scores are concerned.
Thanks to its decent cooling solution and a long-term CPU power limit of 30 W, the ThinkPad E14 G5-21JSS05C00 is among the fastest laptops built around the 7730U that we know of. It can be almost 40% faster in CPU-bound workloads than the slowest system featuring the same chip in our database, as of August 2023.
In addition to the eight CPU cores, the APU also integrates a Radeon RX Vega 8 GPU with 8 CUs at up to 2000 MHz. The dual channel memory controller supports DDR4-3200 and energy efficient LPDDR4-4266 RAM. Furthermore, 16 MB level 3 cache (up from 8 MB at the 4800U) can be found on the chip.
The TDP of the APU is specified at 15 Watt (the 5825U was specified at 10 - 25W).
Model AMD Ryzen 5 7530U AMD Ryzen 7 4800U AMD Ryzen 7 7730U Series AMD Cezanne (Zen 3, Ryzen 5000) AMD Renoir (Ryzen 4000 APU) AMD Cezanne (Zen 3, Ryzen 5000) Codename Barcelo-U Refresh Renoir-U (Zen 2) Barcelo-U Refresh Series: Cezanne (Zen 3, Ryzen 5000) Barcelo-U Refresh Clock 2000 - 4500 MHz 1800 - 4200 MHz 2000 - 4500 MHz L1 Cache 384 KB 512 KB 512 KB L2 Cache 3 MB 4 MB 4 MB L3 Cache 16 MB 8 MB 16 MB Cores / Threads 6 / 12 8 / 16 8 / 16 TDP 15 Watt 15 Watt 15 Watt Technology 7 nm 7 nm 7 nm max. Temp. 95 °C 105 °C 95 °C Socket FP6 FP6 FP6 Features DDR4-3200/LPDDR4x-4266 RAM (incl. ECC), PCIe 3, MMX, SSE, SSE2, SSE3, SSSE3, SSE4A, SSE4.1, SSE4.2, AVX, AVX2, BMI2, ABM, FMA, ADX, SMEP, SMAP, SMT, CPB, AES-NI, RDRAND, RDSEED, SHA, SME DDR4-3200/LPDDR4-4266 RAM, PCIe 3, MMX, SSE, SSE2, SSE3, SSSE3, SSE4A, SSE4.1, SSE4.2, AVX, AVX2, BMI2, ABM, FMA, ADX, SMEP, SMAP, SMT, CPB, AES-NI, RDRAND, RDSEED, SHA, SME DDR4-3200/LPDDR4x-4266 RAM (incl. ECC), PCIe 3, MMX, SSE, SSE2, SSE3, SSSE3, SSE4A, SSE4.1, SSE4.2, AVX, AVX2, BMI2, ABM, FMA, ADX, SMEP, SMAP, SMT, CPB, AES-NI, RDRAND, RDSEED, SHA, SME iGPU AMD Radeon RX Vega 7 ( - 2000 MHz)AMD Radeon RX Vega 8 (Ryzen 4000/5000) ( - 1750 MHz)AMD Radeon RX Vega 8 (Ryzen 4000/5000) ( - 2000 MHz)Architecture x86 x86 x86 Announced Manufacturer www.amd.com www.amd.com www.amd.com
Benchmarks Performance Rating - CB R15 + R20 + 7-Zip + X265 + Blender + 3DM11 CPU - R5 7530U
37 pt (51%)
...
Intel Core i5-11500B
...
max:
Performance Rating - CB R15 + R20 + 7-Zip + X265 + Blender + 3DM11 CPU - R7 4800U
33.2 pt (46%)
...
...
max:
Performance Rating - CB R15 + R20 + 7-Zip + X265 + Blender + 3DM11 CPU - R7 7730U
38.3 pt (53%)
...
...
max:
Cinebench 2024 - Cinebench 2024 CPU Single Core
83 Points (58%)
Cinebench 2024 - Cinebench 2024 CPU Multi Core
455 Points (8%)
Cinebench R23 - Cinebench R23 Multi Core
min: 6931 avg: 8479 median: 8418.5 (8%) max: 9347 Points
CPU TDP ? TDP 15 W TDP 20 W TDP 23 W TDP 25 W TDP 28 W TDP 37 W TDP 38 W 100% 74% 91% 89% 84% 89% 99% 100%
min: 7558 avg: 8565 median: 8376 (8%) max: 9762 Points
CPU TDP ? TDP 15 W TDP 20 W TDP 23 W TDP 25 W TDP 28 W TDP 37 W TDP 38 W 100% 73% 84% 87% 85% 88% 97% 98%
min: 7286 avg: 10291 median: 10801.5 (10%) max: 11490 Points
CPU TDP ? TDP 15 W TDP 20 W TDP 23 W TDP 25 W TDP 28 W TDP 30 W TDP 37 W TDP 38 W 90% 65% 75% 78% 82% 79% 100% 95% 88%
Cinebench R23 - Cinebench R23 Single Core
min: 1371 avg: 1438 median: 1443 (61%) max: 1470 Points
CPU TDP ? TDP 15 W TDP 20 W TDP 23 W TDP 25 W TDP 28 W TDP 37 W TDP 38 W 98% 93% 97% 98% 99% 98% 100% 100%
min: 1231 avg: 1235 median: 1235 (53%) max: 1240 Points
CPU TDP ? TDP 15 W TDP 20 W TDP 23 W TDP 25 W TDP 28 W TDP 37 W TDP 38 W 91% 93% 90% 98% 92% 98% 100% 100%
min: 1335 avg: 1435 median: 1454.5 (62%) max: 1466 Points
CPU TDP ? TDP 15 W TDP 20 W TDP 23 W TDP 25 W TDP 28 W TDP 30 W TDP 37 W TDP 38 W 92% 94% 91% 98% 93% 98% 100% 100% 100%
Cinebench R20 - Cinebench R20 CPU (Single Core)
min: 528 avg: 561 median: 565 (63%) max: 574 Points
CPU TDP ? TDP 15 W TDP 20 W TDP 23 W TDP 25 W TDP 28 W TDP 37 W TDP 38 W 99% 92% 97% 98% 99% 98% 100% 99%
min: 474 avg: 480.5 median: 480 (53%) max: 488 Points
CPU TDP ? TDP 15 W TDP 20 W TDP 23 W TDP 25 W TDP 28 W TDP 37 W TDP 38 W 88% 92% 91% 98% 92% 98% 100% 99%
min: 533 avg: 560 median: 566.5 (63%) max: 573 Points
CPU TDP ? TDP 15 W TDP 20 W TDP 23 W TDP 25 W TDP 28 W TDP 30 W TDP 37 W TDP 38 W 89% 92% 91% 99% 93% 99% 99% 100% 100%
Cinebench R20 - Cinebench R20 CPU (Multi Core)
min: 2833 avg: 3304 median: 3288 (8%) max: 3655 Points
CPU TDP ? TDP 15 W TDP 20 W TDP 23 W TDP 25 W TDP 28 W TDP 37 W TDP 38 W 99% 78% 84% 90% 83% 90% 99% 100%
min: 2943 avg: 3178 median: 3230.5 (8%) max: 3306 Points
CPU TDP ? TDP 15 W TDP 20 W TDP 23 W TDP 25 W TDP 28 W TDP 37 W TDP 38 W 93% 78% 82% 90% 86% 90% 99% 100%
min: 2849 avg: 3885 median: 4070.5 (10%) max: 4267 Points
CPU TDP ? TDP 15 W TDP 20 W TDP 23 W TDP 25 W TDP 28 W TDP 30 W TDP 37 W TDP 38 W 82% 68% 73% 80% 78% 79% 100% 95% 88%
Cinebench R15 - Cinebench R15 CPU Multi 64 Bit
min: 1289 avg: 1447 median: 1457.5 (9%) max: 1599 Points
CPU TDP ? TDP 15 W TDP 20 W TDP 23 W TDP 25 W TDP 28 W TDP 37 W TDP 38 W 100% 81% 81% 94% 83% 88% 96% 100%
min: 1281 avg: 1444 median: 1411 (9%) max: 1639 Points
CPU TDP ? TDP 15 W TDP 20 W TDP 23 W TDP 25 W TDP 28 W TDP 37 W TDP 38 W 100% 80% 80% 93% 85% 87% 95% 99%
min: 1588 avg: 1800 median: 1830 (12%) max: 1942 Points
CPU TDP ? TDP 15 W TDP 20 W TDP 23 W TDP 25 W TDP 28 W TDP 30 W TDP 37 W TDP 38 W 90% 72% 72% 84% 87% 79% 100% 95% 89%
Cinebench R15 - Cinebench R15 CPU Single 64 Bit
min: 213 avg: 229.5 median: 230.5 (69%) max: 237 Points
CPU TDP ? TDP 15 W TDP 20 W TDP 23 W TDP 25 W TDP 28 W TDP 37 W TDP 38 W 96% 90% 97% 97% 99% 97% 100% 99%
min: 182 avg: 184 median: 183 (55%) max: 187 Points
CPU TDP ? TDP 15 W TDP 20 W TDP 23 W TDP 25 W TDP 28 W TDP 37 W TDP 38 W 86% 90% 87% 97% 89% 97% 100% 99%
min: 221 avg: 229.2 median: 231 (70%) max: 233 Points
CPU TDP ? TDP 15 W TDP 20 W TDP 23 W TDP 25 W TDP 28 W TDP 30 W TDP 37 W TDP 38 W 88% 91% 88% 98% 93% 99% 99% 100% 100%
Cinebench R11.5 - Cinebench R11.5 CPU Multi 64 Bit
17.8 Points (23%)
19.1 Points (25%)
CPU TDP ? TDP 25 W 94% 100%
Cinebench R11.5 - Cinebench R11.5 CPU Single 64 Bit
2.2 Points (53%)
2.8 Points (69%)
CPU TDP ? TDP 25 W 78% 100%
Cinebench R10 - Cinebench R10 Rend. Single (32bit)
5690 Points (34%)
6243 Points (38%)
CPU TDP ? TDP 25 W 91% 100%
Cinebench R10 - Cinebench R10 Rend. Multi (32bit)
33649 Points (24%)
32670 Points (24%)
CPU TDP ? TDP 25 W 100% 97%
Cinebench R10 - Cinebench R10 Rend. Multi (64bit)
57058 Points (40%)
Cinebench R10 - Cinebench R10 Rend. Single (64bit)
11653 Points (14%)
wPrime 2.10 - wPrime 2.0 1024m *
99.5 s (1%)
121.2 s (1%)
CPU TDP ? TDP 25 W 100% 100%
wPrime 2.10 - wPrime 2.0 32m *
3.6 s (1%)
4.4 s (1%)
CPU TDP ? TDP 25 W 100% 100%
3881 Points (6%)
5881 Points (9%)
CPU TDP ? TDP 25 W 66% 100%
7-Zip 18.03 - 7-Zip 18.03 Multli Thread 4 runs
min: 32204 avg: 37957 median: 37983 (22%) max: 42364 MIPS
CPU TDP 15 W TDP 20 W TDP 23 W TDP 25 W TDP 28 W TDP 37 W TDP 38 W 76% 87% 88% 90% 91% 97% 100%
min: 38654 avg: 41192 median: 40117 (23%) max: 44804 MIPS
CPU TDP ? TDP 15 W TDP 20 W TDP 23 W TDP 25 W TDP 28 W TDP 37 W TDP 38 W 100% 72% 84% 83% 87% 86% 91% 95%
min: 40263 avg: 48295 median: 49424.5 (28%) max: 51898 MIPS
CPU TDP ? TDP 15 W TDP 20 W TDP 23 W TDP 25 W TDP 28 W TDP 30 W TDP 37 W TDP 38 W 91% 65% 77% 75% 86% 78% 100% 94% 86%
7-Zip 18.03 - 7-Zip 18.03 Single Thread 4 runs
min: 5113 avg: 5328 median: 5339 (64%) max: 5544 MIPS
CPU TDP 15 W TDP 20 W TDP 23 W TDP 25 W TDP 28 W TDP 37 W TDP 38 W 92% 94% 96% 98% 95% 100% 97%
min: 4420 avg: 4486 median: 4436 (53%) max: 4603 MIPS
CPU TDP ? TDP 15 W TDP 20 W TDP 23 W TDP 25 W TDP 28 W TDP 37 W TDP 38 W 80% 92% 87% 96% 91% 95% 100% 97%
min: 5222 avg: 5348 median: 5356 (64%) max: 5426 MIPS
CPU TDP ? TDP 15 W TDP 20 W TDP 23 W TDP 25 W TDP 28 W TDP 30 W TDP 37 W TDP 38 W 82% 94% 89% 98% 95% 97% 100% 100% 99%
X264 HD Benchmark 4.0 - x264 Pass 2
88.5 fps (31%)
90.9 fps (32%)
CPU TDP ? TDP 25 W 97% 100%
X264 HD Benchmark 4.0 - x264 Pass 1
196.1 fps (45%)
236.2 fps (54%)
CPU TDP ? TDP 25 W 83% 100%
HWBOT x265 Benchmark v2.2 - HWBOT x265 4k Preset
min: 8.17 avg: 10.3 median: 10.7 (19%) max: 11.6 fps
CPU TDP 15 W TDP 20 W TDP 23 W TDP 25 W TDP 28 W TDP 37 W TDP 38 W 70% 94% 86% 86% 92% 93% 100%
min: 9.48 avg: 10.2 median: 10.4 (18%) max: 10.77 fps
CPU TDP ? TDP 15 W TDP 20 W TDP 23 W TDP 25 W TDP 28 W TDP 37 W TDP 38 W 93% 70% 88% 86% 88% 92% 93% 100%
min: 9.91 avg: 12.4 median: 12.7 (22%) max: 13.7 fps
CPU TDP ? TDP 15 W TDP 20 W TDP 23 W TDP 25 W TDP 28 W TDP 30 W TDP 37 W TDP 38 W 85% 64% 80% 79% 84% 84% 100% 96% 91%
TrueCrypt - TrueCrypt Serpent
1.1 GB/s (0%)
1 GB/s (0%)
CPU TDP ? TDP 25 W 100% 90%
TrueCrypt - TrueCrypt Twofish
1.5 GB/s (26%)
1.4 GB/s (24%)
CPU TDP ? TDP 25 W 100% 93%
TrueCrypt - TrueCrypt AES
10.2 GB/s (27%)
10.1 GB/s (26%)
CPU TDP ? TDP 25 W 100% 99%
Blender - Blender 3.3 Classroom CPU *
min: 583 avg: 694 median: 674 (9%) max: 820 Seconds
CPU TDP 15 W TDP 20 W TDP 23 W TDP 25 W TDP 28 W TDP 37 W TDP 38 W 100% 101% 101% 102% 102% 103% 103%
min: 479 avg: 523 median: 499.5 (6%) max: 648 Seconds
CPU TDP 15 W TDP 20 W TDP 23 W TDP 25 W TDP 28 W TDP 30 W TDP 37 W TDP 38 W 100% 101% 101% 103% 102% 104% 104% 103%
Blender - Blender 2.79 BMW27 CPU *
min: 330 avg: 377.3 median: 362 (3%) max: 469 Seconds
CPU TDP 15 W TDP 20 W TDP 23 W TDP 25 W TDP 28 W TDP 37 W TDP 38 W 100% 101% 101% 101% 101% 101% 101%
min: 322 avg: 345.3 median: 340 (2%) max: 374 Seconds
CPU TDP ? TDP 15 W TDP 20 W TDP 23 W TDP 25 W TDP 28 W TDP 37 W TDP 38 W 101% 100% 101% 101% 101% 101% 101% 101%
min: 277 avg: 306.8 median: 296 (2%) max: 374 Seconds
CPU TDP ? TDP 15 W TDP 20 W TDP 23 W TDP 25 W TDP 28 W TDP 30 W TDP 37 W TDP 38 W 101% 100% 101% 101% 101% 101% 101% 101% 101%
R Benchmark 2.5 - R Benchmark 2.5 *
min: 0.515 avg: 0.5 median: 0.5 (11%) max: 0.567 sec
CPU TDP 15 W TDP 20 W TDP 23 W TDP 25 W TDP 28 W TDP 37 W TDP 38 W 100% 101% 101% 101% 101% 101% 101%
min: 0.576 avg: 0.6 median: 0.6 (13%) max: 0.613 sec
CPU TDP ? TDP 15 W TDP 20 W TDP 23 W TDP 25 W TDP 28 W TDP 37 W TDP 38 W 100% 101% 101% 102% 102% 102% 102% 102%
min: 0.515 avg: 0.5 median: 0.5 (11%) max: 0.543 sec
CPU TDP ? TDP 15 W TDP 20 W TDP 23 W TDP 25 W TDP 28 W TDP 30 W TDP 37 W TDP 38 W 100% 101% 101% 102% 102% 102% 102% 102% 102%
3DMark 06 - CPU - 3DMark 06 - CPU
10227 Points (22%)
Super Pi mod 1.5 XS 1M - Super Pi mod 1.5 XS 1M *
9.7 s (2%)
8 s (2%)
CPU TDP ? TDP 25 W 100% 100%
Super Pi mod 1.5 XS 2M - Super Pi mod 1.5 XS 2M *
22.9 s (1%)
17.5 s (1%)
CPU TDP ? TDP 25 W 100% 100%
Super Pi Mod 1.5 XS 32M - Super Pi mod 1.5 XS 32M *
585 s (3%)
438.1 s (2%)
CPU TDP ? TDP 25 W 100% 101%
3DMark Vantage - 3DM Vant. Perf. CPU no Physx
50726 Points (44%)
3DMark 11 - 3DM11 Performance Physics
min: 10189 avg: 11861 median: 12224 (33%) max: 12926 Points
CPU TDP ? TDP 15 W TDP 20 W TDP 23 W TDP 25 W TDP 28 W TDP 37 W TDP 38 W 99% 82% 97% 79% 88% 100% 97% 93%
min: 11658 avg: 12133 median: 12201 (33%) max: 12541 Points
CPU TDP ? TDP 15 W TDP 20 W TDP 23 W TDP 25 W TDP 28 W TDP 37 W TDP 38 W 97% 82% 93% 79% 92% 100% 97% 93%
min: 12032 avg: 13262 median: 13137.5 (36%) max: 14468 Points
CPU TDP ? TDP 15 W TDP 20 W TDP 23 W TDP 25 W TDP 28 W TDP 30 W TDP 37 W TDP 38 W 93% 79% 90% 76% 91% 96% 98% 100% 89%
3DMark - 3DMark Ice Storm Physics
min: 75967 avg: 78857 median: 78857 (64%) max: 81747 Points
CPU TDP 25 W TDP 37 W 93% 100%
58600 Points (48%)
CPU TDP ? TDP 25 W TDP 37 W 72% 93% 100%
3DMark - 3DMark Ice Storm Extreme Physics
84092 Points (68%)
58705 Points (48%)
CPU TDP ? TDP 37 W 70% 100%
3DMark - 3DMark Ice Storm Unlimited Physics
87410 Points (74%)
67233 Points (57%)
CPU TDP ? TDP 37 W 77% 100%
3DMark - 3DMark Cloud Gate Physics
min: 9155 avg: 11259 median: 11233 (28%) max: 12903 Points
CPU TDP 15 W TDP 20 W TDP 23 W TDP 25 W TDP 37 W 71% 95% 83% 87% 100%
min: 11486 avg: 13163 median: 13102 (33%) max: 14901 Points
CPU TDP ? TDP 15 W TDP 20 W TDP 23 W TDP 25 W TDP 37 W 100% 61% 80% 72% 82% 87%
min: 14599 avg: 15565 median: 15564.5 (39%) max: 16530 Points
CPU TDP ? TDP 15 W TDP 20 W TDP 23 W TDP 25 W TDP 37 W 100% 61% 80% 72% 87% 99%
3DMark - 3DMark Fire Strike Standard Physics
min: 14264 avg: 18380 median: 19207 (34%) max: 20296 Points
CPU TDP ? TDP 15 W TDP 20 W TDP 23 W TDP 25 W TDP 28 W TDP 37 W TDP 38 W 98% 70% 96% 81% 88% 94% 98% 100%
min: 16762 avg: 18139 median: 17885 (32%) max: 19769 Points
CPU TDP ? TDP 15 W TDP 20 W TDP 23 W TDP 25 W TDP 28 W TDP 37 W TDP 38 W 98% 70% 89% 81% 88% 94% 98% 100%
min: 17814 avg: 20902 median: 21100.5 (38%) max: 22553 Points
CPU TDP ? TDP 15 W TDP 20 W TDP 23 W TDP 25 W TDP 28 W TDP 30 W TDP 37 W TDP 38 W 93% 67% 85% 78% 88% 89% 100% 100% 95%
3DMark - 3DMark Time Spy CPU
min: 4384 avg: 5399 median: 5619 (24%) max: 5891 Points
CPU TDP ? TDP 15 W TDP 20 W TDP 23 W TDP 28 W TDP 37 W TDP 38 W 100% 74% 95% 79% 100% 100% 93%
min: 6229 avg: 6498 median: 6514 (27%) max: 6750 Points
CPU TDP ? TDP 15 W TDP 20 W TDP 23 W TDP 25 W TDP 28 W TDP 37 W TDP 38 W 97% 67% 91% 71% 100% 90% 90% 84%
min: 6221 avg: 6983 median: 6921.5 (29%) max: 7756 Points
CPU TDP ? TDP 15 W TDP 20 W TDP 23 W TDP 25 W TDP 28 W TDP 30 W TDP 37 W TDP 38 W 91% 63% 85% 67% 95% 85% 100% 98% 79%
Geekbench 6.2 - Geekbench 6.2 Single-Core
min: 1913 avg: 1941 median: 1941 (52%) max: 1969 Points
CPU TDP 25 W TDP 38 W 97% 100%
min: 1836 avg: 1924 median: 1960 (53%) max: 1976 Points
CPU TDP 25 W TDP 30 W TDP 37 W TDP 38 W 97% 100% 93% 100%
Geekbench 6.2 - Geekbench 6.2 Multi-Core
min: 6099 avg: 6500 median: 6500 (26%) max: 6901 Points
CPU TDP 25 W TDP 38 W 88% 100%
min: 6918 avg: 7230 median: 7013 (28%) max: 7760 Points
CPU TDP 25 W TDP 30 W TDP 37 W TDP 38 W 79% 90% 100% 89%
Geekbench 5.5 - Geekbench 5.1 - 5.4 64 Bit Single-Core
min: 1393 avg: 1464 median: 1479 (62%) max: 1498 Points
CPU TDP 15 W TDP 20 W TDP 23 W TDP 25 W TDP 28 W TDP 37 W TDP 38 W 93% 99% 96% 98% 99% 100% 100%
min: 1150 avg: 1164 median: 1156.5 (49%) max: 1192 Points
CPU TDP ? TDP 15 W TDP 20 W TDP 23 W TDP 25 W TDP 28 W TDP 37 W TDP 38 W 77% 93% 99% 96% 89% 99% 100% 100%
min: 1464 avg: 1480 median: 1479.5 (62%) max: 1500 Points
CPU TDP ? TDP 15 W TDP 20 W TDP 23 W TDP 25 W TDP 28 W TDP 30 W TDP 37 W TDP 38 W 77% 93% 99% 96% 93% 99% 100% 99% 100%
Geekbench 5.5 - Geekbench 5.1 - 5.4 64 Bit Multi-Core
min: 5475 avg: 6121 median: 6390 (11%) max: 6648 Points
CPU TDP 15 W TDP 20 W TDP 23 W TDP 25 W TDP 28 W TDP 37 W TDP 38 W 86% 97% 82% 84% 100% 96% 98%
min: 5798 avg: 6255 median: 6136.5 (11%) max: 6950 Points
CPU TDP ? TDP 15 W TDP 20 W TDP 23 W TDP 25 W TDP 28 W TDP 37 W TDP 38 W 93% 86% 97% 82% 90% 100% 96% 98%
min: 6747 avg: 7546 median: 7573 (14%) max: 8257 Points
CPU TDP ? TDP 15 W TDP 20 W TDP 23 W TDP 25 W TDP 28 W TDP 30 W TDP 37 W TDP 38 W 85% 78% 88% 75% 93% 91% 100% 99% 89%
Geekbench 5.0 - Geekbench 5.0 64 Bit Single-Core
min: 1312 avg: 1377 median: 1376.5 (6%) max: 1441 Points
CPU TDP 20 W TDP 28 W 91% 100%
1162 Points (5%)
CPU TDP ? TDP 20 W TDP 28 W 81% 91% 100%
min: 1408 avg: 1429 median: 1429 (6%) max: 1450 Points
CPU TDP ? TDP 20 W TDP 25 W TDP 28 W TDP 30 W 80% 90% 97% 99% 100%
Geekbench 5.0 - Geekbench 5.0 64 Bit Multi-Core
min: 6233 avg: 6397 median: 6396.5 (20%) max: 6560 Points
CPU TDP 20 W TDP 28 W 95% 100%
7298 Points (23%)
CPU TDP ? TDP 20 W TDP 28 W 100% 85% 90%
min: 7404 avg: 7765 median: 7765 (24%) max: 8126 Points
CPU TDP ? TDP 20 W TDP 25 W TDP 28 W TDP 30 W 90% 77% 91% 81% 100%
Geekbench 4.4 - Geekbench 4.1 - 4.4 64 Bit Single-Core
min: 4919 avg: 4963 median: 4963 (50%) max: 5007 Points
6092 Points (61%)
CPU TDP ? TDP 25 W 81% 100%
Geekbench 4.4 - Geekbench 4.1 - 4.4 64 Bit Multi-Core
min: 27166 avg: 27287 median: 27286.5 (30%) max: 27407 Points
29078 Points (32%)
CPU TDP ? TDP 25 W 94% 100%
Mozilla Kraken 1.1 - Kraken 1.1 Total Score *
min: 614 avg: 650 median: 629 (1%) max: 770 ms
CPU TDP 15 W TDP 20 W TDP 23 W TDP 28 W TDP 37 W TDP 38 W 100% 100% 100% 100% 100% 100%
min: 793 avg: 810 median: 816 (1%) max: 822 ms
CPU TDP ? TDP 15 W TDP 20 W TDP 23 W TDP 25 W TDP 28 W TDP 37 W TDP 38 W 100% 100% 100% 100% 100% 100% 100% 100%
min: 616 avg: 630 median: 630 (1%) max: 649 ms
CPU TDP ? TDP 15 W TDP 20 W TDP 23 W TDP 25 W TDP 28 W TDP 30 W TDP 37 W TDP 38 W 100% 100% 100% 100% 100% 100% 100% 100% 100%
Octane V2 - Octane V2 Total Score
72262 Points (63%)
36619 Points (32%)
CPU TDP ? TDP 38 W 51% 100%
min: 69506 avg: 71631 median: 71624 (63%) max: 73179 Points
CPU TDP ? TDP 25 W TDP 30 W TDP 37 W TDP 38 W 50% 98% 97% 100% 99%
WebXPRT 4 - WebXPRT 4 Score
min: 183.4 avg: 205.6 median: 209 (60%) max: 214 Points
CPU TDP 15 W TDP 20 W TDP 23 W TDP 28 W TDP 37 W TDP 38 W 96% 98% 86% 98% 100% 100%
min: 191.5 avg: 207.4 median: 210.5 (60%) max: 211 Points
CPU TDP 15 W TDP 20 W TDP 23 W TDP 25 W TDP 28 W TDP 30 W TDP 37 W TDP 38 W 96% 98% 86% 94% 98% 99% 100% 100%
WebXPRT 3 - WebXPRT 3 Score
min: 244 avg: 261.5 median: 264 (55%) max: 272 Points
CPU TDP 15 W TDP 20 W TDP 23 W TDP 28 W TDP 37 W TDP 38 W 94% 98% 90% 100% 99% 96%
min: 205 avg: 210.7 median: 208 (43%) max: 219 Points
CPU TDP ? TDP 15 W TDP 20 W TDP 23 W TDP 25 W TDP 28 W TDP 37 W TDP 38 W 75% 94% 87% 90% 81% 100% 99% 96%
min: 251 avg: 262.5 median: 263 (55%) max: 271 Points
CPU TDP ? TDP 15 W TDP 20 W TDP 23 W TDP 25 W TDP 28 W TDP 30 W TDP 37 W TDP 38 W 75% 94% 87% 90% 91% 100% 98% 97% 96%
CrossMark - CrossMark Overall
min: 1029 avg: 1228 median: 1231 (47%) max: 1336 Points
CPU TDP 15 W TDP 20 W TDP 23 W TDP 28 W TDP 37 W TDP 38 W 93% 91% 77% 92% 100% 99%
min: 1296 avg: 1319 median: 1321 (51%) max: 1350 Points
CPU TDP 15 W TDP 20 W TDP 23 W TDP 25 W TDP 28 W TDP 30 W TDP 37 W TDP 38 W 93% 92% 77% 98% 92% 100% 100% 99%
Power Consumption - Prime95 Power Consumption - external Monitor *
min: 27.5 avg: 41.4 median: 41.8 (7%) max: 52.5 Watt
CPU TDP 15 W TDP 20 W TDP 23 W TDP 25 W TDP 28 W TDP 37 W TDP 38 W 105% 103% 102% 103% 102% 100% 100%
min: 37 avg: 42.1 median: 38.6 (7%) max: 50.8 Watt
CPU TDP ? TDP 15 W TDP 20 W TDP 23 W TDP 25 W TDP 28 W TDP 37 W TDP 38 W 100% 105% 103% 102% 103% 102% 100% 100%
min: 31.5 avg: 46.2 median: 46 (8%) max: 58.3 Watt
CPU TDP ? TDP 15 W TDP 20 W TDP 23 W TDP 25 W TDP 28 W TDP 30 W TDP 37 W TDP 38 W 100% 105% 103% 102% 102% 102% 101% 101% 100%
Power Consumption - Cinebench R15 Multi Power Consumption - external Monitor *
min: 32.2 avg: 47.1 median: 48.2 (9%) max: 59.9 Watt
CPU TDP 20 W TDP 28 W TDP 37 W TDP 38 W 106% 104% 101% 100%
min: 33.7 avg: 39.3 median: 34.8 (6%) max: 49.5 Watt
CPU TDP ? TDP 20 W TDP 25 W TDP 28 W TDP 37 W TDP 38 W 102% 106% 105% 104% 101% 100%
min: 31.5 avg: 50.9 median: 46.3 (8%) max: 67 Watt
CPU TDP ? TDP 20 W TDP 25 W TDP 28 W TDP 30 W TDP 37 W TDP 38 W 102% 106% 103% 104% 102% 101% 100%
Power Consumption - Idle Power Consumption - external Monitor *
min: 3.43 avg: 5.5 median: 6 (4%) max: 7.3 Watt
CPU TDP 15 W TDP 20 W TDP 23 W TDP 25 W TDP 28 W TDP 37 W TDP 38 W 101% 101% 100% 100% 102% 103% 102%
min: 3.23 avg: 6.4 median: 6.5 (4%) max: 11.5 Watt
CPU TDP 15 W TDP 20 W TDP 23 W TDP 25 W TDP 28 W TDP 30 W TDP 37 W TDP 38 W 102% 102% 101% 100% 102% 103% 102% 103%
Power Consumption - Idle Power Consumption 150cd 1min *
min: 5.25 avg: 6.5 median: 6.4 (7%) max: 7.64 Watt
CPU TDP 15 W TDP 20 W TDP 23 W TDP 25 W TDP 28 W TDP 38 W 102% 101% 103% 100% 102% 101%
min: 4.99 avg: 7.6 median: 7.5 (8%) max: 11.6 Watt
CPU TDP 15 W TDP 20 W TDP 23 W TDP 25 W TDP 28 W TDP 30 W TDP 37 W TDP 38 W 104% 103% 105% 100% 104% 103% 105% 103%
Power Consumption - Cinebench R15 Multi Power Efficiency - external Monitor
min: 26.7 avg: 32 median: 28.8 (21%) max: 40.5 Points per Watt
CPU TDP 20 W TDP 37 W TDP 38 W 100% 71% 66%
min: 33.1 avg: 37.2 median: 38 (28%) max: 40.5 Points per Watt
CPU TDP ? TDP 20 W TDP 25 W TDP 37 W TDP 38 W 82% 97% 100% 71% 66%
min: 28.9 avg: 33.7 median: 33.7 (25%) max: 38.6 Points per Watt
CPU TDP ? TDP 20 W TDP 25 W TDP 30 W TDP 37 W TDP 38 W 84% 100% 89% 90% 73% 68%
Average Benchmarks AMD Ryzen 5 7530U → 100% n=22 Average Benchmarks AMD Ryzen 7 4800U → 93% n=22 Average Benchmarks AMD Ryzen 7 7730U → 111% n=22
- Range of benchmark values for this graphics card
- Average benchmark values for this graphics card
* Smaller numbers mean a higher performance
1 This benchmark is not used for the average calculation
v1.28
log 01. 23:56:10
#0 checking url part for id 14958 +0s ... 0s
#1 checking url part for id 11681 +0s ... 0s
#2 checking url part for id 14956 +0s ... 0s
#3 redirected to Ajax server, took 1719870970 +0s ... 0s
#4 did not recreate cache, as it is less than 5 days old! Created at Mon, 01 Jul 2024 05:15:43 +0200 +0s ... 0s
#5 composed specs +0.009s ... 0.009s
#6 did output specs +0s ... 0.009s
#7 getting avg benchmarks for device 14958 +0.004s ... 0.013s
#8 got single benchmarks 14958 +0.012s ... 0.024s
#9 getting avg benchmarks for device 11681 +0.003s ... 0.028s
#10 got single benchmarks 11681 +0.007s ... 0.034s
#11 getting avg benchmarks for device 14956 +0.004s ... 0.038s
#12 got single benchmarks 14956 +0.011s ... 0.049s
#13 got avg benchmarks for devices +0s ... 0.049s
#14 min, max, avg, median took s +0.063s ... 0.112s
#15 return log +0s ... 0.112s
Please share our article, every link counts!
Redaktion, 2017-09- 8 (Update: 2023-07- 1)
 Deutsch
 English
 Español
 Français
 Italiano
 Nederlands
 Polski
 Português
 Русский
 Türkçe
 Svenska
 Chinese
 Magyar