AMD Ryzen 5 5600H vs AMD Ryzen 9 PRO 6950H vs AMD Ryzen 9 6900HX
AMD Ryzen 5 5600H ► remove from comparison
The AMD Ryzen 5 5600H is a processor for big (gaming) laptops based on the Cezanne generation. The R5 5600H has six of the eight cores based on the Zen 3 microarchitecture. They are clocked at 3.3 GHz (guaranteed base clock) to 4.2 GHz (Turbo) and support SMT for a total of 12 threads. The chip is manufactured on the modern 7 nm TSMC process.
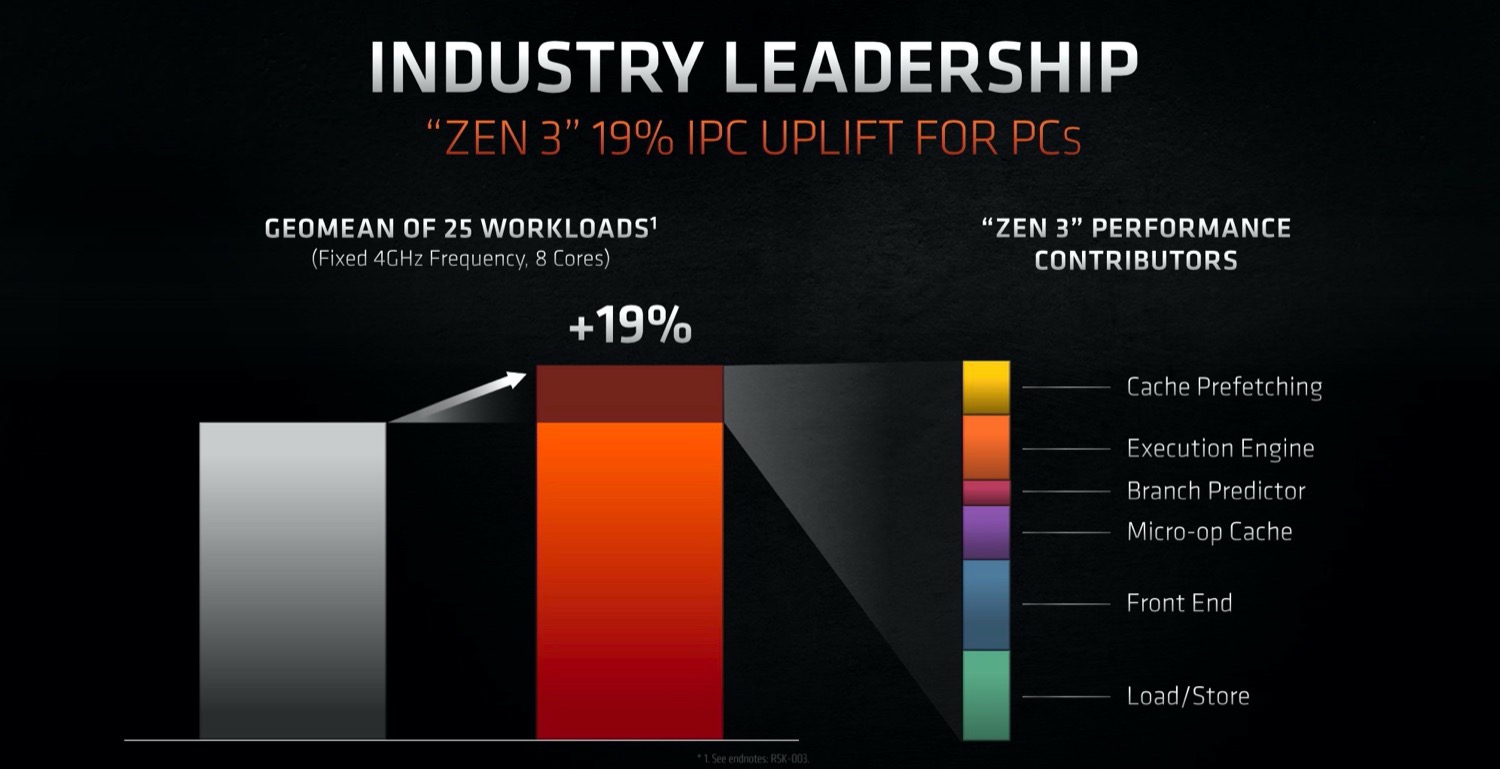
The new Zen 3 microarchitecture offers a significantly higher IPC (instructions per clock) compared to Zen 2. For desktop processors AMD claims 19 percent on average and in applications reviews showed around 12% gains at the same clock speed.
In addition to the six CPU cores, the APU also integrates a Radeon RX Vega 7 integrated graphics processor with 7 CUs running at up to 1800 MHz. The dual channel memory controller supports DDR4-3200 and energy efficient LPDDR4-4266 RAM. Furthermore, 16 MB of L3 cache can be found on the chip.
Performance
The average 5600H in our database is in the same league as the Ryzen 5 6600HS and the Core i7-1260P , as far as multi-thread benchmark scores are concerned.
Thanks to its decent cooling solution and a long-term CPU power limit of 45 W, the Lenovo Legion 5 17 is among the fastest laptops powered by the 5600H that we know of. It can be roughly 30% faster in CPU-bound workloads than the slowest system featuring the same chip in our database, as of August 2023.
Power consumption
This Ryzen 5 series chip has a default TDP (also known as the long-term power limit) of 45 W, a value that laptop makers are allowed to change to anything between 35 W and 54 W with clock speed and performance changing accordingly as a result. A high-performance cooling solution is a must for a CPU like this.
The hexa-core APU is built with the 7 nm TSMC process for decent, as of late 2022, energy efficiency.
AMD Ryzen 9 PRO 6950H ► remove from comparison
The AMD Ryzen 9 PRO 6950H is a processor for big (workstation) laptops based on the Rembrandt generation. The R9 6900HX integrates all eight cores based on the Zen 3+ microarchitecture. They are clocked at 3.3 (guaranteed base clock) to 4.9 GHz (Turbo) and support SMT / Hyperthreading (16 threads). The chip is manufactured on the modern 6 nm TSMC process. The 6950H is the professional version of the consumer R9 6900HX without overclocking features but with additional management features and the Microsoft Pluton Security processor.
The new Zen 3+ architecture is a refresh of the Zen 3 architecture and should not offer a lot of changes. The chip itself however, offers a lot of new features, like support for USB 4 (40 Gbps), PCI-E Gen 4, DDR5-4800MT/s or LPDDR5-6400MT/s, WiFi 6E, Bluetooth LE 5.2, DisplayPort 2, and AV1 decode.
A big novelty is the integrated GPU Radeon 680M , that is now based on the RDNA2 architecture and offers 12 CUs at up to 2.4 GHz. It should be the fastest iGPU of all at the time of announcement.
Performance
While we have not tested a single system built around the 6950H as of August 2023, we have tested one system featuring the 6950HS , its slightly more power-efficient brother. Based on that, expect the 6950H to be slightly faster than the Ryzen 7 5800H , Ryzen 9 4900H , Ryzen 5 PRO 7640HS and also the Core i7-11800H . In other words, this is a higher-end chip that will handle almost any task with ease, as of late 2022.
Your mileage may vary depending on how competent the cooling solution of your laptop is and how high the CPU power limits are.
Power consumption
This Ryzen has a default TDP of 45 W (also known as the PL1). A high-performance cooling solution is a must for a CPU like this one here.
Ryzen 9 PRO 6950H is built with TSMC's 6 nm process leading to great, as of late 2022, energy efficiency.
AMD Ryzen 9 6900HX ► remove from comparison
The AMD Ryzen 9 6900HX is a processor for big (gaming) laptops based on the Rembrandt generation. The R9 6900HX integrates all eight cores based on the Zen 3+ microarchitecture. They are clocked at 3.3 (guaranteed base clock) to 4.9 GHz (Turbo) and support SMT / Hyperthreading (16 threads). The chip is manufactured on the modern 6 nm TSMC process. The "X" in the name indicates the overclocking capabilities of the CPU.
The new Zen 3+ is a refresh of the Zen 3 architecture and should not offer a lot of changes. The chip itself however, offers a lot of new features, like support for USB 4 (40 Gbps), PCI-E Gen 4, DDR5-4800MT/s or LPDDR5-6400MT/s, WiFi 6E, Bluetooth LE 5.2, DisplayPort 2, and AV1 decode.
A big novelty is the integrated GPU Radeon 680M , that is now based on the RDNA2 architecture and offers 12 CUs at up to 2.4 GHz. It should be the fastest iGPU of all at the time of announcement.
Performance
The average 6900HX in our database edges out the Core i7-12800H just slightly while, a little disappointingly, not quite managing to leave the 6900HS behind in the dust. Don't get us wrong; this is still a brilliant CPU for your demanding apps and games, as of late 2022. It does lag behind some of the 12th generation Intel Core i9 options, though.
Thanks to its decent cooling solution and a long-term CPU power limit of nearly 90 W, the XMG Neo 15 2022 is among the fastest laptops built around the 6900HX that we know of. It can be at least 20% faster in CPU-bound workloads than the slowest system featuring the same chip in our database, as of August 2023.
Power consumption
This Ryzen 9 series chip has a default TDP, also known as the long-term power limit, of 45 W with the letter "X" indicating that the user is officially allowed to overclock the thing - leading to an increase in power consumption levels. Either way, a high-performance cooling solution is a must for a CPU like this.
The R9 6900HX is built with TSMC's 6 nm process making for very good, as of early 2023, energy efficiency.
Model AMD Ryzen 5 5600H AMD Ryzen 9 PRO 6950H AMD Ryzen 9 6900HX Series AMD Cezanne (Zen 3, Ryzen 5000) AMD Rembrandt (Zen 3+) AMD Rembrandt (Zen 3+) Codename Cezanne-H (Zen 3) Rembrandt-H (Zen 3+) Rembrandt-H (Zen 3+) Series: Rembrandt (Zen 3+) Rembrandt-H (Zen 3+) Clock 3300 - 4200 MHz 3300 - 4900 MHz 3300 - 4900 MHz L1 Cache 384 KB 512 KB L2 Cache 3 MB 4 MB 4 MB L3 Cache 16 MB 16 MB 16 MB Cores / Threads 6 / 12 8 / 16 8 / 16 TDP 45 Watt 45 Watt 45 Watt Technology 7 nm 6 nm 6 nm Socket FP6 FP7/FP7r2 FP7/FP7r2 Features DDR4-3200/LPDDR4-4266 RAM, PCIe 3, MMX, SSE, SSE2, SSE3, SSSE3, SSE4A, SSE4.1, SSE4.2, AVX, AVX2, BMI2, ABM, FMA, ADX, SMEP, SMAP, SMT, CPB, AES-NI, RDRAND, RDSEED, SHA, SME DDR5-4800/LPDDR5-6400 RAM (incl. ECC), PCIe 4, PRO, MMX, SSE, SSE2, SSE3, SSSE3, SSE4A, SSE4.1, SSE4.2, AVX, AVX2, BMI2, ABM, FMA, ADX, SMEP, SMAP, SMT, CPB, AES-NI, RDRAND, RDSEED, SHA, SME DDR5-4800/LPDDR5-6400 RAM (incl. ECC), PCIe 4, MMX (+), SSE, SSE2, SSE3, SSSE3, SSE4.1, SSE4.2, SSE4A, AES, AVX, AVX2, FMA3, SHA iGPU AMD Radeon RX Vega 7 ( - 1800 MHz)AMD Radeon 680M ( - 2400 MHz)AMD Radeon 680M ( - 2400 MHz)Architecture x86 x86 x86 Announced Manufacturer www.amd.com www.amd.com www.amd.com max. Temp. 95 °C 95 °C
Benchmarks Performance Rating - CB R15 + R20 + 7-Zip + X265 + Blender + 3DM11 CPU - R5 5600H
37 pt (51%)
...
Intel Core i5-11500B
...
max:
Performance Rating - CB R15 + R20 + 7-Zip + X265 + Blender + 3DM11 CPU - R9 6900HX
41.5 pt (58%)
...
...
max:
Cinebench 2024 - Cinebench 2024 CPU Single Core
80 Points (56%)
min: 91 avg: 91.5 median: 91.5 (64%) max: 92 Points
CPU TDP 35 W TDP 40 W 100% 95%
Cinebench 2024 - Cinebench 2024 CPU Multi Core
439 Points (8%)
min: 666 avg: 695 median: 695 (13%) max: 724 Points
CPU TDP 35 W TDP 40 W 100% 87%
Cinebench R23 - Cinebench R23 Multi Core
min: 7945 avg: 9466 median: 9564 (9%) max: 10416 Points
CPU TDP ? TDP 25 W TDP 35 W TDP 40 W TDP 41 W TDP 45 W TDP 54 W TDP 94 W 99% 83% 79% 95% 93% 100% 94% 91%
min: 9709 avg: 13307 median: 13497 (13%) max: 15100 Points
CPU TDP ? TDP 20 W TDP 25 W TDP 30 W TDP 35 W TDP 38 W TDP 40 W TDP 41 W TDP 45 W TDP 54 W TDP 70 W TDP 75 W TDP 80 W TDP 85 W TDP 90 W TDP 94 W TDP 98 W TDP 100 W 75% 67% 57% 78% 70% 81% 76% 64% 82% 74% 96% 97% 97% 100% 100% 62% 99% 97%
Cinebench R23 - Cinebench R23 Single Core
min: 1316 avg: 1363 median: 1367 (58%) max: 1381 Points
CPU TDP ? TDP 25 W TDP 35 W TDP 40 W TDP 41 W TDP 45 W TDP 54 W TDP 94 W 100% 96% 99% 100% 99% 100% 99% 98%
min: 1516 avg: 1565 median: 1558 (66%) max: 1616 Points
CPU TDP ? TDP 20 W TDP 25 W TDP 30 W TDP 35 W TDP 38 W TDP 40 W TDP 41 W TDP 45 W TDP 54 W TDP 70 W TDP 75 W TDP 80 W TDP 85 W TDP 90 W TDP 94 W TDP 98 W TDP 100 W 88% 94% 82% 95% 90% 100% 91% 84% 92% 88% 98% 95% 97% 100% 98% 84% 97% 96%
Cinebench R20 - Cinebench R20 CPU (Single Core)
min: 527 avg: 533 median: 533 (59%) max: 538 Points
CPU TDP ? TDP 25 W TDP 35 W TDP 40 W TDP 41 W TDP 45 W TDP 54 W TDP 94 W 99% 99% 99% 100% 100% 100% 100% 98%
min: 595 avg: 610 median: 610 (68%) max: 631 Points
CPU TDP ? TDP 20 W TDP 25 W TDP 30 W TDP 35 W TDP 38 W TDP 40 W TDP 41 W TDP 45 W TDP 54 W TDP 70 W TDP 75 W TDP 80 W TDP 85 W TDP 90 W TDP 94 W TDP 98 W TDP 100 W 86% 95% 84% 94% 90% 100% 91% 85% 92% 88% 97% 95% 94% 100% 98% 84% 97% 96%
Cinebench R20 - Cinebench R20 CPU (Multi Core)
min: 3074 avg: 3678 median: 3688.5 (9%) max: 4059 Points
CPU TDP ? TDP 25 W TDP 35 W TDP 40 W TDP 41 W TDP 45 W TDP 54 W TDP 94 W 97% 85% 79% 97% 92% 100% 94% 90%
min: 3742 avg: 5162 median: 5306 (13%) max: 5813 Points
CPU TDP ? TDP 20 W TDP 25 W TDP 30 W TDP 35 W TDP 38 W TDP 40 W TDP 41 W TDP 45 W TDP 54 W TDP 70 W TDP 75 W TDP 80 W TDP 85 W TDP 90 W TDP 94 W TDP 98 W TDP 100 W 71% 67% 59% 79% 70% 82% 78% 64% 83% 75% 96% 97% 98% 100% 100% 62% 100% 97%
Cinebench R15 - Cinebench R15 CPU Multi 64 Bit
min: 1319 avg: 1562 median: 1563 (10%) max: 1723 Points
CPU TDP ? TDP 25 W TDP 35 W TDP 40 W TDP 41 W TDP 45 W TDP 54 W TDP 94 W 98% 91% 80% 96% 94% 100% 91% 93%
min: 1588 avg: 2163 median: 2231 (14%) max: 2411 Points
CPU TDP ? TDP 20 W TDP 25 W TDP 30 W TDP 35 W TDP 38 W TDP 40 W TDP 41 W TDP 45 W TDP 54 W TDP 70 W TDP 75 W TDP 80 W TDP 85 W TDP 90 W TDP 94 W TDP 98 W TDP 100 W 74% 67% 63% 79% 70% 83% 77% 65% 82% 69% 92% 96% 96% 99% 100% 65% 99% 95%
Cinebench R15 - Cinebench R15 CPU Single 64 Bit
min: 218 avg: 222.2 median: 223 (67%) max: 225 Points
CPU TDP ? TDP 25 W TDP 35 W TDP 40 W TDP 41 W TDP 45 W TDP 54 W TDP 94 W 99% 97% 98% 100% 99% 99% 99% 97%
min: 241 avg: 250.1 median: 249 (75%) max: 261 Points
CPU TDP ? TDP 20 W TDP 25 W TDP 30 W TDP 35 W TDP 38 W TDP 40 W TDP 41 W TDP 45 W TDP 54 W TDP 70 W TDP 75 W TDP 80 W TDP 85 W TDP 90 W TDP 94 W TDP 98 W TDP 100 W 88% 94% 84% 94% 90% 100% 91% 85% 92% 88% 96% 94% 96% 99% 97% 84% 97% 96%
Cinebench R11.5 - Cinebench R11.5 CPU Multi 64 Bit
min: 17.51 avg: 18.7 median: 18.7 (24%) max: 19.71 Points
CPU TDP ? TDP 40 W TDP 45 W TDP 94 W 92% 95% 100% 89%
min: 19.01 avg: 23.9 median: 23.9 (31%) max: 26.44 Points
CPU TDP ? TDP 20 W TDP 30 W TDP 35 W TDP 40 W TDP 45 W TDP 94 W 76% 81% 94% 99% 91% 100% 74%
Cinebench R11.5 - Cinebench R11.5 CPU Single 64 Bit
min: 2.62 avg: 2.6 median: 2.6 (65%) max: 2.63 Points
CPU TDP ? TDP 40 W TDP 45 W TDP 94 W 100% 100% 100% 100%
min: 2.86 avg: 2.9 median: 2.9 (73%) max: 3.07 Points
CPU TDP ? TDP 20 W TDP 30 W TDP 35 W TDP 40 W TDP 45 W TDP 94 W 89% 98% 97% 100% 94% 97% 89%
Cinebench R10 - Cinebench R10 Rend. Single (32bit)
min: 5719 avg: 5804 median: 5817 (35%) max: 5847 Points
CPU TDP ? TDP 40 W TDP 45 W TDP 94 W 99% 99% 100% 98%
min: 6405 avg: 7252 median: 6545.5 (40%) max: 12330 Points
CPU TDP ? TDP 20 W TDP 30 W TDP 35 W TDP 40 W TDP 45 W TDP 94 W 47% 53% 52% 100% 50% 51% 46%
Cinebench R10 - Cinebench R10 Rend. Multi (32bit)
min: 32456 avg: 34272 median: 34229 (25%) max: 35806 Points
CPU TDP ? TDP 40 W TDP 45 W TDP 94 W 92% 96% 100% 91%
min: 32313 avg: 42271 median: 39524 (29%) max: 67558 Points
CPU TDP ? TDP 20 W TDP 30 W TDP 35 W TDP 40 W TDP 45 W TDP 94 W 49% 48% 55% 100% 54% 58% 48%
Cinebench R10 - Cinebench R10 Rend. Multi (64bit)
min: 57574 avg: 60347 median: 59479 (41%) max: 63144 Points
CPU TDP ? TDP 40 W TDP 45 W TDP 94 W 92% 94% 100% 91%
min: 55915 avg: 69650 median: 70044 (49%) max: 77450 Points
CPU TDP ? TDP 20 W TDP 30 W TDP 35 W TDP 40 W TDP 45 W TDP 94 W 83% 79% 91% 96% 92% 100% 81%
Cinebench R10 - Cinebench R10 Rend. Single (64bit)
min: 11082 avg: 11111 median: 11095 (14%) max: 11201 Points
CPU TDP ? TDP 40 W TDP 45 W TDP 94 W 99% 100% 99% 99%
min: 11870 avg: 12332 median: 12239.5 (15%) max: 12943 Points
CPU TDP ? TDP 20 W TDP 30 W TDP 35 W TDP 40 W TDP 45 W TDP 94 W 91% 100% 98% 100% 97% 99% 91%
wPrime 2.10 - wPrime 2.0 1024m *
min: 129.204 avg: 201.1 median: 201.1 (2%) max: 273 s
CPU TDP ? TDP 40 W 100% 102%
min: 93.19 avg: 114.7 median: 104.8 (1%) max: 149.369 s
CPU TDP ? TDP 20 W TDP 30 W TDP 35 W TDP 40 W TDP 45 W 100% 102% 102% 102% 102% 102%
wPrime 2.10 - wPrime 2.0 32m *
min: 4.552 avg: 6.6 median: 6.6 (1%) max: 8.6 s
CPU TDP ? TDP 40 W 100% 101%
min: 3.461 avg: 4 median: 3.8 (1%) max: 4.688 s
CPU TDP ? TDP 20 W TDP 30 W TDP 35 W TDP 40 W TDP 45 W 100% 101% 101% 101% 101% 101%
wPrime 1.55 - wPrime 1.55 1024m *
273 s (1%)
wPrime 1.55 - wPrime 1.55 32m *
8.6 s (5%)
7497 Points (12%)
min: 6795 avg: 6875 median: 6875 (11%) max: 6980 Points
CPU TDP 20 W TDP 30 W TDP 35 W TDP 40 W TDP 45 W 97% 96% 97% 100% 95%
7-Zip 18.03 - 7-Zip 18.03 Multli Thread 4 runs
min: 36315 avg: 43438 median: 44558 (26%) max: 46562 MIPS
CPU TDP ? TDP 25 W TDP 35 W TDP 40 W TDP 41 W TDP 45 W TDP 54 W TDP 94 W 97% 89% 86% 100% 78% 97% 94% 87%
min: 49526 avg: 60091 median: 61333 (35%) max: 65336 MIPS
CPU TDP ? TDP 20 W TDP 25 W TDP 30 W TDP 35 W TDP 38 W TDP 40 W TDP 41 W TDP 45 W TDP 54 W TDP 70 W TDP 75 W TDP 80 W TDP 85 W TDP 90 W TDP 94 W TDP 98 W TDP 100 W 75% 77% 64% 87% 75% 89% 82% 56% 85% 74% 99% 96% 100% 98% 98% 63% 97% 96%
7-Zip 18.03 - 7-Zip 18.03 Single Thread 4 runs
min: 5213 avg: 5350 median: 5358.5 (64%) max: 5446 MIPS
CPU TDP ? TDP 25 W TDP 35 W TDP 40 W TDP 41 W TDP 45 W TDP 54 W TDP 94 W 99% 97% 100% 99% 98% 99% 100% 96%
min: 5090 avg: 5799 median: 5817 (70%) max: 6070 MIPS
CPU TDP ? TDP 20 W TDP 25 W TDP 30 W TDP 35 W TDP 38 W TDP 40 W TDP 41 W TDP 45 W TDP 54 W TDP 70 W TDP 75 W TDP 80 W TDP 85 W TDP 90 W TDP 94 W TDP 98 W TDP 100 W 90% 96% 87% 95% 92% 99% 92% 87% 94% 88% 96% 96% 94% 100% 96% 86% 94% 97%
X264 HD Benchmark 4.0 - x264 Pass 2
95.2 fps (33%)
min: 93.25 avg: 115.2 median: 114.5 (40%) max: 127.8 fps
CPU TDP 20 W TDP 30 W TDP 35 W TDP 40 W TDP 45 W 76% 89% 93% 88% 100%
X264 HD Benchmark 4.0 - x264 Pass 1
251.2 fps (58%)
min: 240.5 avg: 253.9 median: 255.5 (59%) max: 262.5 fps
CPU TDP 20 W TDP 30 W TDP 35 W TDP 40 W TDP 45 W 92% 95% 95% 97% 100%
HWBOT x265 Benchmark v2.2 - HWBOT x265 4k Preset
min: 9.92 avg: 12 median: 12.2 (21%) max: 13.3 fps
CPU TDP ? TDP 25 W TDP 35 W TDP 40 W TDP 41 W TDP 45 W TDP 54 W TDP 94 W 100% 89% 83% 98% 79% 100% 95% 87%
min: 12.6 avg: 16.7 median: 17 (30%) max: 18.7 fps
CPU TDP ? TDP 20 W TDP 25 W TDP 30 W TDP 35 W TDP 38 W TDP 40 W TDP 41 W TDP 45 W TDP 54 W TDP 70 W TDP 75 W TDP 80 W TDP 85 W TDP 90 W TDP 94 W TDP 98 W TDP 100 W 74% 69% 62% 81% 72% 84% 77% 54% 82% 74% 96% 97% 98% 100% 98% 60% 99% 96%
TrueCrypt - TrueCrypt Serpent
min: 0.806 avg: 0.8 median: 0.8 (0%) max: 0.857 GB/s
CPU TDP ? TDP 40 W 94% 100%
min: 0.857 avg: 1.1 median: 1.1 (0%) max: 1.2 GB/s
CPU TDP ? TDP 20 W TDP 30 W TDP 35 W TDP 40 W TDP 45 W 69% 73% 94% 94% 84% 100%
TrueCrypt - TrueCrypt Twofish
min: 1.1 avg: 1.2 median: 1.2 (21%) max: 1.3 GB/s
CPU TDP ? TDP 40 W 85% 100%
min: 1.3 avg: 1.6 median: 1.7 (29%) max: 1.8 GB/s
CPU TDP ? TDP 20 W TDP 30 W TDP 35 W TDP 40 W TDP 45 W 63% 75% 92% 98% 87% 100%
TrueCrypt - TrueCrypt AES
min: 5.3 avg: 7.4 median: 7.4 (19%) max: 9.4 GB/s
CPU TDP ? TDP 40 W 56% 100%
min: 9.3 avg: 11.8 median: 11.9 (31%) max: 13.5 GB/s
CPU TDP ? TDP 20 W TDP 30 W TDP 35 W TDP 40 W TDP 45 W 41% 72% 81% 91% 82% 100%
Blender - Blender 3.3 Classroom CPU *
min: 556 avg: 598 median: 584 (7%) max: 666 Seconds
CPU TDP 35 W TDP 40 W TDP 41 W TDP 94 W 100% 102% 101% 101%
min: 360 avg: 416.7 median: 407 (5%) max: 558 Seconds
CPU TDP ? TDP 20 W TDP 35 W TDP 38 W TDP 40 W TDP 41 W TDP 45 W TDP 54 W TDP 85 W TDP 90 W TDP 94 W TDP 98 W 103% 100% 100% 102% 101% 100% 102% 103% 103% 103% 100% 103%
Blender - Blender 2.79 BMW27 CPU *
min: 299.7 avg: 325.9 median: 324 (2%) max: 384 Seconds
CPU TDP ? TDP 25 W TDP 35 W TDP 40 W TDP 41 W TDP 45 W TDP 54 W TDP 94 W 100% 100% 100% 100% 100% 101% 100% 100%
min: 212 avg: 238.7 median: 231 (2%) max: 357 Seconds
CPU TDP ? TDP 20 W TDP 25 W TDP 30 W TDP 35 W TDP 38 W TDP 40 W TDP 41 W TDP 45 W TDP 54 W TDP 70 W TDP 75 W TDP 80 W TDP 85 W TDP 90 W TDP 94 W TDP 98 W TDP 100 W 101% 100% 100% 101% 100% 101% 101% 100% 101% 100% 101% 101% 101% 101% 101% 100% 101% 101%
R Benchmark 2.5 - R Benchmark 2.5 *
min: 0.526 avg: 0.5 median: 0.5 (12%) max: 0.596 sec
CPU TDP ? TDP 25 W TDP 35 W TDP 40 W TDP 41 W TDP 45 W TDP 54 W TDP 94 W 102% 100% 102% 102% 101% 101% 102% 101%
min: 0.4627 avg: 0.5 median: 0.5 (10%) max: 0.4974 sec
CPU TDP ? TDP 20 W TDP 25 W TDP 30 W TDP 35 W TDP 38 W TDP 40 W TDP 41 W TDP 45 W TDP 54 W TDP 70 W TDP 75 W TDP 80 W TDP 85 W TDP 90 W TDP 94 W TDP 98 W TDP 100 W 102% 103% 100% 103% 102% 103% 102% 101% 102% 102% 103% 103% 103% 103% 103% 101% 103% 103%
3DMark 06 - CPU - 3DMark 06 - CPU
min: 11446 avg: 12027 median: 11952 (25%) max: 12757 Points
CPU TDP ? TDP 40 W TDP 45 W TDP 94 W 94% 93% 100% 90%
min: 12154 avg: 13269 median: 13274 (28%) max: 14115 Points
CPU TDP ? TDP 20 W TDP 30 W TDP 35 W TDP 40 W TDP 45 W TDP 94 W 89% 91% 95% 98% 94% 100% 85%
Super Pi mod 1.5 XS 1M - Super Pi mod 1.5 XS 1M *
min: 7.2 avg: 7.9 median: 7.9 (2%) max: 8.672 s
CPU TDP ? TDP 40 W 100% 100%
min: 7.328 avg: 7.8 median: 7.7 (2%) max: 8.567 s
CPU TDP ? TDP 20 W TDP 35 W TDP 40 W TDP 45 W 100% 100% 100% 100% 100%
Super Pi mod 1.5 XS 2M - Super Pi mod 1.5 XS 2M *
min: 15.7 avg: 17.2 median: 17.2 (1%) max: 18.772 s
CPU TDP ? TDP 40 W 100% 100%
min: 16.373 avg: 18.8 median: 18.8 (1%) max: 20.719 s
CPU TDP ? TDP 20 W TDP 35 W TDP 40 W TDP 45 W 100% 100% 100% 100% 100%
Super Pi Mod 1.5 XS 32M - Super Pi mod 1.5 XS 32M *
min: 366 avg: 406.6 median: 406.6 (2%) max: 447.224 s
CPU TDP ? TDP 40 W 100% 100%
min: 385.531 avg: 622 median: 656.5 (3%) max: 692.859 s
CPU TDP ? TDP 20 W TDP 35 W TDP 40 W TDP 45 W 101% 100% 100% 101% 101%
3DMark Vantage - 3DM Vant. Perf. CPU no Physx
min: 52691 avg: 54378 median: 55183 (48%) max: 55261 Points
CPU TDP 40 W TDP 45 W TDP 94 W 100% 100% 95%
min: 38061 avg: 64608 median: 67158 (59%) max: 72267 Points
CPU TDP 20 W TDP 30 W TDP 35 W TDP 40 W TDP 45 W TDP 94 W 57% 87% 98% 91% 100% 79%
3DMark 11 - 3DM11 Performance Physics
min: 8662 avg: 13031 median: 13537 (37%) max: 15562 Points
CPU TDP ? TDP 25 W TDP 35 W TDP 40 W TDP 41 W TDP 45 W TDP 54 W TDP 94 W 100% 88% 73% 95% 57% 91% 82% 66%
min: 15855 avg: 18161 median: 17908 (48%) max: 21036 Points
CPU TDP ? TDP 20 W TDP 25 W TDP 30 W TDP 35 W TDP 38 W TDP 40 W TDP 41 W TDP 45 W TDP 54 W TDP 70 W TDP 75 W TDP 80 W TDP 85 W TDP 90 W TDP 94 W TDP 98 W TDP 100 W 81% 76% 64% 81% 69% 82% 78% 41% 80% 67% 86% 89% 85% 91% 95% 48% 90% 100%
3DMark - 3DMark Ice Storm Physics
min: 78452 avg: 81114 median: 80711.5 (66%) max: 84582 Points
CPU TDP ? TDP 40 W TDP 45 W 95% 97% 100%
min: 71056 avg: 77629 median: 77862 (63%) max: 83820 Points
CPU TDP ? TDP 20 W TDP 30 W TDP 35 W TDP 40 W TDP 45 W 98% 88% 93% 91% 97% 100%
3DMark - 3DMark Ice Storm Extreme Physics
min: 80031 avg: 81646 median: 80543 (65%) max: 84364 Points
CPU TDP 40 W TDP 45 W 97% 100%
min: 68580 avg: 77428 median: 77897 (63%) max: 84038 Points
CPU TDP 20 W TDP 30 W TDP 35 W TDP 40 W TDP 45 W 85% 94% 91% 97% 100%
3DMark - 3DMark Ice Storm Unlimited Physics
min: 83587 avg: 84905 median: 85177 (72%) max: 85952 Points
CPU TDP 40 W TDP 45 W 98% 100%
min: 76107 avg: 80997 median: 80616 (68%) max: 84711 Points
CPU TDP 20 W TDP 30 W TDP 35 W TDP 40 W TDP 45 W TDP 80 W 92% 97% 95% 99% 100% 99%
3DMark - 3DMark Cloud Gate Physics
min: 9129 avg: 12370 median: 12951 (33%) max: 13650 Points
CPU TDP ? TDP 25 W TDP 35 W TDP 40 W TDP 41 W TDP 45 W TDP 54 W TDP 94 W 100% 93% 68% 99% 83% 98% 88% 79%
min: 13091 avg: 17827 median: 18435 (47%) max: 19474 Points
CPU TDP ? TDP 20 W TDP 25 W TDP 30 W TDP 35 W TDP 38 W TDP 40 W TDP 41 W TDP 45 W TDP 54 W TDP 75 W TDP 80 W TDP 85 W TDP 90 W TDP 94 W TDP 98 W 76% 67% 65% 85% 68% 89% 80% 58% 84% 71% 97% 100% 98% 99% 55% 100%
3DMark - 3DMark Fire Strike Standard Physics
min: 1131 avg: 18287 median: 20724.5 (37%) max: 21597 Points
CPU TDP ? TDP 25 W TDP 35 W TDP 40 W TDP 41 W TDP 45 W TDP 54 W TDP 94 W 99% 94% 66% 99% 81% 100% 41% 85%
min: 18389 avg: 24551 median: 25524 (46%) max: 27338 Points
CPU TDP ? TDP 20 W TDP 25 W TDP 30 W TDP 35 W TDP 38 W TDP 40 W TDP 41 W TDP 45 W TDP 54 W TDP 70 W TDP 75 W TDP 80 W TDP 85 W TDP 90 W TDP 94 W TDP 98 W TDP 100 W 86% 70% 76% 86% 70% 90% 86% 65% 90% 55% 72% 99% 98% 99% 100% 69% 99% 100%
3DMark - 3DMark Time Spy CPU
min: 3754 avg: 6442 median: 6796 (29%) max: 7512 Points
CPU TDP ? TDP 25 W TDP 35 W TDP 40 W TDP 41 W TDP 45 W TDP 54 W TDP 94 W 100% 89% 70% 93% 52% 99% 79% 88%
min: 6621 avg: 9584 median: 9706 (41%) max: 11039 Points
CPU TDP ? TDP 20 W TDP 25 W TDP 30 W TDP 35 W TDP 38 W TDP 40 W TDP 41 W TDP 45 W TDP 54 W TDP 70 W TDP 75 W TDP 80 W TDP 85 W TDP 90 W TDP 94 W TDP 98 W TDP 100 W 77% 60% 59% 79% 64% 82% 73% 34% 81% 63% 91% 83% 90% 98% 97% 58% 100% 91%
Geekbench 6.2 - Geekbench 6.2 Single-Core
min: 1610 avg: 1729 median: 1728.5 (47%) max: 1847 Points
CPU TDP 40 W TDP 94 W 87% 100%
2148 Points (58%)
CPU TDP 40 W TDP 94 W 100% 98%
Geekbench 6.2 - Geekbench 6.2 Multi-Core
min: 5801 avg: 6856 median: 6855.5 (27%) max: 7910 Points
CPU TDP 40 W TDP 94 W 100% 73%
10340 Points (41%)
CPU TDP 40 W TDP 94 W 100% 64%
Geekbench 5.5 - Geekbench 5.1 - 5.4 64 Bit Single-Core
min: 1365 avg: 1412 median: 1422.5 (60%) max: 1445 Points
CPU TDP ? TDP 25 W TDP 35 W TDP 40 W TDP 41 W TDP 45 W TDP 54 W TDP 94 W 97% 96% 100% 100% 95% 99% 99% 95%
min: 1523 avg: 1589 median: 1589 (67%) max: 1652 Points
CPU TDP ? TDP 20 W TDP 25 W TDP 30 W TDP 35 W TDP 38 W TDP 40 W TDP 41 W TDP 45 W TDP 54 W TDP 70 W TDP 75 W TDP 80 W TDP 85 W TDP 90 W TDP 94 W TDP 98 W TDP 100 W 87% 96% 84% 97% 91% 100% 92% 83% 93% 89% 92% 94% 96% 99% 97% 83% 96% 96%
Geekbench 5.5 - Geekbench 5.1 - 5.4 64 Bit Multi-Core
min: 4990 avg: 6521 median: 6536 (12%) max: 7253 Points
CPU TDP ? TDP 25 W TDP 35 W TDP 40 W TDP 41 W TDP 45 W TDP 54 W TDP 94 W 97% 84% 84% 100% 69% 92% 89% 81%
min: 8313 avg: 9642 median: 9647 (17%) max: 10490 Points
CPU TDP ? TDP 20 W TDP 25 W TDP 30 W TDP 35 W TDP 38 W TDP 40 W TDP 41 W TDP 45 W TDP 54 W TDP 70 W TDP 75 W TDP 80 W TDP 85 W TDP 90 W TDP 94 W TDP 98 W TDP 100 W 74% 81% 59% 88% 75% 91% 81% 49% 84% 72% 98% 94% 99% 97% 100% 57% 98% 97%
Geekbench 5.0 - Geekbench 5.0 64 Bit Single-Core
min: 1341 avg: 1368 median: 1369 (6%) max: 1393 Points
CPU TDP 35 W TDP 40 W TDP 41 W TDP 45 W TDP 94 W 98% 100% 97% 99% 96%
min: 1531 avg: 1561 median: 1557 (7%) max: 1603 Points
CPU TDP 20 W TDP 30 W TDP 35 W TDP 38 W TDP 40 W TDP 41 W TDP 45 W TDP 54 W TDP 80 W TDP 85 W TDP 94 W TDP 98 W 97% 97% 91% 100% 92% 84% 94% 96% 98% 100% 84% 96%
Geekbench 5.0 - Geekbench 5.0 64 Bit Multi-Core
min: 4955 avg: 6222 median: 6483 (20%) max: 7128 Points
CPU TDP 35 W TDP 40 W TDP 41 W TDP 45 W TDP 94 W 85% 100% 70% 92% 82%
min: 9220 avg: 9880 median: 10144 (32%) max: 10426 Points
CPU TDP 20 W TDP 30 W TDP 35 W TDP 38 W TDP 40 W TDP 41 W TDP 45 W TDP 54 W TDP 80 W TDP 85 W TDP 94 W TDP 98 W 98% 98% 74% 88% 83% 48% 84% 89% 100% 94% 56% 97%
Geekbench 4.4 - Geekbench 4.1 - 4.4 64 Bit Single-Core
min: 5812 avg: 5914 median: 5813 (58%) max: 6117 Points
CPU TDP 40 W TDP 45 W 100% 95%
min: 6191 avg: 6642 median: 6698 (67%) max: 6804 Points
CPU TDP 20 W TDP 30 W TDP 35 W TDP 40 W TDP 45 W TDP 80 W 100% 100% 99% 96% 97% 92%
Geekbench 4.4 - Geekbench 4.1 - 4.4 64 Bit Multi-Core
min: 27071 avg: 27953 median: 27790 (30%) max: 28997 Points
CPU TDP 40 W TDP 45 W 100% 95%
min: 36780 avg: 39028 median: 39852 (44%) max: 39852 Points
CPU TDP 20 W TDP 30 W TDP 35 W TDP 40 W TDP 45 W TDP 80 W 100% 100% 92% 86% 90% 100%
Mozilla Kraken 1.1 - Kraken 1.1 Total Score *
min: 640 avg: 654 median: 652 (1%) max: 674 ms
CPU TDP ? TDP 25 W TDP 35 W TDP 40 W TDP 41 W TDP 45 W TDP 54 W TDP 94 W 100% 100% 100% 100% 100% 100% 100% 100%
min: 564 avg: 588 median: 586.5 (1%) max: 607 ms
CPU TDP ? TDP 20 W TDP 25 W TDP 30 W TDP 35 W TDP 38 W TDP 40 W TDP 41 W TDP 45 W TDP 54 W TDP 75 W TDP 80 W TDP 85 W TDP 90 W TDP 94 W TDP 98 W TDP 100 W 100% 100% 100% 100% 100% 100% 100% 100% 100% 100% 100% 100% 100% 100% 100% 100% 100%
Octane V2 - Octane V2 Total Score
min: 64416 avg: 66303 median: 67221 (59%) max: 67271 Points
CPU TDP 45 W TDP 54 W 100% 98%
WebXPRT 4 - WebXPRT 4 Score
min: 196.4 avg: 200.7 median: 200.2 (58%) max: 206 Points
CPU TDP 35 W TDP 40 W TDP 41 W TDP 94 W 98% 100% 95% 96%
min: 200 avg: 222.4 median: 227 (65%) max: 233 Points
CPU TDP ? TDP 20 W TDP 30 W TDP 35 W TDP 38 W TDP 40 W TDP 41 W TDP 45 W TDP 54 W TDP 85 W TDP 90 W TDP 94 W TDP 98 W 93% 97% 97% 91% 100% 93% 84% 94% 86% 99% 98% 85% 97%
WebXPRT 3 - WebXPRT 3 Score
min: 245 avg: 263 median: 267 (56%) max: 273 Points
CPU TDP ? TDP 25 W TDP 35 W TDP 40 W TDP 41 W TDP 45 W TDP 54 W TDP 94 W 97% 97% 99% 100% 94% 97% 100% 90%
min: 248 avg: 280.3 median: 286 (60%) max: 304 Points
CPU TDP ? TDP 20 W TDP 25 W TDP 30 W TDP 35 W TDP 38 W TDP 40 W TDP 41 W TDP 45 W TDP 54 W TDP 75 W TDP 85 W TDP 90 W TDP 94 W TDP 98 W TDP 100 W 87% 94% 86% 94% 88% 100% 92% 84% 89% 88% 91% 96% 94% 81% 94% 93%
CrossMark - CrossMark Overall
min: 1157 avg: 1292 median: 1311 (50%) max: 1353 Points
CPU TDP 25 W TDP 35 W TDP 40 W TDP 41 W TDP 45 W TDP 54 W TDP 94 W 96% 97% 99% 86% 99% 100% 92%
min: 1476 avg: 1621 median: 1610 (62%) max: 1743 Points
CPU TDP ? TDP 20 W TDP 25 W TDP 30 W TDP 35 W TDP 38 W TDP 40 W TDP 41 W TDP 45 W TDP 54 W TDP 80 W TDP 85 W TDP 90 W TDP 94 W TDP 98 W TDP 100 W 92% 87% 74% 90% 80% 97% 84% 66% 91% 82% 98% 99% 93% 72% 92% 100%
Power Consumption - Prime95 Power Consumption - external Monitor *
min: 48.8 avg: 72 median: 69.1 (12%) max: 104.2 Watt
CPU TDP ? TDP 25 W TDP 35 W TDP 40 W TDP 41 W TDP 45 W TDP 54 W 100% 103% 106% 104% 107% 100% 104%
min: 48.7 avg: 96.5 median: 95.8 (17%) max: 135.7 Watt
CPU TDP ? TDP 20 W TDP 25 W TDP 30 W TDP 35 W TDP 38 W TDP 40 W TDP 41 W TDP 45 W TDP 54 W TDP 75 W TDP 80 W TDP 85 W TDP 90 W TDP 98 W 110% 120% 115% 117% 116% 115% 115% 120% 112% 113% 101% 101% 103% 100% 100%
Power Consumption - Cinebench R15 Multi Power Consumption - external Monitor *
min: 48.2 avg: 75.4 median: 71.7 (13%) max: 106.2 Watt
CPU TDP ? TDP 25 W TDP 35 W TDP 40 W TDP 41 W TDP 45 W TDP 54 W 100% 104% 109% 105% 104% 101% 106%
min: 44.6 avg: 92.1 median: 90.6 (17%) max: 134 Watt
CPU TDP ? TDP 20 W TDP 25 W TDP 30 W TDP 35 W TDP 38 W TDP 40 W TDP 41 W TDP 45 W TDP 54 W TDP 75 W TDP 80 W TDP 85 W TDP 90 W TDP 98 W 109% 121% 115% 118% 117% 116% 115% 116% 111% 114% 109% 102% 103% 100% 100%
Power Consumption - Idle Power Consumption - external Monitor *
min: 5.05 avg: 6.2 median: 6.2 (4%) max: 7.26 Watt
CPU TDP 40 W TDP 41 W 100% 102%
min: 8.35 avg: 11.9 median: 10.9 (7%) max: 19.4 Watt
CPU TDP ? TDP 20 W TDP 30 W TDP 35 W TDP 38 W TDP 40 W TDP 41 W TDP 45 W TDP 85 W 100% 104% 103% 105% 106% 106% 109% 102% 106%
Power Consumption - Idle Power Consumption 150cd 1min *
min: 5.72 avg: 10.7 median: 11.8 (13%) max: 17.4 Watt
CPU TDP ? TDP 25 W TDP 41 W TDP 45 W 104% 111% 112% 100%
min: 10.1 avg: 13.5 median: 13.5 (15%) max: 17 Watt
CPU TDP ? TDP 25 W TDP 41 W TDP 45 W TDP 85 W TDP 90 W 104% 114% 115% 105% 109% 100%
Power Consumption - Cinebench R15 Multi Power Efficiency - external Monitor
min: 15.8 avg: 21.3 median: 20.9 (16%) max: 27.4 Points per Watt
CPU TDP ? TDP 25 W TDP 35 W TDP 41 W TDP 45 W TDP 54 W 68% 76% 100% 82% 71% 90%
min: 17.8 avg: 23.6 median: 22 (16%) max: 34.6 Points per Watt
CPU TDP ? TDP 20 W TDP 25 W TDP 30 W TDP 35 W TDP 38 W TDP 40 W TDP 41 W TDP 45 W TDP 54 W TDP 75 W TDP 80 W TDP 85 W TDP 90 W TDP 98 W 55% 100% 60% 90% 76% 84% 79% 65% 58% 69% 67% 53% 55% 51% 51%
Average Benchmarks AMD Ryzen 5 5600H → 0% n= Average Benchmarks AMD Ryzen 9 6900HX → 0% n=
- Range of benchmark values for this graphics card
- Average benchmark values for this graphics card
* Smaller numbers mean a higher performance
1 This benchmark is not used for the average calculation
v1.28
log 02. 09:07:17
#0 checking url part for id 13003 +0s ... 0s
#1 checking url part for id 14370 +0s ... 0s
#2 checking url part for id 14084 +0s ... 0s
#3 redirected to Ajax server, took 1719904037 +0s ... 0s
#4 did not recreate cache, as it is less than 5 days old! Created at Mon, 01 Jul 2024 05:15:43 +0200 +0s ... 0s
#5 composed specs +0.008s ... 0.008s
#6 did output specs +0s ... 0.008s
#7 getting avg benchmarks for device 13003 +0.004s ... 0.013s
#8 got single benchmarks 13003 +0.026s ... 0.039s
#9 getting avg benchmarks for device 14370 +0.001s ... 0.04s
#10 got single benchmarks 14370 +0.003s ... 0.042s
#11 getting avg benchmarks for device 14084 +0.004s ... 0.047s
#12 got single benchmarks 14084 +0.033s ... 0.08s
#13 got avg benchmarks for devices +0s ... 0.08s
#14 min, max, avg, median took s +0.078s ... 0.158s
#15 return log +0s ... 0.158s
Please share our article, every link counts!
Redaktion, 2017-09- 8 (Update: 2023-07- 1)
 Deutsch
 English
 Español
 Français
 Italiano
 Nederlands
 Polski
 Português
 Русский
 Türkçe
 Svenska
 Chinese
 Magyar