NVIDIA Quadro P4000 vs Intel Iris Pro Graphics 580 vs Intel Iris Graphics 540
NVIDIA Quadro P4000 ► remove from comparison
The Nvidia Quadro P4000 is a mobile high-end workstation graphics card for notebooks. There is currently no consumer counterpart and the GPU is sitting between the Quadro P3000 (GTX 1060) and Quadro P5000 (GTX 1070). It is equipped with 1792 shaders and should therefore use the same GP104 chip from the P5000 (2048 shaders). It has 8 GB GDDR-VRAM at the same bandwidth and has the similar 100-Watt TGP according to Nvidia.
The Quadro GPUs offer certified drivers , which are optimized for stability and performance in professional applications (CAD, DCC, medical, prospection, and visualizing applications). The performance in these areas is therefore much better compared to corresponding consumer GPUs.
Intel Iris Pro Graphics 580 ► remove from comparison
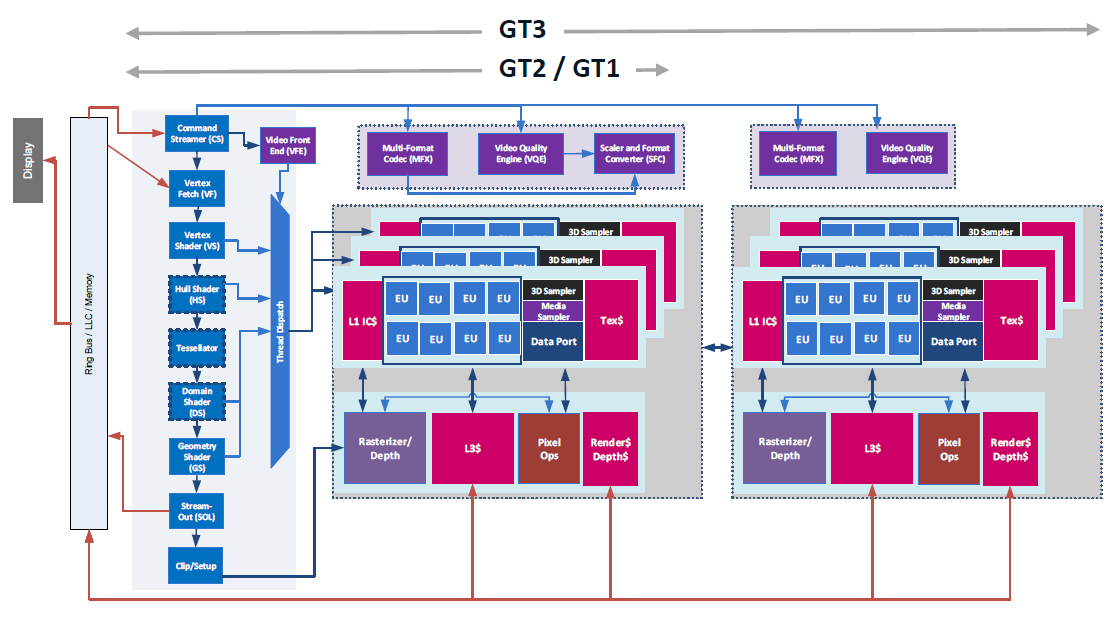
The Intel Iris Pro Graphics 580 (GT4e) is an integrated graphics unit of the Skylake generation (top version). As successors of the Iris Graphics 6200 (Broadwell), the Iris 580 can be found in some high-end quad core CPUs and offers 128 MB of dedicated eDRAM memory. Furthermore, the so-called GT4e-version features 72 Execution Units (EUs). Besides the eDRAM cache, the Iris 580 is able to access the main memory (2x 64bit DDR3L-1600 / DDR4-2133).
Compared to the Iris Graphics 550 (28 W GT3e), the Iris Pro Graphics 580 offers more EUs (72 vs. 48) and a larger eDRAM Cache (128 vs. 64 MB).
Performance
The exact performance of the Iris Graphics 580 depends on memory configuration and CPU model (different clock speeds). However, it should be clearly faster than the old Broadwell Iris Pro 6200 and may compete with a dedicated GeForce 945M . Modern games of 2015/2016 should be playable in medium settings.
Features
The revised video engine now decodes H.265/HEVC completely in hardware and thereby much more efficiently than before. Displays can be connected via DP 1.2 / eDP 1.3 (max. 3840 x 2160 @ 60 Hz), whereas HDMI is limited to the older version 1.4 (max. 3840 x 2160 @ 30 Hz). However, HDMI 2.0 can be added using a DisplayPort converter. Up to three displays can be controlled simultaneously.
Power Consumption
The Iris Graphics 580 can be found in some mobile high-end quad core processors (45 W). Therefore, they are most likely not used in thin and light laptops.
Intel Iris Graphics 540 ► remove from comparison
The Intel Iris Graphics 540 (GT3e) is an integrated graphics unit of the Skylake generation. As successors of the HD Graphics 6000 (Broadwell), the Iris Graphics 540 can be found in CPUs of 15-watt series and offers 64 MB of dedicated eDRAM memory. Furthermore, the so-called GT3e-version features 48 Execution Units (EUs) clocked at up to 1050 MHz (depending on the CPU model). Besides the eDRAM cache, the Iris 540 is able to access the main memory (2x 64bit DDR3L-1600 / DDR4-2133).
Compared to the Iris Graphics 550 of the 28-watt series, the Iris Graphics 540 differs only by its slightly lower maximum clock and a nearly halved TDP, which limits the utilization of the Turbo Boost in certain situations.
Performance
The exact performance of the Iris Graphics 540 depends on various factors like memory configuration (DDR3/DDR4) and maximum clock rate of the specific model. The fastest versions (Core i7-6650U ) should be slightly ahead of a dedicated GeForce 920M and will handle modern games (as of 2015) in low or medium settings.
Features
The revised video engine now decodes H.265/HEVC completely in hardware and thereby much more efficiently than before. Displays can be connected via DP 1.2 / eDP 1.3 (max. 3840 x 2160 @ 60 Hz), whereas HDMI is limited to the older version 1.4a (max. 3840 x 2160 @ 30 Hz). However, HDMI 2.0 can be added using a DisplayPort converter. Up to three displays can be controlled simultaneously.
Power Consumption
The Iris Graphics 540 can be found in mobile processors specified at 15 W TDP and is therefore suited for compact laptops and ultrabooks.
NVIDIA Quadro P4000 Intel Iris Pro Graphics 580 Intel Iris Graphics 540 Gen. 9 Series Codename N17E-Q3 Skylake GT4e Skylake GT3e Architecture Pascal Gen. 9 Skylake Gen. 9 Skylake Pipelines 1792 - unified 72 - unified 48 - unified Core Speed 1202 - 1228 (Boost) MHz 350 - 1050 (Boost) MHz 300 - 1050 (Boost) MHz Memory Speed 6006 MHz Memory Bus Width 256 Bit eDRAM + 64/128 Bit eDRAM + 64/128 Bit Memory Type GDDR5 eDRAM eDRAM Max. Amount of Memory 16 GB 128 MB 64 MB Shared Memory no yes yes API DirectX 12_1, Shader 5.0, OpenGL 4.5 DirectX 12_1, OpenGL 4.4 DirectX 12_1, OpenGL 4.4 Power Consumption 73.4 Watt technology 16 nm 14 nm 14 nm Features Optimus, PhysX, 3D Vision Pro, nView, Optimus QuickSync QuickSync Notebook Size large Date of Announcement 11.01.2017 24.01.2016 01.09.2015 Link to Manufacturer Page www.nvidia.com
Benchmarks Performance Rating - 3DMark 11 + Fire Strike + Time Spy - Quadro P4000
5.6 pt (17%)
...
...
max:
Performance Rating - 3DMark 11 + Fire Strike + Time Spy - Iris Pro Graphics 580
0.9 pt (3%)
...
Intel Iris Pro Graphics 580
...
max:
Performance Rating - 3DMark 11 + Fire Strike + Time Spy - Iris Graphics 540
0.7 pt (2%)
...
...
max:
3DMark - 3DMark Time Spy Score
3825 Points (11%)
3DMark - 3DMark Time Spy Graphics
3960 Points (10%)
3DMark - 3DMark Ice Storm Unlimited Graphics
369407 Points (42%)
184880 Points (21%)
min: 116490 avg: 126223 median: 126078 (14%) max: 136248 Points
3DMark - 3DMark Ice Storm Extreme Graphics
98218 Points (13%)
min: 45185 avg: 56792 median: 56791.5 (7%) max: 68398 Points
3DMark - 3DMark Cloud Gate Score
18726 Points (20%)
11346 Points (12%)
min: 6730 avg: 7255 median: 7235 (8%) max: 7822 Points
3DMark - 3DMark Cloud Gate Graphics
53834 Points (14%)
14594 Points (4%)
min: 9392 avg: 10896 median: 11327 (3%) max: 11893 Points
3DMark - 3DMark Fire Strike Standard Score
10158 Points (18%)
1836 Points (3%)
min: 1106 avg: 1268 median: 1354 (2%) max: 1395 Points
3DMark - 3DMark Fire Strike Standard Graphics
12259 Points (14%)
1903 Points (2%)
min: 1193 avg: 1358 median: 1448 (2%) max: 1479 Points
3DMark - 3DMark Ice Storm Graphics
81998 Points (10%)
149585 Points (18%)
min: 67714 avg: 81160 median: 82680.5 (10%) max: 91565 Points
3DMark 11 - 3DM11 Performance Score
12346 Points (17%)
3510 Points (5%)
min: 2039 avg: 2340 median: 2364 (3%) max: 2624 Points
3DMark 11 - 3DM11 Performance GPU
15433 Points (13%)
3220 Points (3%)
min: 1898 avg: 2187 median: 2211.5 (2%) max: 2450 Points
3DMark Vantage + NVIDIA Quadro P4000 3DMark Vantage - 3DM Vant. Perf. total
36260 Points (11%)
3DM Vant. Perf. total + Intel Iris Graphics 540
min: 8647 avg: 8828 median: 8828 (3%) max: 9009 Points
3DM Vant. Perf. GPU no PhysX + NVIDIA Quadro P4000 3DMark Vantage - 3DM Vant. Perf. GPU no PhysX
42370 Points (24%)
3DM Vant. Perf. GPU no PhysX + Intel Iris Graphics 540
min: 8052 avg: 8220 median: 8219.5 (5%) max: 8387 Points
3DMark 06 3DMark 06 - Standard 1280x1024 + NVIDIA Quadro P4000
29155 Points (38%)
3DMark 06 - Standard 1280x1024 + Intel Iris Graphics 540
min: 13403 avg: 13569 median: 13568.5 (18%) max: 13734 Points
Unigine Valley 1.0 - Unigine Valley 1.0 DX
6.5 fps (2%)
SPECviewperf 11 + NVIDIA Quadro P4000 SPECviewperf 11 - specvp11 snx-01
53 fps (32%)
specvp11 tcvis-02 + NVIDIA Quadro P4000 SPECviewperf 11 - specvp11 tcvis-02
49.9 fps (28%)
specvp11 sw-02 + NVIDIA Quadro P4000 SPECviewperf 11 - specvp11 sw-02
50.9 fps (39%)
specvp11 proe-05 + NVIDIA Quadro P4000 SPECviewperf 11 - specvp11 proe-05
19.7 fps (23%)
specvp11 maya-03 + NVIDIA Quadro P4000 SPECviewperf 11 - specvp11 maya-03
57.8 fps (44%)
specvp11 lightwave-01 + NVIDIA Quadro P4000 SPECviewperf 11 - specvp11 lightwave-01
52.2 fps (56%)
specvp11 ensight-04 + NVIDIA Quadro P4000 SPECviewperf 11 - specvp11 ensight-04
59.2 fps (28%)
specvp11 catia-03 + NVIDIA Quadro P4000 SPECviewperf 11 - specvp11 catia-03
48.4 fps (25%)
SPECviewperf 12 + NVIDIA Quadro P4000 SPECviewperf 12 - specvp12 sw-03
117.1 fps (29%)
specvp12 sw-03 + Intel Iris Graphics 540
min: 26.2 avg: 26.3 median: 26.3 (7%) max: 26.3 fps
specvp12 snx-02 + NVIDIA Quadro P4000 SPECviewperf 12 - specvp12 snx-02
83.1 fps (12%)
specvp12 snx-02 + Intel Iris Graphics 540 min: 2.6 avg: 2.8 median: 2.8 (0%) max: 2.9 fps
specvp12 showcase-01 + NVIDIA Quadro P4000 SPECviewperf 12 - specvp12 showcase-01
67.2 fps (15%)
specvp12 showcase-01 + Intel Iris Graphics 540
min: 8.2 avg: 8.5 median: 8.5 (2%) max: 8.8 fps
specvp12 mediacal-01 + NVIDIA Quadro P4000 SPECviewperf 12 - specvp12 mediacal-01
39.4 fps (10%)
specvp12 mediacal-01 + Intel Iris Graphics 540
min: 2.7 avg: 3.9 median: 3.9 (1%) max: 5.1 fps
specvp12 maya-04 + NVIDIA Quadro P4000 SPECviewperf 12 - specvp12 maya-04
77.9 fps (21%)
specvp12 maya-04 + Intel Iris Graphics 540
min: 16.5 avg: 16.8 median: 16.8 (5%) max: 17 fps
specvp12 energy-01 + NVIDIA Quadro P4000 SPECviewperf 12 - specvp12 energy-01
10.3 fps (9%)
specvp12 energy-01 + Intel Iris Graphics 540 min: 0.08 avg: 0.2 median: 0.2 (0%) max: 0.33 fps
specvp12 creo-01 + NVIDIA Quadro P4000 SPECviewperf 12 - specvp12 creo-01
97.1 fps (39%)
specvp12 creo-01 + Intel Iris Graphics 540
10.8 fps (4%)
specvp12 catia-04 + NVIDIA Quadro P4000 SPECviewperf 12 - specvp12 catia-04
115.2 fps (19%)
specvp12 catia-04 + Intel Iris Graphics 540
min: 15.2 avg: 15.4 median: 15.4 (3%) max: 15.5 fps
specvp12 3dsmax-05 + NVIDIA Quadro P4000 SPECviewperf 12 - specvp12 3dsmax-05
93.6 fps (16%)
specvp12 3dsmax-05 + Intel Iris Graphics 540
14.6 fps (3%)
Cinebench R10 Cinebench R10 Shading (32bit) + NVIDIA Quadro P4000 Cinebench R10 - Cinebench R10 Shading (32bit)
6831 Points (5%)
Cinebench R10 Shading (32bit) + Intel Iris Pro Graphics 580
11355 Points (8%)
Cinebench R10 Shading (32bit) + Intel Iris Graphics 540
min: 7271 avg: 8395 median: 8277.5 (6%) max: 9755 Points
Cinebench R11.5 Cinebench R11.5 OpenGL 64 Bit + NVIDIA Quadro P4000 Cinebench R11.5 - Cinebench R11.5 OpenGL 64 Bit
105.6 fps (37%)
Cinebench R11.5 OpenGL 64 Bit + Intel Iris Pro Graphics 580
63 fps (22%)
Cinebench R11.5 OpenGL 64 Bit + Intel Iris Graphics 540
min: 41.07 avg: 46.9 median: 47.9 (17%) max: 50.6 fps
Cinebench R15 + NVIDIA Quadro P4000 Cinebench R15 - Cinebench R15 OpenGL 64 Bit
107.2 fps (6%)
Cinebench R15 OpenGL 64 Bit + Intel Iris Pro Graphics 580
min: 85.1 avg: 85.6 median: 85.6 (5%) max: 86 fps
Cinebench R15 OpenGL 64 Bit + Intel Iris Graphics 540
min: 35.34 avg: 52.5 median: 55.3 (3%) max: 62.1 fps
Cinebench R15 OpenGL Ref. Match 64 Bit + NVIDIA Quadro P4000 Cinebench R15 - Cinebench R15 OpenGL Ref. Match 64 Bit
99.6 % (100%)
Cinebench R15 OpenGL Ref. Match 64 Bit + Intel Iris Pro Graphics 580
min: 97.8 avg: 97.9 median: 97.8 (98%) max: 98 %
Cinebench R15 OpenGL Ref. Match 64 Bit + Intel Iris Graphics 540
min: 97.8 avg: 98.1 median: 97.8 (98%) max: 99.3 %
GFXBench - GFXBench Car Chase Offscreen
209.8 fps (24%)
42 fps (5%)
GFXBench 3.1 - GFXBench Manhattan ES 3.1 Offscreen
318 fps (7%)
60.4 fps (1%)
GFXBench 3.0 - GFXBench 3.0 Manhattan Offscreen
408.4 fps (24%)
86 fps (5%)
GFXBench (DX / GLBenchmark) 2.7 + NVIDIA Quadro P4000 GFXBench (DX / GLBenchmark) 2.7 - GFXBench T-Rex HD Offscreen C24Z16
1114 fps (9%)
GFXBench T-Rex HD Offscreen C24Z16 + Intel Iris Graphics 540
183 fps (1%)
LuxMark v2.0 64Bit - LuxMark v2.0 Room GPU
1847 Samples/s (8%)
362 Samples/s (2%)
min: 258 avg: 291.8 median: 301.5 (1%) max: 306 Samples/s
LuxMark v2.0 64Bit - LuxMark v2.0 Sala GPU
3564 Samples/s (6%)
875 Samples/s (2%)
min: 614 avg: 700 median: 712.5 (1%) max: 762 Samples/s
ComputeMark v2.1 - ComputeMark v2.1 Result
8609 Points (9%)
2308 Points (2%)
min: 1257 avg: 1483 median: 1525.5 (2%) max: 1625 Points
Power Consumption - Furmark Stress Test Power Consumption - external Monitor *
80.8 Watt (11%)
Power Consumption - The Witcher 3 Power Consumption - external Monitor *
99.5 Watt (14%)
Power Consumption - Witcher 3 ultra Power Efficiency - external Monitor
0.4 fps per Watt (34%)
Average Benchmarks NVIDIA Quadro P4000 → 100% n=15 Average Benchmarks Intel Iris Pro Graphics 580 → 59% n=15 Average Benchmarks Intel Iris Graphics 540 → 42% n=15
- Range of benchmark values for this graphics card
- Average benchmark values for this graphics card
* Smaller numbers mean a higher performance
1 This benchmark is not used for the average calculation
Game Benchmarks The following benchmarks stem from our benchmarks of review laptops. The performance depends on the used graphics memory, clock rate, processor, system settings, drivers, and operating systems. So the results don't have to be representative for all laptops with this GPU. For detailed information on the benchmark results, click on the fps number.
Iris Graphics 540:
114 fps
Iris Graphics 540:
174 fps
Iris Graphics 540:
24.4 fps
Iris Graphics 540:
9.5 fps
Iris Graphics 540:
23.6 fps
Iris Graphics 540:
16.9 fps
Iris Graphics 540:
13.6 fps
100%
Quadro P4000:
70.3 fps
100%
Quadro P4000:
61.6 fps
100%
Quadro P4000:
58.8 fps
Iris Graphics 540:
17.3 fps
Iris Graphics 540:
27.3 fps
Iris Graphics 540:
55.3 fps
Iris Graphics 540:
38.6 fps
Iris Graphics 540:
14.3 fps
Iris Graphics 540:
112 fps
Iris Graphics 540:
30.6 fps
Iris Graphics 540:
19.1 fps
Iris Graphics 540:
43.4 fps
Iris Graphics 540:
25.3 fps
Iris Graphics 540:
12.6 fps
100%
Quadro P4000:
66.7 fps
100%
Quadro P4000:
55.2 fps
100%
Quadro P4000:
45.1 fps
100%
Quadro P4000:
43.7 fps
Iris Graphics 540:
11.3 fps
Iris Graphics 540:
61 (!) [X] Apple MacBook Pro 13 2016 Intel Core i5-6360U 2GHz
Iris Graphics 540
min:
51 fps, max:
75 fps
fps
Iris Graphics 540:
72 (!) [X] Apple MacBook Pro 13 2016 Intel Core i5-6360U 2GHz
Iris Graphics 540
min:
61 fps, max:
80 fps
fps
Iris Graphics 540:
0 (!) fps
Iris Graphics 540:
20.5 fps
Iris Pro Graphics 580:
60.5 fps
Iris Graphics 540:
58.2 68 ~ 63 fps
Iris Pro Graphics 580:
53.3 fps
Iris Graphics 540:
40 47.6 ~ 44 fps
Iris Pro Graphics 580:
42.9 fps
Iris Pro Graphics 580:
23.1 fps
100%
Quadro P4000:
119.5 fps
0%
Iris Pro Graphics 580:
0 (!) fps
26%
Iris Graphics 540:
31.5 fps
100%
Quadro P4000:
112.4 fps
100%
Quadro P4000:
87.1 fps
Iris Graphics 540:
13.3 fps
Iris Graphics 540:
17.3 fps
Iris Graphics 540:
13.8 fps
Iris Graphics 540:
7.6 fps
Iris Graphics 540:
21.7 27.9 (!) [X] Intel NUC6i5SYH Intel Core i5-6260U 1.8GHz
Iris Graphics 540
min:
20 fps, max:
35 fps
~ 25 fps
Iris Graphics 540:
12.9 fps
Iris Graphics 540:
22 22 23 ~ 22 fps
Iris Graphics 540:
10 11 12 ~ 11 fps
Iris Graphics 540:
18 27.6 ~ 23 fps
Iris Graphics 540:
6.7 8.9 ~ 8 fps
100%
Quadro P4000:
115.9 fps
26%
Iris Pro Graphics 580:
30.2 fps
100%
Quadro P4000:
103.2 fps
18%
Iris Pro Graphics 580:
18.2 fps
100%
Quadro P4000:
76.8 fps
16%
Iris Pro Graphics 580:
12.2 fps
0%
Iris Graphics 540:
0 (!) fps
100%
Quadro P4000:
65.5 fps
14%
Iris Pro Graphics 580:
8.9 fps
Iris Graphics 540:
11 13.6 ~ 12 fps
Iris Graphics 540:
35.9 fps
Iris Graphics 540:
28.6 fps
Iris Graphics 540:
15.5 fps
Iris Graphics 540:
14.2 fps
100%
Quadro P4000:
122.5 fps
33%
Iris Graphics 540:
40.2 fps
100%
Quadro P4000:
116.4 fps
20%
Iris Graphics 540:
22.9 fps
100%
Quadro P4000:
89.2 fps
0%
Iris Graphics 540:
0 (!) fps
100%
Quadro P4000:
85.7 fps
Iris Graphics 540:
4.9 5.2 ~ 5 fps
Iris Pro Graphics 580:
0 (!) fps
Iris Graphics 540:
23.2 fps
Iris Graphics 540:
65 (!) [X] Intel NUC6i5SYH Intel Core i5-6260U 1.8GHz
Iris Graphics 540
min:
56 fps, max:
72 fps
fps
Iris Graphics 540:
38.8 (!) [X] Intel NUC6i5SYH Intel Core i5-6260U 1.8GHz
Iris Graphics 540
min:
33 fps, max:
43 fps
fps
Iris Graphics 540:
78.7 120 ~ 99 fps
Iris Pro Graphics 580:
59.9 fps
Iris Graphics 540:
48.6 58 ~ 53 fps
Iris Pro Graphics 580:
58.6 fps
Iris Pro Graphics 580:
23 fps
Iris Pro Graphics 580:
14.9 fps
Iris Pro Graphics 580:
59.8 fps
Iris Pro Graphics 580:
37.2 fps
Iris Pro Graphics 580:
15.3 fps
Iris Pro Graphics 580:
14 fps
Iris Pro Graphics 580:
0 (!) fps
100%
Quadro P4000:
159.7 fps
100%
Quadro P4000:
113.6 fps
100%
Quadro P4000:
77.2 fps
0%
Iris Graphics 540:
0 (!) fps
100%
Quadro P4000:
41.1 fps
Iris Graphics 540:
119.2 149 177 (!) [X] Intel NUC6i5SYH Intel Core i5-6260U 1.8GHz
Iris Graphics 540
min:
156 fps, max:
206 fps
~ 148 fps
Iris Graphics 540:
19.5 fps
Iris Graphics 540:
10.4 fps
Iris Graphics 540:
52.3 fps
Iris Graphics 540:
35.2 fps
Iris Graphics 540:
11.6 fps
Iris Graphics 540:
32.2 fps
100%
Quadro P4000:
153.8 fps
100%
Quadro P4000:
106.3 fps
100%
Quadro P4000:
96.9 fps
100%
Quadro P4000:
84.5 fps
Iris Pro Graphics 580:
43.8 fps
Iris Graphics 540:
23.3 fps
Iris Pro Graphics 580:
30.1 fps
Iris Graphics 540:
15.7 fps
Iris Pro Graphics 580:
25 fps
Iris Graphics 540:
13.7 fps
Iris Pro Graphics 580:
12.4 fps
Iris Graphics 540:
29.8 (!) 65 (!) [X] Intel NUC6i5SYH Intel Core i5-6260U 1.8GHz
Iris Graphics 540
min:
59 fps, max:
87 fps
~ 47 fps
Iris Graphics 540:
18.4 (!) 45.1 (!) [X] Intel NUC6i5SYH Intel Core i5-6260U 1.8GHz
Iris Graphics 540
min:
39 fps, max:
56 fps
~ 32 fps
Iris Graphics 540:
11.4 31.3 (!) [X] Intel NUC6i5SYH Intel Core i5-6260U 1.8GHz
Iris Graphics 540
min:
29 fps, max:
41 fps
~ 21 fps
Iris Graphics 540:
10.4 fps
100%
Quadro P4000:
236.7 fps
100%
Quadro P4000:
184.1 fps
100%
Quadro P4000:
151.4 fps
100%
Quadro P4000:
63.3 fps
100%
Quadro P4000:
67.6 fps
100%
Quadro P4000:
61.1 fps
100%
Quadro P4000:
59.7 fps
100%
Quadro P4000:
44.9 fps
Iris Pro Graphics 580:
63.7 fps
Iris Pro Graphics 580:
50.8 fps
Iris Pro Graphics 580:
28.5 fps
Iris Pro Graphics 580:
14.3 fps
Iris Graphics 540:
9.5 11 ~ 10 fps
100%
Quadro P4000:
196.9 fps
51%
Iris Pro Graphics 580:
101.3 fps
100%
Quadro P4000:
174.4 fps
33%
Iris Pro Graphics 580:
57.9 fps
100%
Quadro P4000:
162.4 fps
31%
Iris Pro Graphics 580:
51 fps
16%
Iris Pro Graphics 580:
14.9 fps
Iris Pro Graphics 580:
380.6 fps
Iris Pro Graphics 580:
127.1 fps
Iris Pro Graphics 580:
73.6 fps
Iris Pro Graphics 580:
36.2 fps
Iris Graphics 540:
85 137 ~ 111 fps
Iris Graphics 540:
49.2 70 ~ 60 fps
Iris Graphics 540:
20.6 fps
Iris Graphics 540:
19.6 20 ~ 20 fps
Iris Graphics 540:
6.6 fps
Iris Pro Graphics 580:
115.8 fps
Iris Pro Graphics 580:
38.7 fps
Iris Pro Graphics 580:
16.7 fps
Iris Pro Graphics 580:
107.2 fps
Iris Pro Graphics 580:
81.2 fps
Iris Pro Graphics 580:
37.3 fps
Iris Pro Graphics 580:
8.8 fps
Average Gaming NVIDIA Quadro P4000 → 100% Average Gaming 30-70 fps → 100%
Average Gaming Intel Iris Pro Graphics 580 → 23% Average Gaming 30-70 fps → 30%
Average Gaming Intel Iris Graphics 540 → 17% Average Gaming 30-70 fps → 27%
NVIDIA Quadro P4000 low med. high ultra QHD 4K Warhammer 40.000: Dawn of War III 70.3 61.6 58.8 54 Civilization VI 66.7 55.2 45.13 43.7 Doom 119.5 112.4 91 87.1 Rise of the Tomb Raider 115.9 103.2 76.8 65.5 Star Wars Battlefront 122.5 116.4 89.2 85.7 The Witcher 3 159.7 113.6 77.2 41.09 GRID: Autosport 153.8 106.3 96.9 84.5 Total War: Rome II 236.7 184.1 151.4 63.3 Company of Heroes 2 67.6 61.1 59.7 44.94 BioShock Infinite 196.9 174.4 162.4 96 < 30 fps < 60 fps < 120 fps ≥ 120 fps 5 5 1 7 2 3 5 2 4 6
Intel Iris Pro Graphics 580 low med. high ultra QHD 4K Overwatch 60.5 53.3 42.9 23.1 Doom Rise of the Tomb Raider 30.2 18.2 12.2 8.9 Fallout 4 Metal Gear Solid V 59.9 58.6 23 14.9 Dota 2 Reborn 59.8 37.2 15.3 14 Batman: Arkham Knight Thief 43.8 30.1 25 12.4 Metro: Last Light 63.7 50.8 28.5 14.3 BioShock Infinite 101.3 57.9 51 14.9 StarCraft II: Heart of the Swarm 380.6 127.1 73.6 36.2 Guild Wars 2 115.8 38.7 16.7 Sleeping Dogs 107.2 81.2 37.3 8.8 < 30 fps < 60 fps < 120 fps ≥ 120 fps 4 5 1 1 6 1 1 5 4 1 9 1
For more games that might be playable and a list of all games and graphics cards visit our Gaming List
v1.28
log 02. 05:55:46
#0 checking url part for id 7666 +0s ... 0s
#1 checking url part for id 7236 +0s ... 0s
#2 checking url part for id 6472 +0s ... 0s
#3 redirected to Ajax server, took 1719892546 +0s ... 0s
#4 did not recreate cache, as it is less than 5 days old! Created at Mon, 01 Jul 2024 05:16:07 +0200 +0s ... 0s
#5 composed specs +0.03s ... 0.03s
#6 did output specs +0s ... 0.03s
#7 start showIntegratedCPUs +0s ... 0.03s
#8 getting avg benchmarks for device 7666 +0.03s ... 0.06s
#9 got single benchmarks 7666 +0.004s ... 0.064s
#10 getting avg benchmarks for device 7236 +0.004s ... 0.068s
#11 got single benchmarks 7236 +0.004s ... 0.072s
#12 getting avg benchmarks for device 6472 +0.004s ... 0.075s
#13 got single benchmarks 6472 +0.01s ... 0.086s
#14 got avg benchmarks for devices +0s ... 0.086s
#15 min, max, avg, median took s +0.042s ... 0.128s
#16 before gaming benchmark output +0s ... 0.128s
#17 Got 284 rows for game benchmarks. +0.013s ... 0.141s
#18 composed SQL query for gamebenchmarks +0s ... 0.141s
#19 got data and put it in $dataArray +0.002s ... 0.143s
#20 benchmarks composed for output. +0.016s ... 0.159s
#21 calculated avg scores. +0s ... 0.159s
#22 return log +0.001s ... 0.16s
Please share our article, every link counts!
Redaktion, 2017-09- 8 (Update: 2023-07- 1)
 Deutsch
 English
 Español
 Français
 Italiano
 Nederlands
 Polski
 Português
 Русский
 Türkçe
 Svenska
 Chinese
 Magyar