Notebookcheck Logo

NVIDIA Quadro M5500 vs Nvidia RTX 1000 Ada Generation Laptop GPU vs NVIDIA Quadro M500M

NVIDIA Quadro M5500

► remove from comparison NVIDIA Quadro M5500

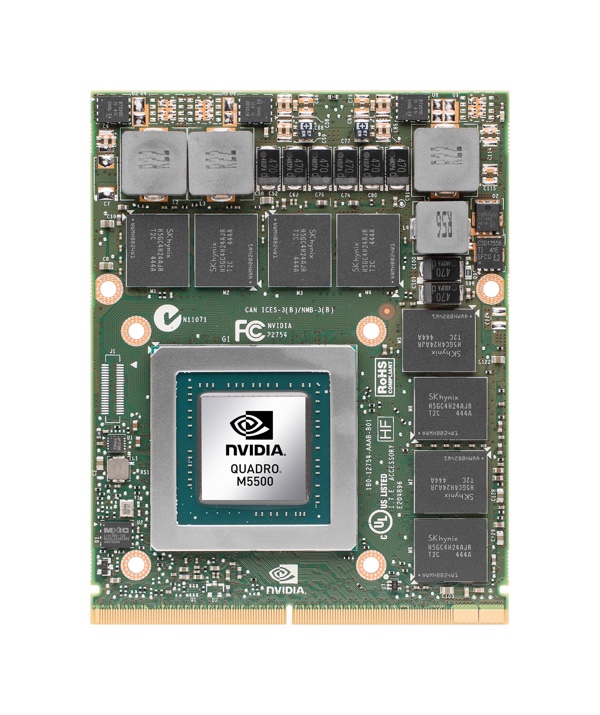
The Nvidia Quadro M5500 is a high-end, DirectX 12 (FL_12_1) and OpenGL 4.5-compatible graphics card for mobile workstations. It is a Maxwell-based GPU built on the GM204 chip with all 2048 shader cores activated and is manufactured in 28 nm at TSMC. Therefore, the GPU is similar to the consumer Nvidia GeForce GTX 980 (Notebook). Compared to the slower and less power hungry Quadro M5000M, the M5500 offers 512 more shaders which should result in 30-40% more performance according to Nvidia.

The Quadro series offers certified drivers that are optimized for stability and performance in professional applications like CAD or DCC. OpenGL performance, for example, should be significantly better compared to GeForce graphics cards of similar specifications.

Using CUDA (Compute Capability 5.2) or OpenCL 1.2, the cores of the Quadro M5000M can be used for general calculations.

The power consumption of the Quadro M5000M is rated at the same TGP of 150 Watt. Therefore, the card is suited for very large notebooks with 17-inch displays or greater.

The first laptop with the M5500 in it is the MSI WT72 Workstation.

Nvidia RTX 1000 Ada Generation Laptop GPU

► remove from comparison NVIDIA Nvidia RTX 1000 Ada Generation Laptop GPU

The Nvidia RTX 1000 Ada Generation Laptop GPU, not to be confused with the A1000, P1000 or T1000, is a lower-end professional graphics card for use in laptops that sports 2,560 CUDA cores and 6 GB of GDDR6 VRAM. It would be fair to say that this is a GeForce RTX 4050 (Laptop) in disguise; consequently, both are powered by the AD107 chip and are fast enough to handle most games at 1080p with quality set to High. The product was launched in February 2024; it leverages TSMC's 5 nm process and the Ada Lovelace architecture. The Nvidia-recommended TGP range for the card is very wide at 35 W to 140 W leading to bizarre performance differences between different systems powered by what is supposed to be the same product.

Quadro series graphics cards ship with much different BIOS and drivers than GeForce cards and are targeted at professional users rather than gamers. Commercial product design, large-scale calculations, simulation, data mining, 24 x 7 operation, certified drivers - if any of this sounds familiar, then a Quadro card will make you happy.

Architecture and Features

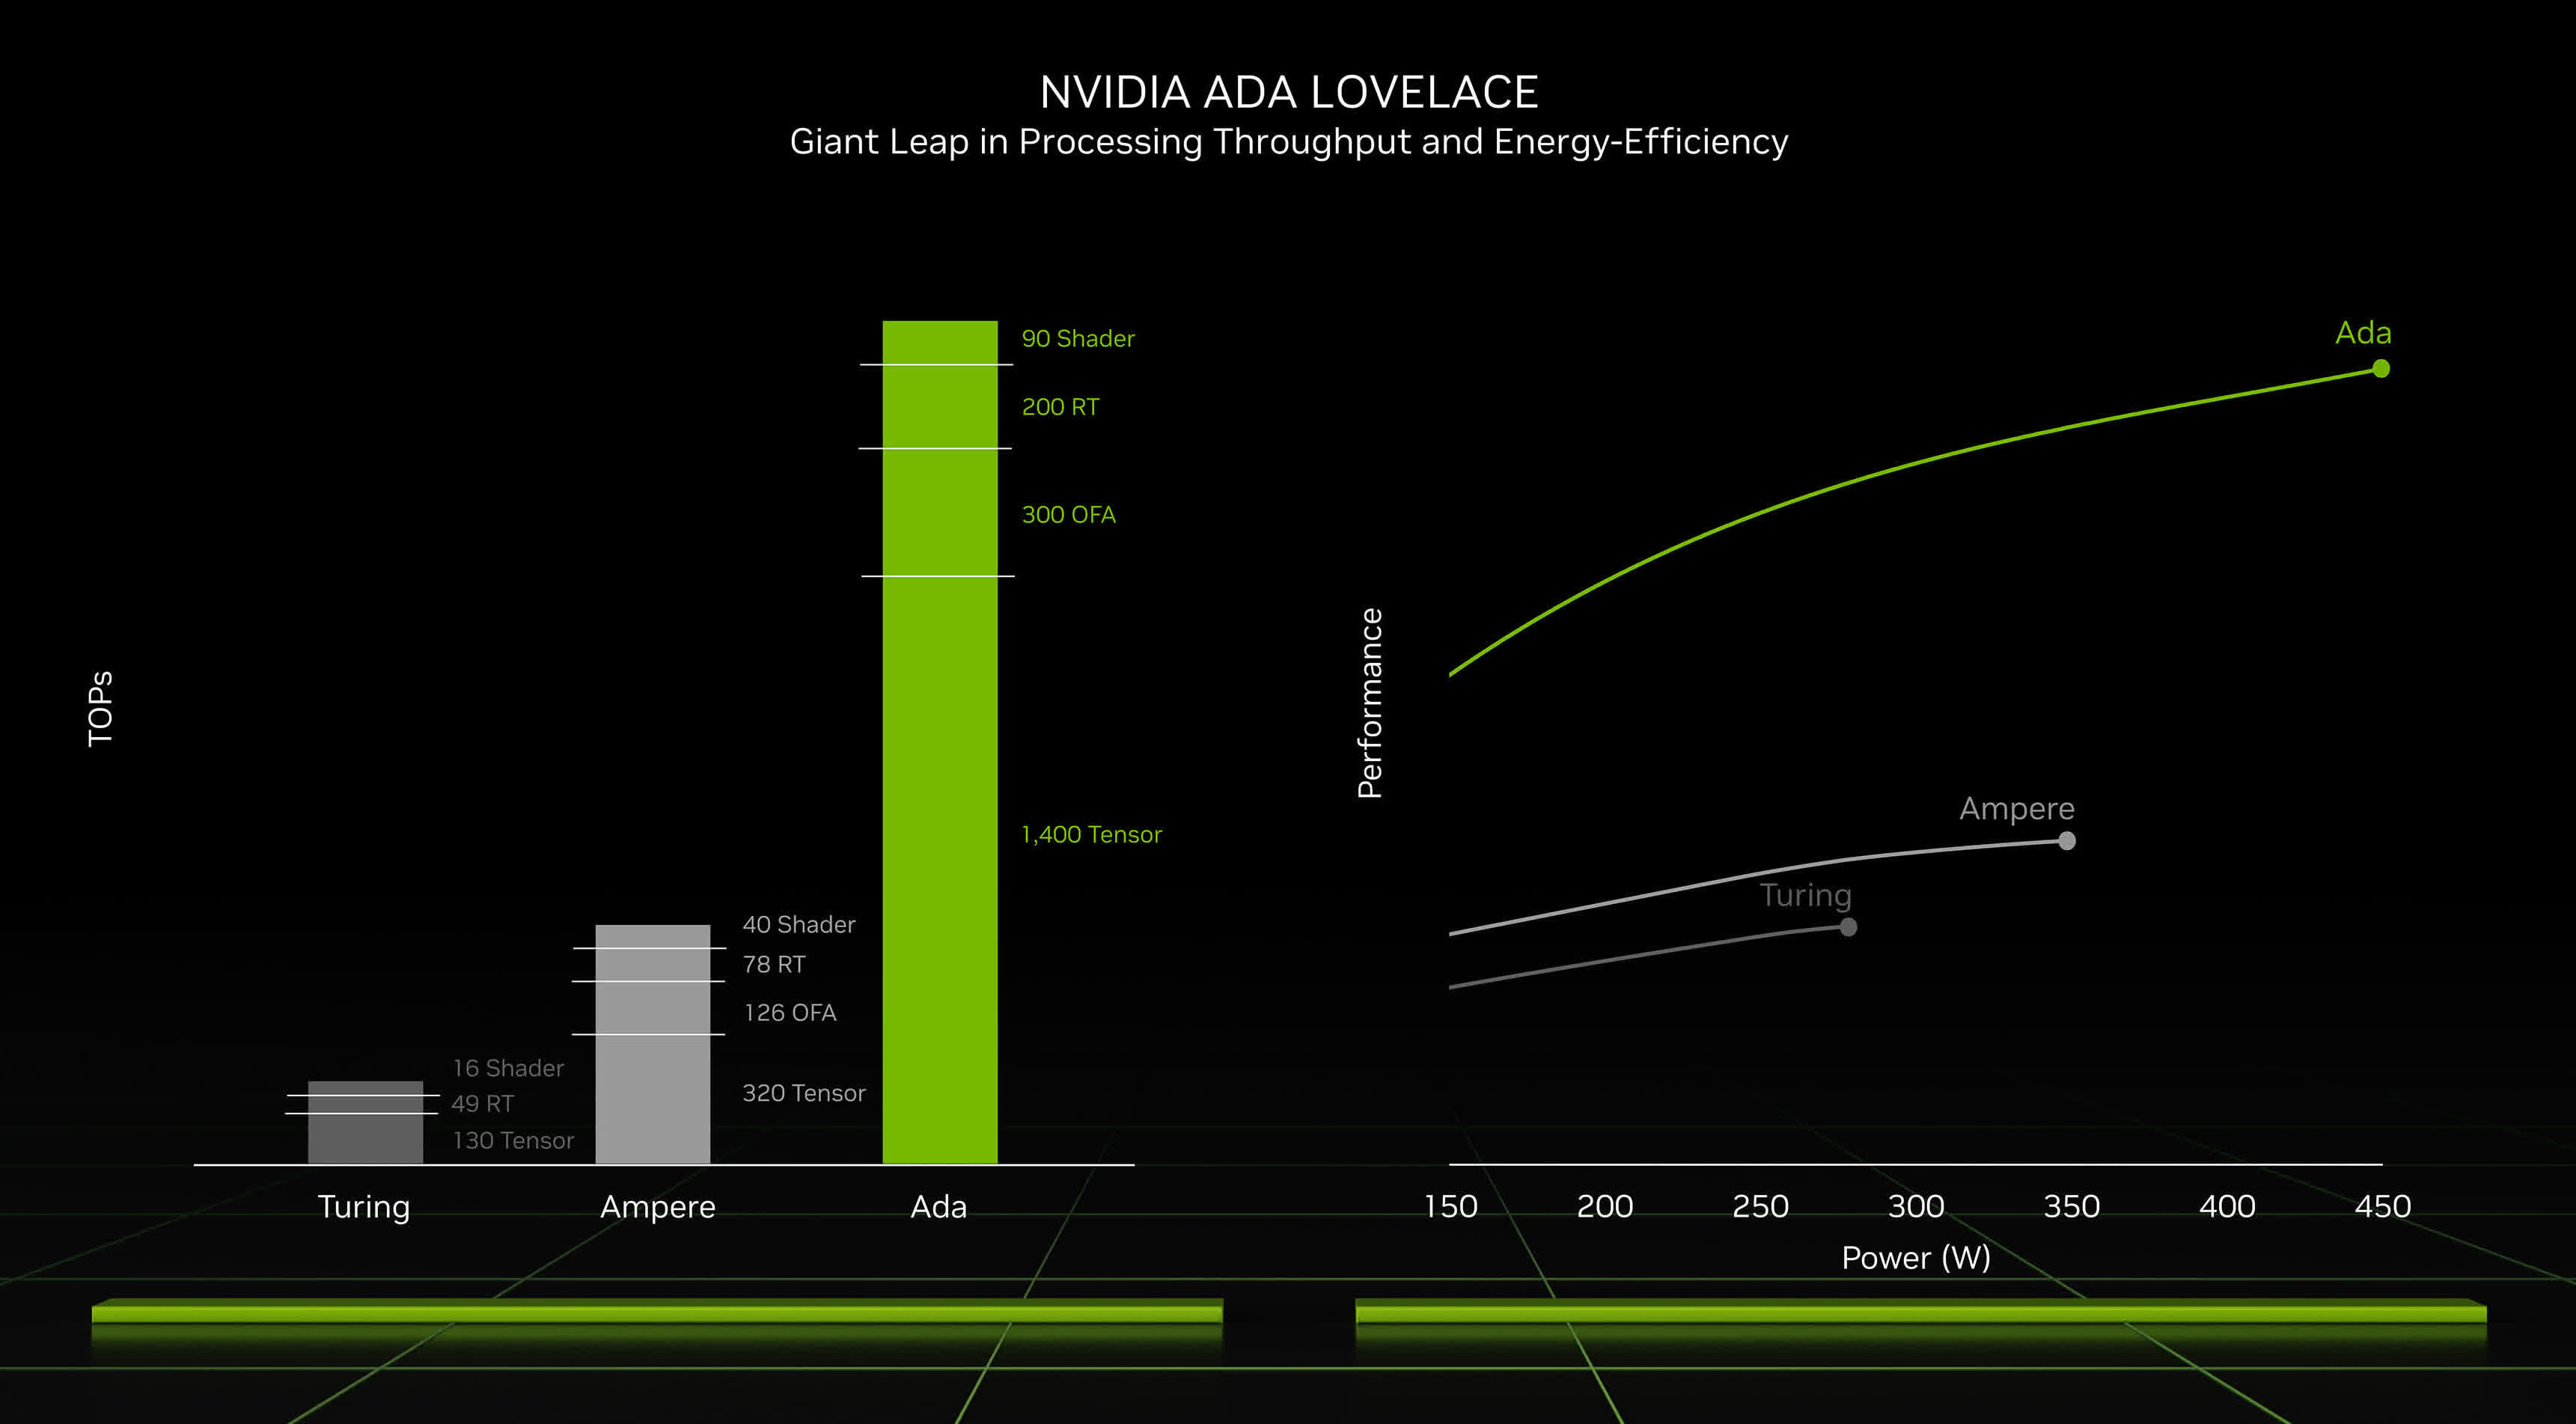
Ada Lovelace brings a range of improvements over older graphics cards utilizing the outgoing Ampere architecture. It's not just a better manufacturing process and a higher number of CUDA cores that we have here; under-the-hood refinements are plentiful, including an immensely larger L2 cache, an optimized ray tracing routine (a different way to determine what is transparent and what isn't is used), and other changes. Naturally, these graphics cards can both encode and decode some of the most widely used video codecs, AVC, HEVC and AV1 included; they also support a host of proprietary Nvidia technologies, including Optimus and DLSS 3, and they can certainly be used for various AI applications.

The RTX 1000 Ada features 20 RT cores of the 3rd generation, 80 Tensor cores of the 4th generation and 2,560 CUDA cores. Increase those numbers by 20%, and you get the RTX 2000 Ada - as long as we pay no attention to clock speed differences, of course. Unlike costlier Ada Generation professional laptop graphics cards, the RTX 1000 comes with just 6 GB of non-ECC VRAM; the lack of error correction makes this card less suitable for super-important tasks and round-the-clock operation. The VRAM is just 96-bit wide, delivering a not-so-impressive bandwidth of ~192 GB/s.

The RTX 1000 Ada Generation makes use of the PCI-Express 4 protocol, just like Ampere-based cards did. 8K SUHD monitors are supported, however, DP 1.4a video outputs may prove to be a bottleneck down the line.

Performance

While we are yet to test a single laptop powered by an RTX 1000 Ada as of late February, we have plenty of performance data for the RTX 4050 Laptop. Based on that, we expect a run-of-the-mill RTX 2000 Ada to deliver:

  • a Blender 3.3 Classroom CUDA score of around 54 seconds
  • a 3DMark 11 GPU score of around 27,000 points
  • around 50 fps in GTA V (1440p - Highest settings possible, 16x AF, 4x MSAA, FXAA)
  • upwards of 30 fps in Cyberpunk 2077 (1440p - High settings, Ultra RT, "Quality" DLSS)

Nvidia's marketing materials mention "up to 12.1 TFLOPS" of performance, a downgrade compared to 14.5 TFLOPS delivered by the RTX 2000 Ada.

Your mileage may vary depending on how competent the cooling solution of your laptop is and how high the TGP power target of the RTX 1000 Ada is.

Power consumption

Nvidia no longer divides its laptop graphics cards into Max-Q and non-max-Q models. Instead, laptop makers are free to set the TGP according to their needs, and the range can sometimes be shockingly wide. This is exactly the case with the RTX 1000, as the lowest value recommended for it sits at just 35 W while the highest is 300% higher at 140 W (this most likely includes Dynamic Boost). The slowest system built around an RTX 1000 Ada can easily be half as fast as the fastest one.

Last but not the least, the improved 5 nm process (TSMC 4N) the RTX 1000 is built with makes for decent energy efficiency, as of early 2024.

NVIDIA Quadro M500M

► remove from comparison NVIDIA Quadro M500M

The Nvidia Quadro M500M is a DirectX 12 (FL 11_0) and OpenGL 4.5-compatible graphics card for mobile workstations. It is a Maxwell-based GPU built on the GM108 chip with 384 shader cores and manufactured in 28 nm by TSMC. The Quadro M500M is the successor to the Quadro K620M which is also based on the Maxwell GM108 but lists a higher memory bandwidth of 16 vs. 14.4 GB/s. Therefore, it is also similar to the consumer GeForce 930M.

The Quadro series offers certified drivers that are optimized for stability and performance in professional applications like CAD or DCC. OpenGL performance, for example, should be significantly better than with GeForce graphics cards of similar specifications.

Architecture

Compared to Kepler, Maxwell has been optimized in several details to increase power efficiency. Smaller Streaming Multiprocessors (SMM) with only 128 ALUs (Kepler: 192) and an optimized scheduler should lead to better utilization of the shaders. Nvidia promises that a Maxwell SMM with 128 ALUs can offer 90% of the performance of a Kepler SMX with 192 ALUs. GM108 features 3 SMMs and thus 384 shader cores, 24 TMUs and 8 ROPs (64-bit interface).

Another optimization is the massively enlarged L2 cache. The larger size can reduce some of the memory traffic to allow for a relatively narrow memory interface without significantly hurting performance.

GM108 supports DirectX 11.2 (feature level 11.0 only) as well as DirectX 12.

Performance

The performance should be slightly below the Quadro K620M (same chip, but slightly more memory bandwidth) and therefore positioned in the entry-level of dedicated graphics chips. For 3D games the Quadro M500M should be similar to the GeForce 930M. Therefore, only low-demanding games should run fluently.

Features

The feature set should include support for up to four active displays. High-resolution monitors of up to 3840x2160 pixels can be connected using DisplayPort 1.2 or HDMI 1.4a (HDMI 2.0 not supported). HD-Audio codecs, such as Dolby TrueHD and DTS-HD, can be transmitted via bitstream mode through the HDMI port. However, as most laptops will feature Optimus, the integrated GPU will likely have direct control over the display ports and may limit the feature set available by the Nvidia Kepler cards.

Using CUDA or OpenCL, the cores of the Quadro M500M can be used for general calculations.

GM108 integrates the sixth generation of the PureVideo HD video engine (VP6), offering a better decoding performance for H.264 and MPEG-2 videos. Of course, VP6 supports all features of previous generations (4K support, PIP, video encoding via NVENC API).

Power Consumption

The power consumption of the Quadro M500M (and M600M, K620M) is rated at 30 W. Therefore, the GPU is best suited for laptops 13 - 14-inches in size and above. The M500M also supports Optimus to automatically switch between an integrated graphics card and the Nvidia GPU.

NVIDIA Quadro M5500Nvidia RTX 1000 Ada Generation Laptop GPUNVIDIA Quadro M500M
Quadro M Series
Quadro M5500 2048 @ 1.14 - 1.14 GHz256 Bit @ 6606 MHz
Quadro M5000M 1536 @ 0.96 - 1.05 GHz256 Bit @ 5000 MHz
Quadro M4000M 1280 @ 0.98 - 1.01 GHz256 Bit @ 5012 MHz
Quadro M3000M 1024 @ 1.05 GHz256 Bit @ 5000 MHz
Quadro M2200 1024 @ 0.69 - 1.04 GHz128 Bit @ 5508 MHz
Quadro M1200 640 @ 0.99 - 1.15 GHz128 Bit @ 5000 MHz
Quadro M2000M 640 @ 1.04 - 1.2 GHz128 Bit @ 5000 MHz
Quadro M1000M 512 @ 0.99 - 1.07 GHz128 Bit @ 5000 MHz
Quadro M620 512 @ 1.02 GHz128 Bit @ 5012 MHz
Quadro 5010M 384 @ 0.45 GHz256 Bit @ 1300 MHz
Quadro 4000M 336 @ 0.48 GHz256 Bit @ 1200 MHz
Quadro M520 384 @ 0.76 - 1.02 GHz64 Bit
Quadro M600M 384 @ 0.84 - 0.88 GHz128 Bit @ 5012 MHz
Quadro M500M 384 @ 1.03 - 1.12 GHz64 Bit @ 4004 MHz
Quadro 5000M 320 @ 0.41 GHz256 Bit @ 1200 MHz
Quadro 3000M 240 @ 0.45 GHz256 Bit @ 625 MHz
Quadro 2000M 192 @ 0.55 GHz128 Bit @ 900 MHz
Quadro 1000M 96 @ 0.7 GHz128 Bit @ 900 MHz
NVIDIA RTX 5000 Ada Generation Laptop GPU 9728 @ 0.93 - 1.68 GHz256 Bit @ 20000 MHz
NVIDIA RTX 4000 Ada Generation Laptop GPU 7424 192 Bit @ 16000 MHz
NVIDIA RTX 3500 Ada Generation Laptop GPU 5120 192 Bit @ 16000 MHz
NVIDIA RTX 3000 Ada Generation Laptop GPU 4608 128 Bit @ 16000 MHz
NVIDIA RTX 2000 Ada Generation Laptop GPU 3072 128 Bit @ 16000 MHz
Nvidia RTX 1000 Ada Generation Laptop GPU 2560 96 Bit @ 16000 MHz
Nvidia RTX 500 Ada Generation Laptop GPU 2048 64 Bit @ 12000 MHz
Quadro M5500 2048 @ 1.14 - 1.14 GHz256 Bit @ 6606 MHz
Quadro M5000M 1536 @ 0.96 - 1.05 GHz256 Bit @ 5000 MHz
Quadro M4000M 1280 @ 0.98 - 1.01 GHz256 Bit @ 5012 MHz
Quadro M3000M 1024 @ 1.05 GHz256 Bit @ 5000 MHz
Quadro M2200 1024 @ 0.69 - 1.04 GHz128 Bit @ 5508 MHz
Quadro M1200 640 @ 0.99 - 1.15 GHz128 Bit @ 5000 MHz
Quadro M2000M 640 @ 1.04 - 1.2 GHz128 Bit @ 5000 MHz
Quadro M1000M 512 @ 0.99 - 1.07 GHz128 Bit @ 5000 MHz
Quadro M620 512 @ 1.02 GHz128 Bit @ 5012 MHz
Quadro 5010M 384 @ 0.45 GHz256 Bit @ 1300 MHz
Quadro 4000M 336 @ 0.48 GHz256 Bit @ 1200 MHz
Quadro M520 384 @ 0.76 - 1.02 GHz64 Bit
Quadro M600M 384 @ 0.84 - 0.88 GHz128 Bit @ 5012 MHz
Quadro M500M 384 @ 1.03 - 1.12 GHz64 Bit @ 4004 MHz
Quadro 5000M 320 @ 0.41 GHz256 Bit @ 1200 MHz
Quadro 3000M 240 @ 0.45 GHz256 Bit @ 625 MHz
Quadro 2000M 192 @ 0.55 GHz128 Bit @ 900 MHz
Quadro 1000M 96 @ 0.7 GHz128 Bit @ 900 MHz
ArchitectureMaxwellAda LovelaceMaxwell
Pipelines2048 - unified2560 - unified384 - unified
Core Speed1139 - 1140 (Boost) MHz1029 - 1124 (Boost) MHz
Memory Speed6606 MHz16000 effective = 2000 MHz4004 MHz
Memory Bus Width256 Bit96 Bit64 Bit
Memory TypeGDDR5GDDR6DDR3
Max. Amount of Memory8 GB6 GB2048 MB
Shared Memorynonono
APIDirectX 12_1, OpenGL 4.5DirectX 12 Ultimate, Shader 6.7, OpenGL 4.6, OpenCL 3.0, Vulkan 1.3DirectX 12 (FL 11_0), Shader 5.0, OpenGL 4.5
Power Consumption150 Watt115 Watt (35 - 115 Watt TGP)30 Watt
Transistors5.2 Billion
technology28 nm5 nm28 nm
FeaturesCUDA, 3D Vision, PhysX, GeForce Experience, Surround, GameStream, GPU Boost 2.0, Adaptive Vertical Sync, G-SYNC, SLIOptimus, PhysX, 3D Vision Pro, nView, Optimus
Notebook Sizelargelargelarge
Date of Announcement04.04.2016 27.02.2024 15.12.2015
CodenameGN21-X2
TMUs80
ROPs32
Raytracing Cores20
Tensor / AI Cores80
CacheL2: 12 MB
Memory Bandwidth192 GB/s
PCIe4.0 x16
Displays4 Displays (max.), HDMI 2.1, DisplayPort 1.4a
Link to Manufacturer Pageimages.nvidia.com

Benchmarks

Performance Rating - 3DMark 11 + Fire Strike + Time Spy - Quadro M500M
0.7 pt (2%)
3DMark - 3DMark Ice Storm Unlimited Graphics
126522 Points (14%)
3DMark - 3DMark Ice Storm Extreme Graphics
min: 24523     avg: 33578     median: 33578 (4%)     max: 42633 Points
3DMark - 3DMark Cloud Gate Score
min: 5986     avg: 6299     median: 6359 (7%)     max: 6491 Points
3DMark - 3DMark Cloud Gate Graphics
min: 8211     avg: 8403     median: 8348 (2%)     max: 8703 Points
3DMark - 3DMark Fire Strike Standard Score
min: 1387     avg: 1401     median: 1391.5 (2%)     max: 1432 Points
3DMark - 3DMark Fire Strike Standard Graphics
min: 1585     avg: 1596     median: 1594.5 (2%)     max: 1610 Points
3DMark - 3DMark Ice Storm Graphics
min: 26395     avg: 38225     median: 40554 (5%)     max: 45396 Points
3DMark 11 - 3DM11 Performance Score
14413 Points (20%)
min: 2350     avg: 2431     median: 2447 (3%)     max: 2478 Points
3DMark 11 - 3DM11 Performance GPU
min: 2222     avg: 2341     median: 2364.5 (2%)     max: 2412 Points
3DMark Vantage
3DM Vant. Perf. total + NVIDIA Quadro M500M
3DMark Vantage - 3DM Vant. Perf. total
7959 Points (2%)
3DM Vant. Perf. GPU no PhysX + NVIDIA Quadro M500M
3DMark Vantage - 3DM Vant. Perf. GPU no PhysX
7181 Points (4%)
3DMark 06 3DMark 06 - Standard 1280x1024 + NVIDIA Quadro M500M
3DMark 06
min: 11913     avg: 12378     median: 12377.5 (16%)     max: 12842 Points
Unigine Valley 1.0 - Unigine Valley 1.0 DX
min: 6.1     avg: 6.3     median: 6.3 (2%)     max: 6.5 fps
Unigine Heaven 3.0 - Unigine Heaven 3.0 DX 11
min: 21     avg: 21.4     median: 21.4 (7%)     max: 21.7 fps
Unigine Heaven 3.0 - Unigine Heaven 3.0 OpenGL
min: 19.1     avg: 19.6     median: 19.6 (9%)     max: 20 fps
Unigine Heaven 2.1 - Heaven 2.1 high
min: 28.4     avg: 28.7     median: 28.7 (5%)     max: 28.9 fps
SPECviewperf 11
specvp11 snx-01 + NVIDIA Quadro M500M
SPECviewperf 11 - specvp11 snx-01
min: 24.74     avg: 26.3     median: 24.8 (15%)     max: 29.41 fps
specvp11 tcvis-02 + NVIDIA Quadro M500M
SPECviewperf 11 - specvp11 tcvis-02
min: 25.48     avg: 28.9     median: 25.5 (14%)     max: 35.63 fps
specvp11 sw-02 + NVIDIA Quadro M500M
SPECviewperf 11 - specvp11 sw-02
min: 34.95     avg: 36.6     median: 35.1 (27%)     max: 39.63 fps
specvp11 proe-05 + NVIDIA Quadro M500M
SPECviewperf 11 - specvp11 proe-05
min: 14.61     avg: 14.8     median: 14.9 (18%)     max: 14.98 fps
specvp11 maya-03 + NVIDIA Quadro M500M
SPECviewperf 11 - specvp11 maya-03
min: 42.62     avg: 44.2     median: 43 (32%)     max: 46.88 fps
specvp11 lightwave-01 + NVIDIA Quadro M500M
SPECviewperf 11 - specvp11 lightwave-01
min: 38.69     avg: 41.5     median: 38.8 (42%)     max: 46.9 fps
specvp11 ensight-04 + NVIDIA Quadro M500M
SPECviewperf 11 - specvp11 ensight-04
min: 16.84     avg: 18.1     median: 16.9 (8%)     max: 20.44 fps
specvp11 catia-03 + NVIDIA Quadro M500M
SPECviewperf 11 - specvp11 catia-03
min: 32.55     avg: 34.5     median: 32.7 (17%)     max: 38.08 fps
SPECviewperf 12
specvp12 sw-03 + NVIDIA Quadro M5500
SPECviewperf 12 - specvp12 sw-03
144 fps (36%)
specvp12 sw-03 + NVIDIA Quadro M500M
min: 29.64     avg: 34.1     median: 35.5 (9%)     max: 37.22 fps
specvp12 snx-02 + NVIDIA Quadro M5500
SPECviewperf 12 - specvp12 snx-02
120 fps (18%)
specvp12 snx-02 + NVIDIA Quadro M500M
min: 16.01     avg: 20.8     median: 19.1 (3%)     max: 27.21 fps
specvp12 showcase-01 + NVIDIA Quadro M5500
SPECviewperf 12 - specvp12 showcase-01
60.3 fps (13%)
specvp12 showcase-01 + NVIDIA Quadro M500M
min: 5.46     avg: 6.1     median: 6.1 (1%)     max: 6.9 fps
specvp12 mediacal-01 + NVIDIA Quadro M5500
SPECviewperf 12 - specvp12 mediacal-01
53.8 fps (14%)
specvp12 mediacal-01 + NVIDIA Quadro M500M
min: 6.82     avg: 7.8     median: 7.2 (2%)     max: 9.51 fps
specvp12 maya-04 + NVIDIA Quadro M5500
SPECviewperf 12 - specvp12 maya-04
95 fps (26%)
specvp12 maya-04 + NVIDIA Quadro M500M
min: 11.14     avg: 11.6     median: 11.2 (3%)     max: 12.43 fps
specvp12 energy-01 + NVIDIA Quadro M5500
SPECviewperf 12 - specvp12 energy-01
12.2 fps (11%)
specvp12 energy-01 + NVIDIA Quadro M500M
min: 0.35     avg: 0.4     median: 0.4 (0%)     max: 0.53 fps
specvp12 creo-01 + NVIDIA Quadro M5500
SPECviewperf 12 - specvp12 creo-01
110 fps (44%)
specvp12 creo-01 + NVIDIA Quadro M500M
min: 17.92     avg: 21     median: 20.6 (8%)     max: 24.47 fps
specvp12 catia-04 + NVIDIA Quadro M5500
SPECviewperf 12 - specvp12 catia-04
137 fps (23%)
specvp12 catia-04 + NVIDIA Quadro M500M
min: 18.35     avg: 19.9     median: 20 (3%)     max: 21.42 fps
Cinebench R10 Cinebench R10 Shading (32bit) + NVIDIA Quadro M500M
Cinebench R10 - Cinebench R10 Shading (32bit)
min: 5476     avg: 6461     median: 6602 (5%)     max: 7305 Points
Cinebench R11.5 Cinebench R11.5 OpenGL 64 Bit + NVIDIA Quadro M500M
Cinebench R11.5 - Cinebench R11.5 OpenGL 64 Bit
min: 28.44     avg: 35.2     median: 37.5 (13%)     max: 39.77 fps
Cinebench R15
Cinebench R15 OpenGL 64 Bit + NVIDIA Quadro M5500
Cinebench R15 - Cinebench R15 OpenGL 64 Bit
106.7 fps (6%)
Cinebench R15 OpenGL 64 Bit + NVIDIA Quadro M500M
min: 34.89     avg: 41.2     median: 40.7 (2%)     max: 48.45 fps
Cinebench R15 OpenGL Ref. Match 64 Bit + NVIDIA Quadro M500M
Cinebench R15 - Cinebench R15 OpenGL Ref. Match 64 Bit
99.6 % (100%)
GFXBench - GFXBench Car Chase Offscreen
28.9 fps (3%)
GFXBench 3.1 - GFXBench Manhattan ES 3.1 Offscreen
53.2 fps (1%)
GFXBench 3.0 - GFXBench 3.0 Manhattan Offscreen
67.9 fps (4%)
GFXBench (DX / GLBenchmark) 2.7
GFXBench T-Rex HD Offscreen C24Z16 + NVIDIA Quadro M500M
GFXBench (DX / GLBenchmark) 2.7 - GFXBench T-Rex HD Offscreen C24Z16
129.5 fps (1%)
LuxMark v2.0 64Bit - LuxMark v2.0 Room GPU
min: 328     avg: 353.3     median: 354 (2%)     max: 378 Samples/s
LuxMark v2.0 64Bit - LuxMark v2.0 Sala GPU
min: 618     avg: 804     median: 850 (1%)     max: 945 Samples/s
ComputeMark v2.1 - ComputeMark v2.1 Result
min: 1690     avg: 1741     median: 1741 (2%)     max: 1792 Points

Average Benchmarks NVIDIA Quadro M5500 → 0% n=

Average Benchmarks NVIDIA Quadro M500M → 0% n=

- Range of benchmark values for this graphics card
- Average benchmark values for this graphics card
* Smaller numbers mean a higher performance
1 This benchmark is not used for the average calculation

Game Benchmarks

The following benchmarks stem from our benchmarks of review laptops. The performance depends on the used graphics memory, clock rate, processor, system settings, drivers, and operating systems. So the results don't have to be representative for all laptops with this GPU. For detailed information on the benchmark results, click on the fps number.

Overwatch

Overwatch

2016
low 1280x720
Quadro M500M:
49.1  fps
med. 1366x768
Quadro M500M:
28.3  fps
high 1920x1080
Quadro M500M:
22.2  fps
low 1024x768
Quadro M500M:
30.3  fps
med. 1366x768
Quadro M500M:
18.6  fps
high 1920x1080
Quadro M500M:
10.4  fps
low 1024x768
Quadro M500M:
46.9 65.4 ~ 56 fps
med. 1366x768
Quadro M500M:
32.4 38.2 ~ 35 fps
high 1920x1080
Quadro M500M:
19.2 20.2 ~ 20 fps
ultra 1920x1080
Quadro M500M:
11.9 13.1 ~ 13 fps
low 1024x768
Quadro M500M:
35.6  fps
med. 1366x768
Quadro M500M:
29.6  fps
high 1920x1080
Quadro M500M:
16.2  fps
ultra 1920x1080
Quadro M500M:
14.5  fps
low 1024x768
Quadro M500M:
56.5  fps
med. 1366x768
Quadro M500M:
33.3  fps
high 1920x1080
Quadro M500M:
15.2  fps
ultra 1920x1080
Quadro M500M:
13  fps
low 1280x720
Quadro M500M:
27  fps
med. 1366x768
Quadro M500M:
21  fps
high 1920x1080
Quadro M500M:
10  fps
ultra 1920x1080
Quadro M500M:
7  fps
low 1024x768
Quadro M500M:
29 30.5 ~ 30 fps
med. 1366x768
Quadro M500M:
17.9 18.9 ~ 18 fps
high 1920x1080
Quadro M500M:
9.9 10.2 ~ 10 fps
low 1024x768
Quadro M500M:
82.6  fps
med. 1366x768
Quadro M500M:
32.8  fps
high 1920x1080
Quadro M500M:
19.5  fps
ultra 1920x1080
Quadro M500M:
12.7  fps
Thief

Thief

2014
low 1024x768
Quadro M500M:
33.7 35 ~ 34 fps
med. 1366x768
Quadro M500M:
22.9 23.4 ~ 23 fps
high 1366x768
Quadro M500M:
18.6 19.1 ~ 19 fps
ultra 1920x1080
Quadro M500M:
9.2 9.6 ~ 9 fps
low 1024x768
Quadro M500M:
62.6  fps
med. 1366x768
Quadro M500M:
48.1  fps
high 1366x768
Quadro M500M:
42.3  fps
ultra 1920x1080
Quadro M500M:
10.5  fps
low 1024x768
Quadro M500M:
48.9  fps
med. 1366x768
Quadro M500M:
38.3  fps
high 1366x768
Quadro M500M:
22.9  fps
ultra 1920x1080
Quadro M500M:
11.6  fps
low 1280x720
Quadro M500M:
89.1 89.9 94.9 ~ 91 fps
med. 1366x768
Quadro M500M:
50.1 50.2 54 ~ 51 fps
high 1366x768
Quadro M500M:
40.3 40.5 43.8 ~ 42 fps
ultra 1920x1080
Quadro M500M:
13.8 13.8 14.7 ~ 14 fps
low 1024x768
Quadro M500M:
217.5  fps
med. 1366x768
Quadro M500M:
93.6  fps
high 1366x768
Quadro M500M:
48.7  fps
ultra 1920x1080
Quadro M500M:
24.2  fps
low 1024x768
Quadro M500M:
137.8  fps
med. 1366x768
Quadro M500M:
62.7  fps
high 1366x768
Quadro M500M:
34.4  fps
ultra 1920x1080
Quadro M500M:
17.3  fps
Mafia 2

Mafia 2

2010
low 800x600
Quadro M500M:
78.5  fps
med. 1024x768
Quadro M500M:
57  fps
high 1360x768
Quadro M500M:
45.8  fps
ultra 1920x1080
Quadro M500M:
27.5  fps
NVIDIA Quadro M500Mlowmed.highultraQHD4K
Overwatch49.128.322.2
Rise of the Tomb Raider30.318.610.4
Rainbow Six Siege56352013
Just Cause 335.629.616.214.5
Star Wars Battlefront56.533.315.213
Batman: Arkham Knight2721107
The Witcher 3301810
Dirt Rally82.632.819.512.7
Thief3423199
Total War: Rome II62.648.142.310.5
Metro: Last Light48.938.322.911.6
BioShock Infinite91514214
StarCraft II: Heart of the Swarm217.593.648.724.2
Tomb Raider137.862.734.417.3
Mafia 278.55745.827.5
< 30 fps
< 60 fps
< 120 fps
≥ 120 fps
1
8
4
2
6
7
2
10
5

12


For more games that might be playable and a list of all games and graphics cards visit our Gaming List

v1.28
log 01. 22:59:11

#0 checking url part for id 7282 +0s ... 0s

#1 checking url part for id 12424 +0s ... 0s

#2 checking url part for id 7063 +0s ... 0s

#3 redirected to Ajax server, took 1719867551 +0s ... 0s

#4 did not recreate cache, as it is less than 5 days old! Created at Mon, 01 Jul 2024 05:16:07 +0200 +0s ... 0s

#5 composed specs +0.057s ... 0.057s

#6 did output specs +0s ... 0.057s

#7 start showIntegratedCPUs +0s ... 0.057s

#8 getting avg benchmarks for device 7282 +0.027s ... 0.085s

#9 got single benchmarks 7282 +0.005s ... 0.089s

#10 getting avg benchmarks for device 12424 +0s ... 0.09s

#11 got single benchmarks 12424 +0s ... 0.09s

#12 getting avg benchmarks for device 7063 +0.004s ... 0.094s

#13 got single benchmarks 7063 +0.007s ... 0.101s

#14 got avg benchmarks for devices +0s ... 0.101s

#15 min, max, avg, median took s +0.025s ... 0.126s

#16 before gaming benchmark output +0s ... 0.126s

#17 Got 76 rows for game benchmarks. +0.006s ... 0.132s

#18 composed SQL query for gamebenchmarks +0s ... 0.132s

#19 got data and put it in $dataArray +0.001s ... 0.133s

#20 benchmarks composed for output. +0.005s ... 0.138s

#21 calculated avg scores. +0s ... 0.138s

#22 return log +0s ... 0.138s

Please share our article, every link counts!
> Expert Reviews and News on Laptops, Smartphones and Tech Innovations > Benchmarks / Tech > Graphics Card Comparison - Head 2 Head
Redaktion, 2017-09- 8 (Update: 2023-07- 1)