 Deutsch
 English
 Español
 Français
 Italiano
 Nederlands
 Polski
 Português
 Русский
 Türkçe
 Svenska
 Chinese
 Magyar
NVIDIA Quadro M5500 vs NVIDIA RTX 3500 Ada Generation Laptop GPU vs NVIDIA Quadro 2000M
NVIDIA Quadro M5500
► remove from comparison
The Nvidia Quadro M5500 is a high-end, DirectX 12 (FL_12_1) and OpenGL 4.5-compatible graphics card for mobile workstations. It is a Maxwell-based GPU built on the GM204 chip with all 2048 shader cores activated and is manufactured in 28 nm at TSMC. Therefore, the GPU is similar to the consumer Nvidia GeForce GTX 980 (Notebook). Compared to the slower and less power hungry Quadro M5000M, the M5500 offers 512 more shaders which should result in 30-40% more performance according to Nvidia.
The Quadro series offers certified drivers that are optimized for stability and performance in professional applications like CAD or DCC. OpenGL performance, for example, should be significantly better compared to GeForce graphics cards of similar specifications.
Using CUDA (Compute Capability 5.2) or OpenCL 1.2, the cores of the Quadro M5000M can be used for general calculations.
The power consumption of the Quadro M5000M is rated at the same TGP of 150 Watt. Therefore, the card is suited for very large notebooks with 17-inch displays or greater.
The first laptop with the M5500 in it is the MSI WT72 Workstation.
NVIDIA RTX 3500 Ada Generation Laptop GPU
► remove from comparison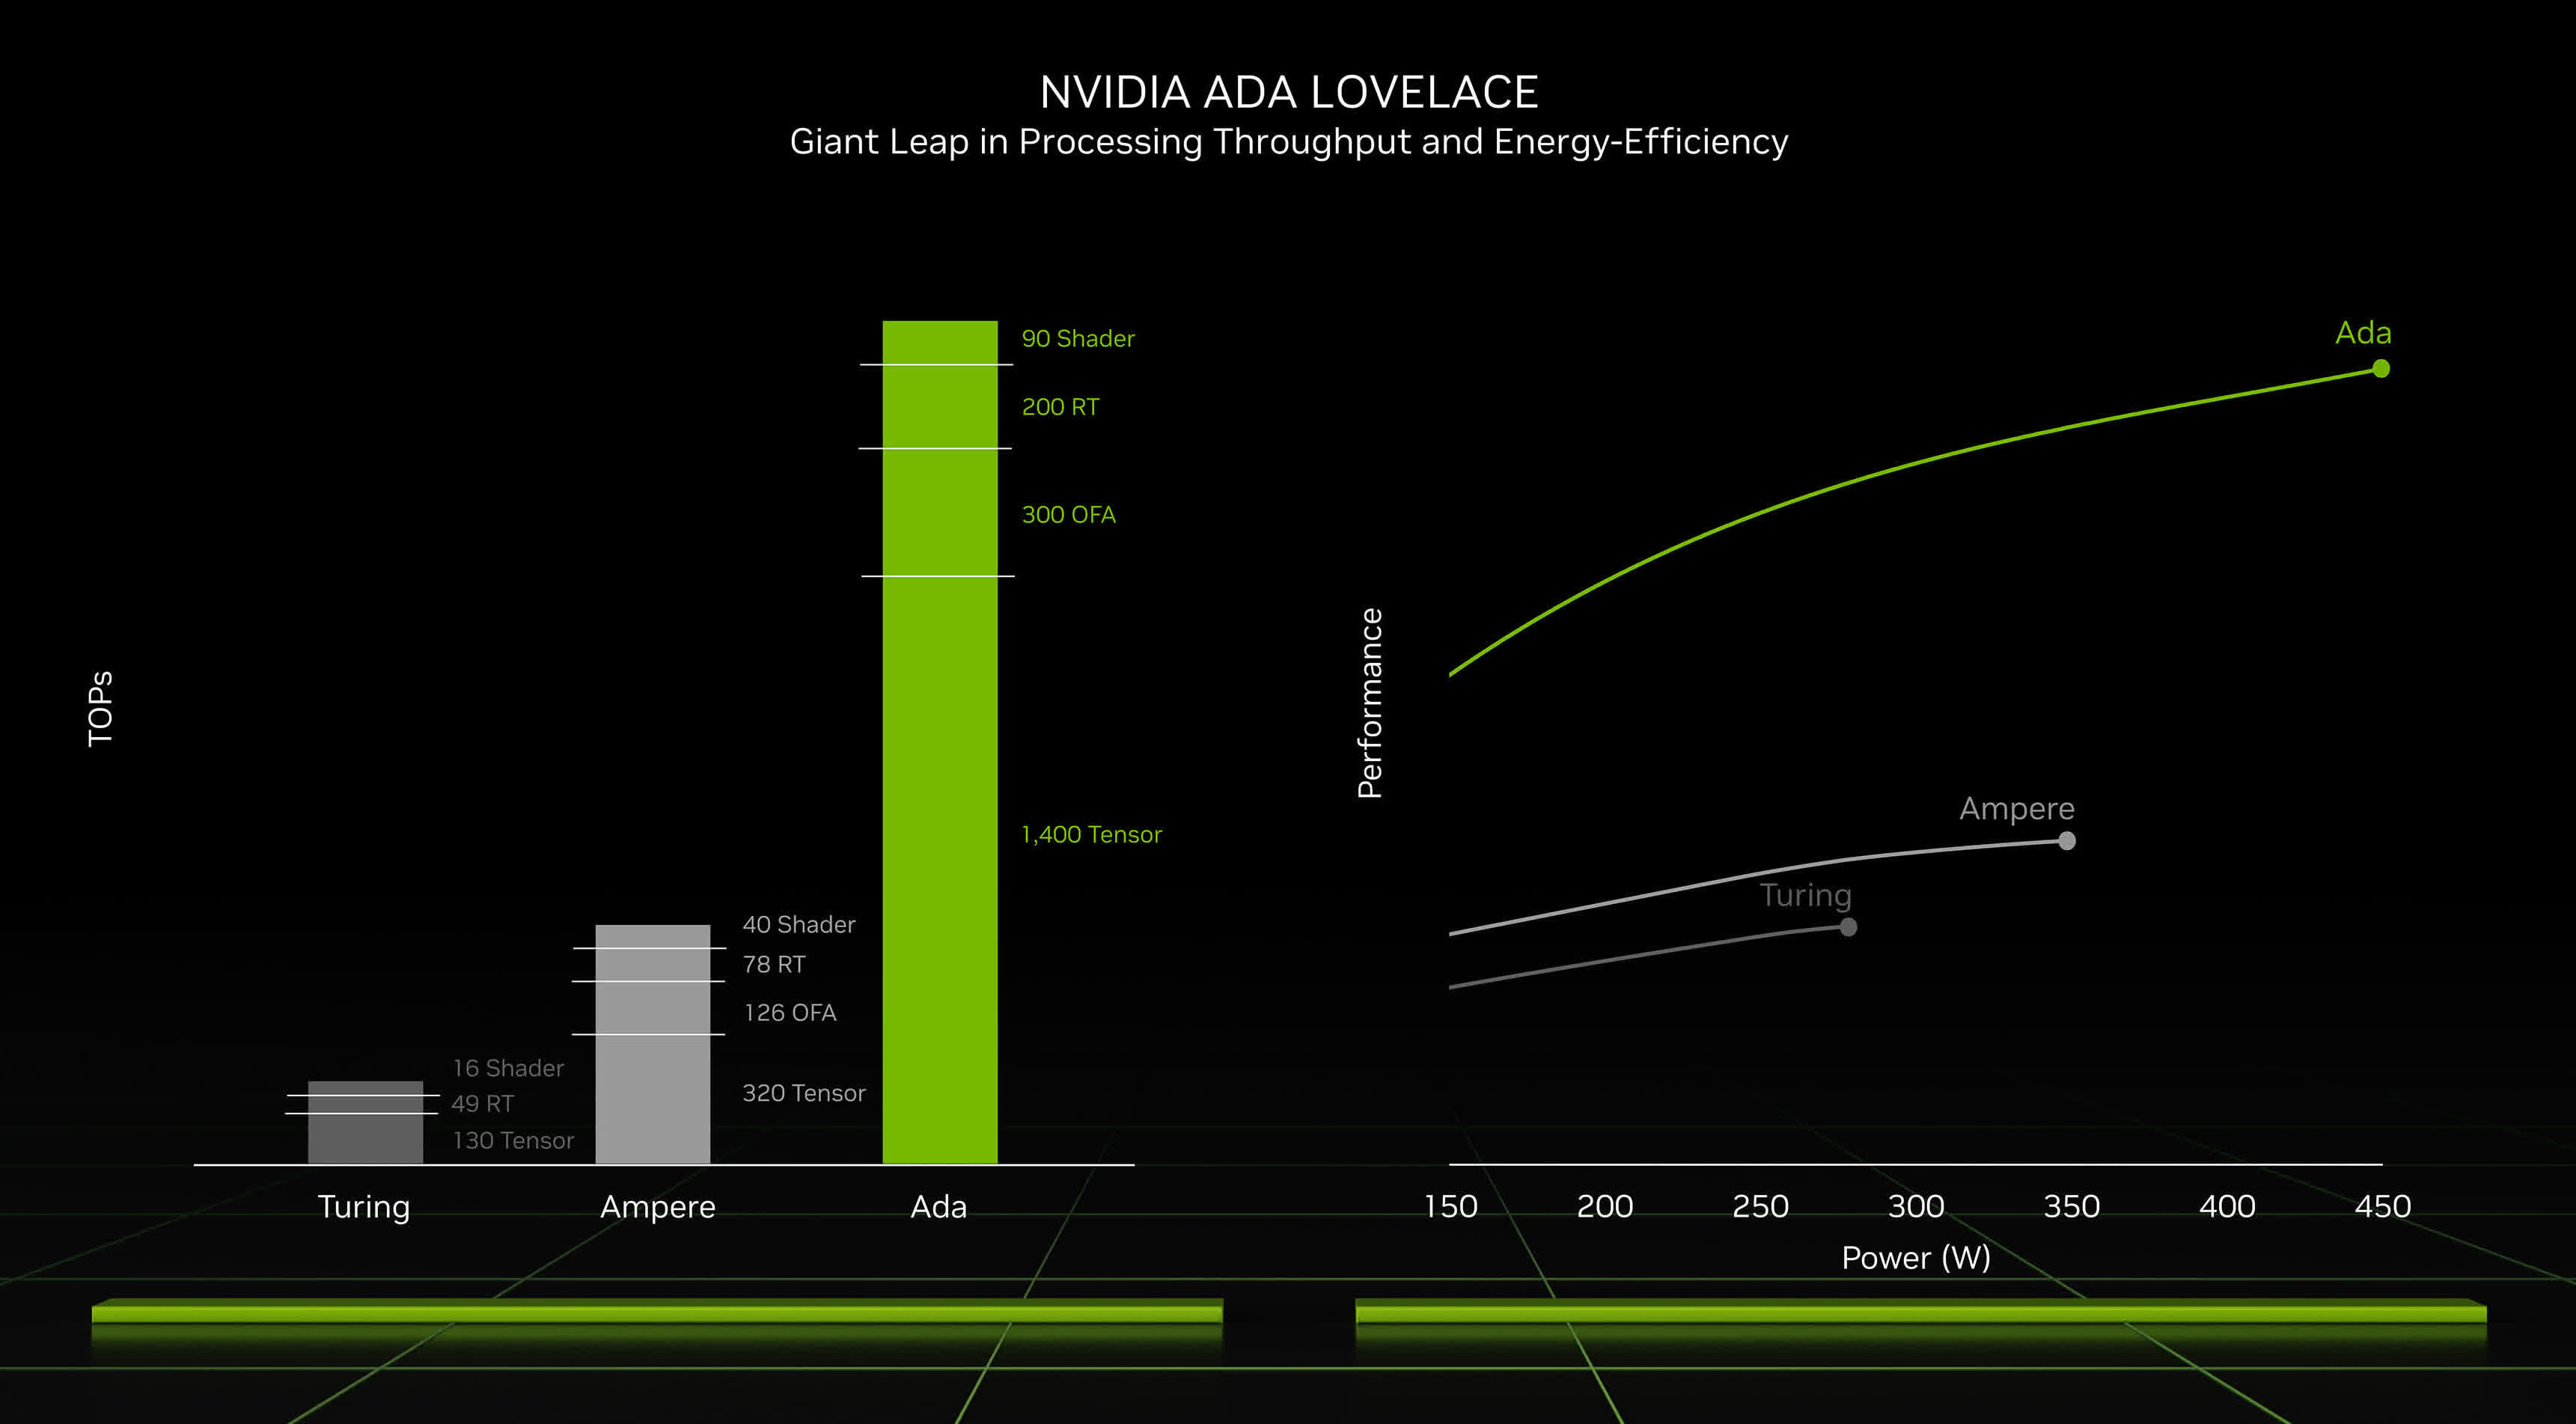
The Nvidia RTX 3500 Ada Generation is a higher-end professional graphics card for use in laptops that sports 5,120 CUDA cores and 12 GB of ECC GDDR6 VRAM. Brought into existence in 2023, this graphics adapter leverages TSMC's 5 nm process and Nvidia's Ada Lovelace architecture to achieve higher-than-average performance combined with moderate power consumption. The Nvidia-recommended TGP range for the card is very wide at 60 W to 140 W leading to bizarre performance differences between different systems powered by what is supposed to be the same product.
Hardware-wise, the RTX 3500 is a cut-down GeForce RTX 4070 Desktop, as far as we can tell. Consequently, both make use of the AD104 chip and have little difficulty running triple-A games at QHD 1440p.
Quadro series graphics cards ship with a different BIOS and drivers than GeForce cards and are targeted at professional users rather than gaming. Commercial product design, large-scale calculations, simulation, data mining, 24 x 7 operation, certified drivers - if any of this sounds familiar, then a Quadro card will make you happy.
Architecture and Features
Ada Lovelace brings a range of improvements over older graphics cards utilizing the outgoing Ampere architecture. It's not just a better manufacturing process and a higher number of CUDA cores that we have here (up to 16,384 versus 10,752); under-the-hood refinements are plentiful, including an immensely larger L2 cache, an optimized ray tracing routine (a different wat to determine what is transparent and what isn't is used), and other changes. Naturally, these graphics cards can both encode and decode some of the most widely used video codecs, AVC, HEVC and AV1 included; they also support a host of Nvidia technologies, including Optimus and DLSS 3, and they can certainly be used for various AI tasks.
The RTX 3500 Ada features 40 RT cores of the 3rd generation, 160 Tensor cores of the 4th generation and 5,120 CUDA cores. Multiply those numbers by 1.15 and what you get looks exactly like a desktop RTX 4070: 46, 184 and 5,888, respectively. Elsewhere, the graphics card comes with 12 GB of 192-bit wide ECC GDDR6 memory for a very healthy throughput of ~432 GB/s. Error correction can be turned off if desired. The fact that error correction is present here proves that the RTX 3500 Ada is indeed targeted at professional users.
Just like Ampere-based cards, the RTX 3500 makes use of the PCI-Express 4 protocol. 8K SUHD monitors are supported, however, DP 1.4a video outputs may prove to be a bottleneck down the line.
Performance
While we have not tested a single system featuring an RTX 3500 Ada Generation as of February 2024, we have plenty of performance data for the RTX 4070 Desktop, a graphics card that's about 20% superior to the RTX 3500 Ada Generation. Based on that, we fully expect the RTX 3500 to deliver:
- a Blender 3.3 Classroom CUDA score of around 32 seconds
- a 3DMark 11 GPU score of around 44,000
- around 90 fps in GTA V (1440p - Highest settings possible, 16x AF, 4x MSAA, FXAA)
- around 50 fps in Cyberpunk 2077 (1440p - High settings, Ultra RT, "Quality" DLSS)
Nvidia's marketing materials mention "up to 23 TFLOPS" of performance, a 15% improvement over 20 TFLOPS delivered by the RTX 3000 Ada Generation.
Your mileage may vary depending on how competent the cooling solution of your laptop is and how high the TGP power target of the RTX 3500 is. One other thing worth mentioning is that enabling error correction appears to reduce the amount of video memory that is available to applications and games by up to a gigabyte.
Power consumption
Nvidia no longer divides its laptop graphics cards into Max-Q and non-max-Q models. Instead, laptop makers are free to set the TGP according to their needs, and the range can sometimes be shockingly wide. This is the case for the RTX 3500, as the lowest value recommended for it sits at just 60 W while the highest is more than two times higher at 140 W (this most likely includes Dynamic Boost). The slowest system built around an RTX 3500 Ada can easily be 60% slower than the fastest one. This is the kind of delta that we've been seeing on consumer-grade laptops featuring the latest GeForce RTX cards.
Last but not the least, the improved 5 nm process (TSMC 4N) the RTX 3500 is built with makes for very decent energy efficiency, as of mid 2023.
NVIDIA Quadro 2000M
► remove from comparisonThe NVIDIA Quadro 2000M is a professional workstation graphics card based on the Fermi architecture (likely the GF104 or GF106). It offers the same amount of shaders like the GeForce GTX 460M, but only a 128 Bit memory bus for DDR3 memory. The slow DDR3 memory in particular could be a bottleneck to the GPU
The Quadro series offers certified drivers that are optimized for stability and performance in professional applications like CAD, DCC, medicine, or visualisation areas. OpenGL performance, for example, should be significantly better than GeForce graphics cards of similar specifications.
The shader/CUDA cores can be accessed using DirectX 11 or OpenGL 4.1 for graphics rendering and DirectCompute, OpenCL, AXE, and CUDA for general purpose calculations. Due to the new Fermi core, the 2000M should offer high performance in general purpose calculations.
Furthermore, the Nvidia Quadro 2000M is compatible with the new stereoscopic solution by Nvidia, NVIDIA 3D Vision Pro.
To automatically switch between the processor graphics card and the Quadro, the 2000M supports Nvidia Optimus. The implementation of the technology into specific notebook models is dependent on the laptop vendor.
The Quadro 2000M is specified at 55 Watt TDP and is therefore best suited for 15.6" or greater laptops.
| NVIDIA Quadro M5500 | NVIDIA RTX 3500 Ada Generation Laptop GPU | NVIDIA Quadro 2000M | ||||||||||||||||||||||||||||||||||||||||||||||||||||||||||||||||||||||||||||||||||||||||||||||||||||||||||||||||||||||||||||||||||
| Quadro M Series |
|
|
| |||||||||||||||||||||||||||||||||||||||||||||||||||||||||||||||||||||||||||||||||||||||||||||||||||||||||||||||||||||||||||||||||
| Architecture | Maxwell | Ada Lovelace | Fermi | |||||||||||||||||||||||||||||||||||||||||||||||||||||||||||||||||||||||||||||||||||||||||||||||||||||||||||||||||||||||||||||||||
| Pipelines | 2048 - unified | 5120 - unified | 192 - unified | |||||||||||||||||||||||||||||||||||||||||||||||||||||||||||||||||||||||||||||||||||||||||||||||||||||||||||||||||||||||||||||||||
| Core Speed | 1139 - 1140 (Boost) MHz | 550 MHz | ||||||||||||||||||||||||||||||||||||||||||||||||||||||||||||||||||||||||||||||||||||||||||||||||||||||||||||||||||||||||||||||||||
| Memory Speed | 6606 MHz | 16000 effective = 2000 MHz | 900 MHz | |||||||||||||||||||||||||||||||||||||||||||||||||||||||||||||||||||||||||||||||||||||||||||||||||||||||||||||||||||||||||||||||||
| Memory Bus Width | 256 Bit | 192 Bit | 128 Bit | |||||||||||||||||||||||||||||||||||||||||||||||||||||||||||||||||||||||||||||||||||||||||||||||||||||||||||||||||||||||||||||||||
| Memory Type | GDDR5 | GDDR6 | DDR3 | |||||||||||||||||||||||||||||||||||||||||||||||||||||||||||||||||||||||||||||||||||||||||||||||||||||||||||||||||||||||||||||||||
| Max. Amount of Memory | 8 GB | 12 GB | 2048 MB | |||||||||||||||||||||||||||||||||||||||||||||||||||||||||||||||||||||||||||||||||||||||||||||||||||||||||||||||||||||||||||||||||
| Shared Memory | no | no | no | |||||||||||||||||||||||||||||||||||||||||||||||||||||||||||||||||||||||||||||||||||||||||||||||||||||||||||||||||||||||||||||||||
| API | DirectX 12_1, OpenGL 4.5 | DirectX 12 Ultimate, Shader 6.7, OpenGL 4.6, OpenCL 3.0, Vulkan 1.3 | DirectX 11, Shader 5.0 | |||||||||||||||||||||||||||||||||||||||||||||||||||||||||||||||||||||||||||||||||||||||||||||||||||||||||||||||||||||||||||||||||
| Power Consumption | 150 Watt | 115 Watt (60 - 115 Watt TGP) | 55 Watt | |||||||||||||||||||||||||||||||||||||||||||||||||||||||||||||||||||||||||||||||||||||||||||||||||||||||||||||||||||||||||||||||||
| Transistors | 5.2 Billion | |||||||||||||||||||||||||||||||||||||||||||||||||||||||||||||||||||||||||||||||||||||||||||||||||||||||||||||||||||||||||||||||||||
| technology | 28 nm | 5 nm | 40 nm | |||||||||||||||||||||||||||||||||||||||||||||||||||||||||||||||||||||||||||||||||||||||||||||||||||||||||||||||||||||||||||||||||
| Features | CUDA, 3D Vision, PhysX, GeForce Experience, Surround, GameStream, GPU Boost 2.0, Adaptive Vertical Sync, G-SYNC, SLI | OpenGl 4.1, FP32 | ||||||||||||||||||||||||||||||||||||||||||||||||||||||||||||||||||||||||||||||||||||||||||||||||||||||||||||||||||||||||||||||||||
| Notebook Size | large | large | medium sized | |||||||||||||||||||||||||||||||||||||||||||||||||||||||||||||||||||||||||||||||||||||||||||||||||||||||||||||||||||||||||||||||||
| Date of Announcement | 04.04.2016 | 21.03.2023 | 22.02.2011 | |||||||||||||||||||||||||||||||||||||||||||||||||||||||||||||||||||||||||||||||||||||||||||||||||||||||||||||||||||||||||||||||||
| Raytracing Cores | 40 | |||||||||||||||||||||||||||||||||||||||||||||||||||||||||||||||||||||||||||||||||||||||||||||||||||||||||||||||||||||||||||||||||||
| Tensor / AI Cores | 160 | |||||||||||||||||||||||||||||||||||||||||||||||||||||||||||||||||||||||||||||||||||||||||||||||||||||||||||||||||||||||||||||||||||
| Theoretical Performance | 23 TFLOPS FP32 | |||||||||||||||||||||||||||||||||||||||||||||||||||||||||||||||||||||||||||||||||||||||||||||||||||||||||||||||||||||||||||||||||||
| Memory Bandwidth | 432 GB/s | |||||||||||||||||||||||||||||||||||||||||||||||||||||||||||||||||||||||||||||||||||||||||||||||||||||||||||||||||||||||||||||||||||
| PCIe | 4.0 x16 | |||||||||||||||||||||||||||||||||||||||||||||||||||||||||||||||||||||||||||||||||||||||||||||||||||||||||||||||||||||||||||||||||||
| Displays | 4 Displays (max.), HDMI 2.1, DisplayPort 1.4a | |||||||||||||||||||||||||||||||||||||||||||||||||||||||||||||||||||||||||||||||||||||||||||||||||||||||||||||||||||||||||||||||||||
| Link to Manufacturer Page | images.nvidia.com | |||||||||||||||||||||||||||||||||||||||||||||||||||||||||||||||||||||||||||||||||||||||||||||||||||||||||||||||||||||||||||||||||||
| Predecessor | RTX A3000 Laptop GPU | |||||||||||||||||||||||||||||||||||||||||||||||||||||||||||||||||||||||||||||||||||||||||||||||||||||||||||||||||||||||||||||||||||
| Codename | Fermi | |||||||||||||||||||||||||||||||||||||||||||||||||||||||||||||||||||||||||||||||||||||||||||||||||||||||||||||||||||||||||||||||||||
| Shader Speed | 1100 MHz |


