NVIDIA RTX A6000 vs Intel HD Graphics (Broadwell)
NVIDIA RTX A6000 ► remove from comparison
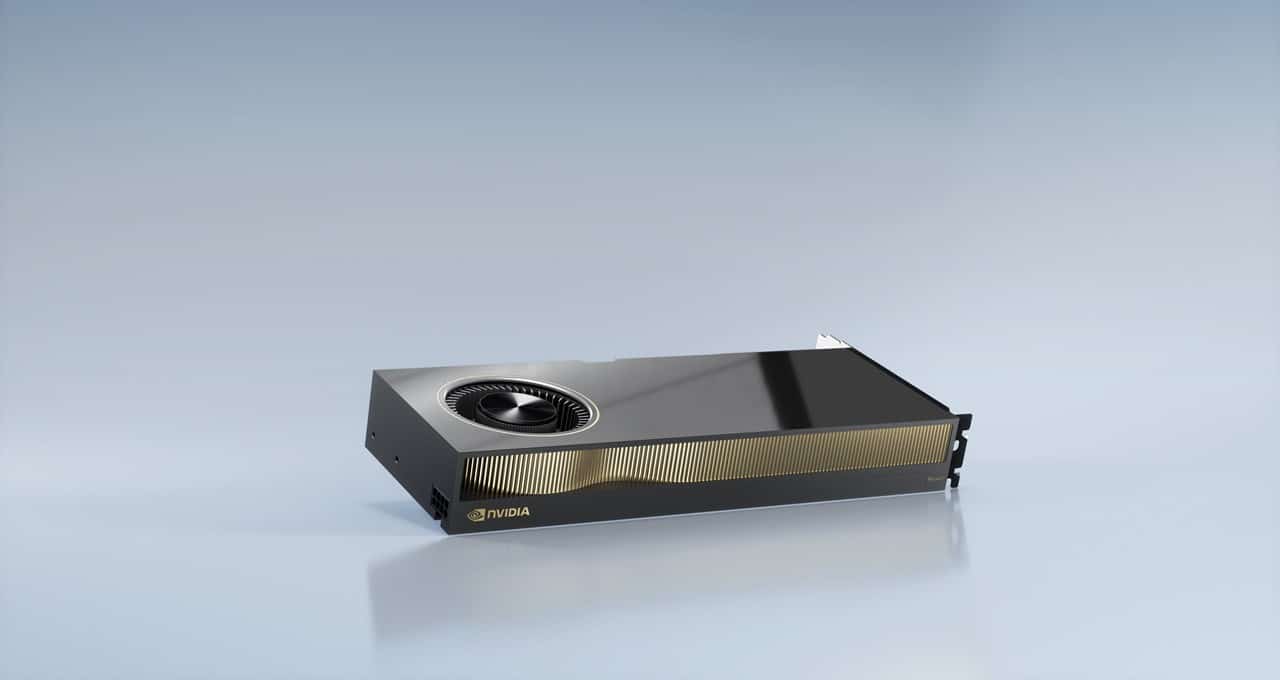
The Nvidia RTX A6000 is a professional desktop graphics card for workstation. It is based on the consumer GeForce RTX 3090 GPU and offers all 10,752 FP32 ALUs of the GA102 Ampere chip. As a formerly known Quadro card, the A6000 offers certified drivers for CAD, DCC, medical and visualization applications.
The RTX A6000 is rated at 300 Watt and is produced by Samsung in 8nm (8N).
Intel HD Graphics (Broadwell) ► remove from comparison
The Intel HD Graphics (Broadwell) (GT1) is an integrated Broadwell graphics card revealed in Q1 2015. It can be found in several low-end CPUs such as the Pentium 3805U or Celeron 3755U . The so-called GT1 GPU offers 12 EUs (Execution Units) and therefore somewhat more shader power than the previous HD Graphics (Haswell) . The clock range may depend on the specific model it is built into.
Architecture and Features
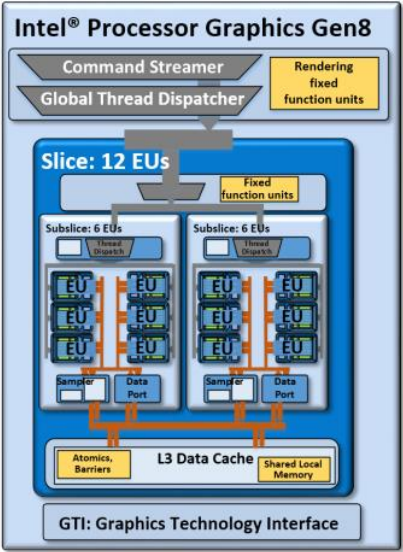
Broadwell features a GPU based on the Intel Gen8 architecture, which has been optimized in various aspects compared to the previous Gen7.5 (Haswell). In case of the GT1 version, the shader arrays called "subslice" have been reorganized and now offer 6 Execution Units (EUs) each. Two subslices form a "slice" for a total of 12 EUs. Combined with other improvements such as larger L1 caches and an optimized frontend, the integrated GPU has become faster and more efficient than its predecessor.
The HD Graphics (Broadwell) represents the low-end version of the Broadwell GPU family and consists of one slice with 12 EUs. Beyond that, there is also a mid-range variant (GT2, 24 EUs) as well as higher-end models (GT3/GT3e + eDRAM, 48 EUs).
All Broadwell GPUs support OpenCL 2.0 and DirectX 12 (FL 11_1). The video engine can now decode H.265 using both fixed function hardware as well as available GPU shaders. Up to three displays can be connected via DP 1.2/eDP 1.3 (max. 3840 x 2160 @ 60 Hz) or HDMI 1.4a (max. 3840 x 2160 @ 24 Hz). HDMI 2.0, however, is not supported.
Performance
Even though the HD Graphics (Broadwell) is clocked a bit lower, the performance should be clearly above the HD Graphics (Haswell) and similar to the HD Graphics 4000 . Nevertheless, only a few games as of 2014/2015 will run fluently at (very) low settings, e.g. Dota 2 or Sims 4.
Power Consumption
Utilizing a new 14 nm process, the HD Graphics (Broadwell) can be found in ULV models (15 W) as well as regular dual core CPUs (37 W, not yet presented). The TDP is flexible and can be further reduced, which has a significant impact on performance.
NVIDIA RTX A6000 Intel HD Graphics (Broadwell) HD Graphics Series Codename Ampere Broadwell GT1 Architecture Ampere Gen. 8 Broadwell Pipelines 10752 - unified 12 - unified Core Speed 1410 - 1800 (Boost) MHz 100 - 850 (Boost) MHz Memory Speed 16000 MHz Memory Bus Width 384 Bit 64/128 Bit Memory Type GDDR6 Max. Amount of Memory 48 GB Shared Memory no yes API DirectX 12_2, Shader 6.6, OpenGL 4.6 DirectX 12 (FL 11_1), OpenGL 4.3 Power Consumption 300 Watt Transistors 28.3 Billion technology 8 nm 14 nm Date of Announcement 05.10.2020 05.01.2015 Features QuickSync
Benchmarks Performance Rating - 3DMark 11 + Fire Strike + Time Spy - NVIDIA RTX A6000
12.5 pt (38%)
...
Intel Arc A580
...
Performance Rating - 3DMark 11 + Fire Strike + Time Spy - HD Graphics (Broadwell)
0.2 pt (1%)
...
Intel HD Graphics (Broadwell)
...
3DMark - 3DMark Time Spy Score
10571 Points (30%)
3DMark - 3DMark Time Spy Graphics
10490 Points (28%)
3DMark - 3DMark Ice Storm Unlimited Graphics
494750 Points (56%)
3DMark - 3DMark Ice Storm Extreme Graphics
437588 Points (56%)
3DMark - 3DMark Cloud Gate Score
45676 Points (49%)
3398 Points (4%)
GPU TDP ? TDP 300 W 7% 100%
3DMark - 3DMark Cloud Gate Graphics
113167 Points (30%)
4015 Points (1%)
GPU TDP ? TDP 300 W 4% 100%
3DMark - 3DMark Fire Strike Standard Score
25280 Points (45%)
428 Points (1%)
GPU TDP ? TDP 300 W 2% 100%
3DMark - 3DMark Fire Strike Standard Graphics
27511 Points (31%)
463 Points (1%)
GPU TDP ? TDP 300 W 2% 100%
3DMark - 3DMark Ice Storm Graphics
484825 Points (58%)
45539 Points (5%)
GPU TDP ? TDP 300 W 9% 100%
3DMark 11 - 3DM11 Performance Score
34321 Points (48%)
729 Points (1%)
GPU TDP ? TDP 300 W 2% 100%
3DMark 11 - 3DM11 Performance GPU
50957 Points (44%)
641 Points (1%)
GPU TDP ? TDP 300 W 1% 100%
3DMark Vantage + NVIDIA RTX A6000 3DMark Vantage - 3DM Vant. Perf. total
89510 Points (26%)
3DM Vant. Perf. total + Intel HD Graphics (Broadwell)
2651 Points (1%)
GPU TDP ? TDP 300 W 3% 100%
3DM Vant. Perf. GPU no PhysX + NVIDIA RTX A6000 3DMark Vantage - 3DM Vant. Perf. GPU no PhysX
100651 Points (57%)
3DM Vant. Perf. GPU no PhysX + Intel HD Graphics (Broadwell)
2196 Points (1%)
GPU TDP ? TDP 300 W 2% 100%
3DMark 06 3DMark 06 - Standard 1280x1024 + NVIDIA RTX A6000
41016 Points (54%)
3DMark 06 - Standard 1280x1024 + Intel HD Graphics (Broadwell)
5077 Points (7%)
GPU TDP ? TDP 300 W 12% 100%
Unigine Heaven 2.1 - Heaven 2.1 high
10.9 fps (2%)
SPECviewperf 12 + NVIDIA RTX A6000 SPECviewperf 12 - specvp12 sw-03
225 fps (56%)
specvp12 snx-02 + NVIDIA RTX A6000 SPECviewperf 12 - specvp12 snx-02
351 fps (52%)
specvp12 showcase-01 + NVIDIA RTX A6000 SPECviewperf 12 - specvp12 showcase-01
255 fps (56%)
specvp12 mediacal-01 + NVIDIA RTX A6000 SPECviewperf 12 - specvp12 mediacal-01
159 fps (41%)
specvp12 maya-04 + NVIDIA RTX A6000 SPECviewperf 12 - specvp12 maya-04
144 fps (39%)
specvp12 energy-01 + NVIDIA RTX A6000 SPECviewperf 12 - specvp12 energy-01
39.8 fps (36%)
specvp12 creo-01 + NVIDIA RTX A6000 SPECviewperf 12 - specvp12 creo-01
136 fps (54%)
specvp12 catia-04 + NVIDIA RTX A6000 SPECviewperf 12 - specvp12 catia-04
229 fps (38%)
specvp12 3dsmax-05 + NVIDIA RTX A6000 SPECviewperf 12 - specvp12 3dsmax-05
336 fps (59%)
SPECviewperf 13 specvp13 sw-04 + NVIDIA RTX A6000 SPECviewperf 13 - specvp13 sw-04
192 fps (51%)
specvp13 snx-03 + NVIDIA RTX A6000 SPECviewperf 13 - specvp13 snx-03
638 fps (71%)
specvp13 showcase-02 + NVIDIA RTX A6000 SPECviewperf 13 - specvp13 showcase-02
255 fps (56%)
specvp13 medical-02 + NVIDIA RTX A6000 SPECviewperf 13 - specvp13 medical-02
184 fps (38%)
specvp13 maya-05 + NVIDIA RTX A6000 SPECviewperf 13 - specvp13 maya-05
415 fps (47%)
specvp13 energy-02 + NVIDIA RTX A6000 SPECviewperf 13 - specvp13 energy-02
132 fps (43%)
specvp13 creo-02 + NVIDIA RTX A6000 SPECviewperf 13 - specvp13 creo-02
366 fps (54%)
specvp13 catia-05 + NVIDIA RTX A6000 SPECviewperf 13 - specvp13 catia-05
371 fps (41%)
specvp13 3dsmax-06 + NVIDIA RTX A6000 SPECviewperf 13 - specvp13 3dsmax-06
338 fps (59%)
SPECviewperf 2020 specvp2020 solidworks-07 1080p + NVIDIA RTX A6000 SPECviewperf 2020 - specvp2020 solidworks-07 1080p
373 fps (100%)
specvp2020 snx-04 1080p + NVIDIA RTX A6000 SPECviewperf 2020 - specvp2020 snx-04 1080p
613 fps (100%)
specvp2020 medical-03 1080p + NVIDIA RTX A6000 SPECviewperf 2020 - specvp2020 medical-03 1080p
92 fps (65%)
specvp2020 maya-06 1080p + NVIDIA RTX A6000 SPECviewperf 2020 - specvp2020 maya-06 1080p
573 fps (83%)
specvp2020 energy-03 1080p + NVIDIA RTX A6000 SPECviewperf 2020 - specvp2020 energy-03 1080p
124 fps (100%)
specvp2020 creo-03 1080p + NVIDIA RTX A6000 SPECviewperf 2020 - specvp2020 creo-03 1080p
203 fps (100%)
specvp2020 catia-06 1080p + NVIDIA RTX A6000 SPECviewperf 2020 - specvp2020 catia-06 1080p
155 fps (100%)
specvp2020 3dsmax-07 1080p + NVIDIA RTX A6000 SPECviewperf 2020 - specvp2020 3dsmax-07 1080p
206 fps (93%)
specvp2020 solidworks-05 4k + NVIDIA RTX A6000 SPECviewperf 2020 - specvp2020 solidworks-05 4k
169 fps (50%)
specvp2020 snx-04 4k + NVIDIA RTX A6000 SPECviewperf 2020 - specvp2020 snx-04 4k
481 fps (49%)
specvp2020 medical-03 4k + NVIDIA RTX A6000 SPECviewperf 2020 - specvp2020 medical-03 4k
37.9 fps (36%)
specvp2020 maya-06 4k + NVIDIA RTX A6000 SPECviewperf 2020 - specvp2020 maya-06 4k
329 fps (54%)
specvp2020 energy-03 4k + NVIDIA RTX A6000 SPECviewperf 2020 - specvp2020 energy-03 4k
63 fps (14%)
specvp2020 creo-03 4k + NVIDIA RTX A6000 SPECviewperf 2020 - specvp2020 creo-03 4k
111 fps (53%)
specvp2020 catia-06 4k + NVIDIA RTX A6000 SPECviewperf 2020 - specvp2020 catia-06 4k
82.4 fps (54%)
specvp2020 3dsmax-07 4k + NVIDIA RTX A6000 SPECviewperf 2020 - specvp2020 3dsmax-07 4k
137 fps (57%)
Cinebench R10 Cinebench R10 Shading (32bit) + Intel HD Graphics (Broadwell) Cinebench R10 - Cinebench R10 Shading (32bit)
4886 Points (3%)
Cinebench R11.5 Cinebench R11.5 OpenGL 64 Bit + Intel HD Graphics (Broadwell) Cinebench R11.5 - Cinebench R11.5 OpenGL 64 Bit
12.8 fps (4%)
Cinebench R15 + Intel HD Graphics (Broadwell) Cinebench R15 - Cinebench R15 OpenGL 64 Bit
17.8 fps (1%)
Cinebench R15 OpenGL Ref. Match 64 Bit + Intel HD Graphics (Broadwell) Cinebench R15 - Cinebench R15 OpenGL Ref. Match 64 Bit
98 % (98%)
GFXBench 3.1 - GFXBench Manhattan ES 3.1 Offscreen
17.4 fps (0%)
GFXBench 3.0 - GFXBench 3.0 Manhattan Offscreen
21.5 fps (1%)
GFXBench (DX / GLBenchmark) 2.7 + Intel HD Graphics (Broadwell) GFXBench (DX / GLBenchmark) 2.7 - GFXBench T-Rex HD Offscreen C24Z16
47.1 fps (0%)
LuxMark v2.0 64Bit - LuxMark v2.0 Room GPU
5504 Samples/s (25%)
86 Samples/s (0%)
GPU TDP ? TDP 300 W 2% 100%
LuxMark v2.0 64Bit - LuxMark v2.0 Sala GPU
14363 Samples/s (25%)
182 Samples/s (0%)
GPU TDP ? TDP 300 W 1% 100%
ComputeMark v2.1 - ComputeMark v2.1 Result
47668 Points (52%)
374 Points (0%)
GPU TDP ? TDP 300 W 1% 100%
Average Benchmarks NVIDIA RTX A6000 → 100% n=13 Average Benchmarks Intel HD Graphics (Broadwell) → 4% n=13
- Range of benchmark values for this graphics card
- Average benchmark values for this graphics card
* Smaller numbers mean a higher performance
1 This benchmark is not used for the average calculation
Game Benchmarks The following benchmarks stem from our benchmarks of review laptops. The performance depends on the used graphics memory, clock rate, processor, system settings, drivers, and operating systems. So the results don't have to be representative for all laptops with this GPU. For detailed information on the benchmark results, click on the fps number.
100%
NVIDIA RTX A6000:
333 [X] 824817
AMD Ryzen Threadripper PRO 3975WX 3.5GHz
NVIDIA RTX A6000
min:
243 fps, P1:
229 fps, max:
366 fps
fps
100%
NVIDIA RTX A6000:
313 [X] 824817
AMD Ryzen Threadripper PRO 3975WX 3.5GHz
NVIDIA RTX A6000
min:
231 fps, P1:
214 fps, max:
352 fps
fps
100%
NVIDIA RTX A6000:
281 [X] 824817
AMD Ryzen Threadripper PRO 3975WX 3.5GHz
NVIDIA RTX A6000
min:
204 fps, P1:
162 fps, max:
328 fps
fps
100%
NVIDIA RTX A6000:
162 [X] 824817
AMD Ryzen Threadripper PRO 3975WX 3.5GHz
NVIDIA RTX A6000
min:
138 fps, P1:
131 fps, max:
174 fps
fps
100%
NVIDIA RTX A6000:
155 [X] 824817
AMD Ryzen Threadripper PRO 3975WX 3.5GHz
NVIDIA RTX A6000
min:
131 fps, P1:
120 fps, max:
164 fps
fps
100%
NVIDIA RTX A6000:
99.7 [X] 824817
AMD Ryzen Threadripper PRO 3975WX 3.5GHz
NVIDIA RTX A6000
min:
85 fps, P1:
85 fps, max:
112 fps
fps
100%
NVIDIA RTX A6000:
278 [X] 759689
AMD Ryzen Threadripper PRO 3975WX 3.5GHz
NVIDIA RTX A6000
min:
229 fps, max:
303 fps
fps
100%
NVIDIA RTX A6000:
248 [X] 759689
AMD Ryzen Threadripper PRO 3975WX 3.5GHz
NVIDIA RTX A6000
min:
204 fps, max:
281 fps
fps
100%
NVIDIA RTX A6000:
241 [X] 759689
AMD Ryzen Threadripper PRO 3975WX 3.5GHz
NVIDIA RTX A6000
min:
197 fps, max:
270 fps
fps
100%
NVIDIA RTX A6000:
224 [X] 759689
AMD Ryzen Threadripper PRO 3975WX 3.5GHz
NVIDIA RTX A6000
min:
174 fps, max:
260 fps
fps
100%
NVIDIA RTX A6000:
210 [X] 759689
AMD Ryzen Threadripper PRO 3975WX 3.5GHz
NVIDIA RTX A6000
min:
172 fps, max:
251 fps
fps
100%
NVIDIA RTX A6000:
137 [X] 759689
AMD Ryzen Threadripper PRO 3975WX 3.5GHz
NVIDIA RTX A6000
min:
113 fps, max:
161 fps
fps
100%
NVIDIA RTX A6000:
71 [X] AMD Ryzen Threadripper PRO 3975WX 3.5GHz
NVIDIA RTX A6000
min:
39 fps, max:
109 fps
fps
100%
NVIDIA RTX A6000:
66 [X] AMD Ryzen Threadripper PRO 3975WX 3.5GHz
NVIDIA RTX A6000
min:
43 fps, max:
94 fps
fps
100%
NVIDIA RTX A6000:
68 [X] AMD Ryzen Threadripper PRO 3975WX 3.5GHz
NVIDIA RTX A6000
min:
49 fps, max:
95 fps
fps
100%
NVIDIA RTX A6000:
65 [X] AMD Ryzen Threadripper PRO 3975WX 3.5GHz
NVIDIA RTX A6000
min:
43 fps, max:
100 fps
fps
100%
NVIDIA RTX A6000:
63 [X] AMD Ryzen Threadripper PRO 3975WX 3.5GHz
NVIDIA RTX A6000
min:
41 fps, max:
91 fps
fps
100%
NVIDIA RTX A6000:
63 [X] AMD Ryzen Threadripper PRO 3975WX 3.5GHz
NVIDIA RTX A6000
min:
45 fps, max:
91 fps
fps
100%
NVIDIA RTX A6000:
120 [X] AMD Ryzen Threadripper PRO 3975WX 3.5GHz
NVIDIA RTX A6000
min:
72.04 fps, max:
204.16 fps
fps
100%
NVIDIA RTX A6000:
109 [X] AMD Ryzen Threadripper PRO 3975WX 3.5GHz
NVIDIA RTX A6000
min:
66.11 fps, max:
180.12 fps
fps
100%
NVIDIA RTX A6000:
96.8 [X] AMD Ryzen Threadripper PRO 3975WX 3.5GHz
NVIDIA RTX A6000
min:
61.05 fps, max:
153.82 fps
fps
100%
NVIDIA RTX A6000:
87.9 [X] AMD Ryzen Threadripper PRO 3975WX 3.5GHz
NVIDIA RTX A6000
min:
56.88 fps, max:
138.26 fps
fps
100%
NVIDIA RTX A6000:
84.1 [X] AMD Ryzen Threadripper PRO 3975WX 3.5GHz
NVIDIA RTX A6000
min:
56.91 fps, max:
128.44 fps
fps
100%
NVIDIA RTX A6000:
70.4 [X] AMD Ryzen Threadripper PRO 3975WX 3.5GHz
NVIDIA RTX A6000
min:
45.27 fps, max:
104.78 fps
fps
100%
NVIDIA RTX A6000:
382 [X] 1.47.22.14 D3D12
AMD Ryzen Threadripper PRO 3975WX 3.5GHz
NVIDIA RTX A6000
min:
110 fps, P1:
288 fps, max:
553 fps
fps
100%
NVIDIA RTX A6000:
300 [X] 1.47.22.14 D3D12
AMD Ryzen Threadripper PRO 3975WX 3.5GHz
NVIDIA RTX A6000
min:
82.1 fps, P1:
220 fps, max:
471 fps
fps
100%
NVIDIA RTX A6000:
293 [X] 1.47.22.14 D3D12
AMD Ryzen Threadripper PRO 3975WX 3.5GHz
NVIDIA RTX A6000
min:
73.9 fps, P1:
217 fps, max:
456 fps
fps
100%
NVIDIA RTX A6000:
288 [X] 1.47.22.14 D3D12
AMD Ryzen Threadripper PRO 3975WX 3.5GHz
NVIDIA RTX A6000
min:
90.3 fps, P1:
211 fps, max:
431 fps
fps
100%
NVIDIA RTX A6000:
247 [X] 1.47.22.14 D3D12
AMD Ryzen Threadripper PRO 3975WX 3.5GHz
NVIDIA RTX A6000
min:
42.8 fps, P1:
195 fps, max:
361 fps
fps
100%
NVIDIA RTX A6000:
149 [X] 1.47.22.14 D3D12
AMD Ryzen Threadripper PRO 3975WX 3.5GHz
NVIDIA RTX A6000
min:
55.1 fps, P1:
127 fps, max:
206 fps
fps
100%
NVIDIA RTX A6000:
55 [X] AMD Ryzen Threadripper PRO 3975WX 3.5GHz
NVIDIA RTX A6000
min:
40 fps, max:
81 fps
fps
100%
NVIDIA RTX A6000:
52 [X] AMD Ryzen Threadripper PRO 3975WX 3.5GHz
NVIDIA RTX A6000
min:
34 fps, max:
78 fps
fps
100%
NVIDIA RTX A6000:
53 [X] AMD Ryzen Threadripper PRO 3975WX 3.5GHz
NVIDIA RTX A6000
min:
36 fps, max:
78 fps
fps
100%
NVIDIA RTX A6000:
52 [X] AMD Ryzen Threadripper PRO 3975WX 3.5GHz
NVIDIA RTX A6000
min:
37 fps, max:
75 fps
fps
100%
NVIDIA RTX A6000:
52 [X] AMD Ryzen Threadripper PRO 3975WX 3.5GHz
NVIDIA RTX A6000
min:
38 fps, max:
70 fps
fps
100%
NVIDIA RTX A6000:
50 [X] AMD Ryzen Threadripper PRO 3975WX 3.5GHz
NVIDIA RTX A6000
min:
35 fps, max:
70 fps
fps
100%
NVIDIA RTX A6000:
109 [X] AMD Ryzen Threadripper PRO 3975WX 3.5GHz
NVIDIA RTX A6000
fps
100%
NVIDIA RTX A6000:
97 [X] AMD Ryzen Threadripper PRO 3975WX 3.5GHz
NVIDIA RTX A6000
fps
100%
NVIDIA RTX A6000:
78.1 [X] AMD Ryzen Threadripper PRO 3975WX 3.5GHz
NVIDIA RTX A6000
fps
100%
NVIDIA RTX A6000:
67.2 [X] AMD Ryzen Threadripper PRO 3975WX 3.5GHz
NVIDIA RTX A6000
fps
100%
NVIDIA RTX A6000:
176 [X] 1.3
AMD Ryzen Threadripper PRO 3975WX 3.5GHz
NVIDIA RTX A6000
fps
100%
NVIDIA RTX A6000:
168 [X] 1.3
AMD Ryzen Threadripper PRO 3975WX 3.5GHz
NVIDIA RTX A6000
fps
100%
NVIDIA RTX A6000:
135 [X] 1.3
AMD Ryzen Threadripper PRO 3975WX 3.5GHz
NVIDIA RTX A6000
fps
100%
NVIDIA RTX A6000:
127 [X] 1.3
AMD Ryzen Threadripper PRO 3975WX 3.5GHz
NVIDIA RTX A6000
fps
100%
NVIDIA RTX A6000:
82.4 [X] 1.3
AMD Ryzen Threadripper PRO 3975WX 3.5GHz
NVIDIA RTX A6000
fps
HD Graphics (Broadwell):
15.3 fps
HD Graphics (Broadwell):
8.5 fps
HD Graphics (Broadwell):
38.1 fps
HD Graphics (Broadwell):
20.6 fps
HD Graphics (Broadwell):
29 fps
HD Graphics (Broadwell):
20.8 fps
100%
NVIDIA RTX A6000:
160.5 [X] AMD Ryzen Threadripper PRO 3975WX 3.5GHz
NVIDIA RTX A6000
min:
140.7 fps, max:
-1 fps
fps
100%
NVIDIA RTX A6000:
144.8 [X] AMD Ryzen Threadripper PRO 3975WX 3.5GHz
NVIDIA RTX A6000
min:
126.6 fps, max:
-1 fps
fps
100%
NVIDIA RTX A6000:
138.7 [X] AMD Ryzen Threadripper PRO 3975WX 3.5GHz
NVIDIA RTX A6000
min:
121 fps, max:
-1 fps
fps
100%
NVIDIA RTX A6000:
131.2 [X] AMD Ryzen Threadripper PRO 3975WX 3.5GHz
NVIDIA RTX A6000
min:
113.8 fps, max:
-1 fps
fps
100%
NVIDIA RTX A6000:
127.9 [X] AMD Ryzen Threadripper PRO 3975WX 3.5GHz
NVIDIA RTX A6000
min:
109.8 fps, max:
-1 fps
fps
100%
NVIDIA RTX A6000:
362 [X] AMD Ryzen Threadripper PRO 3975WX 3.5GHz
NVIDIA RTX A6000
min:
71.7 fps, P0.1:
217 fps, P1:
274 fps, max:
511 fps
fps
100%
NVIDIA RTX A6000:
334 [X] AMD Ryzen Threadripper PRO 3975WX 3.5GHz
NVIDIA RTX A6000
min:
71.4 fps, P0.1:
186 fps, P1:
258 fps, max:
460 fps
fps
100%
NVIDIA RTX A6000:
307 [X] AMD Ryzen Threadripper PRO 3975WX 3.5GHz
NVIDIA RTX A6000
min:
58.5 fps, P0.1:
134 fps, P1:
234 fps, max:
470 fps
fps
100%
NVIDIA RTX A6000:
180 [X] AMD Ryzen Threadripper PRO 3975WX 3.5GHz
NVIDIA RTX A6000
min:
53.5 fps, P0.1:
82.7 fps, P1:
131 fps, max:
294 fps
fps
100%
NVIDIA RTX A6000:
146 [X] AMD Ryzen Threadripper PRO 3975WX 3.5GHz
NVIDIA RTX A6000
min:
65.4 fps, P0.1:
78.1 fps, P1:
117 fps, max:
396 fps
fps
HD Graphics (Broadwell):
50 fps
HD Graphics (Broadwell):
13.5 fps
100%
NVIDIA RTX A6000:
177 [X] AMD Ryzen Threadripper PRO 3975WX 3.5GHz
NVIDIA RTX A6000
min:
3.05 fps, P1:
125 fps, max:
279 fps
fps
100%
NVIDIA RTX A6000:
171 [X] AMD Ryzen Threadripper PRO 3975WX 3.5GHz
NVIDIA RTX A6000
min:
5.02 fps, P1:
125 fps, max:
276 fps
fps
100%
NVIDIA RTX A6000:
160 [X] AMD Ryzen Threadripper PRO 3975WX 3.5GHz
NVIDIA RTX A6000
min:
4.38 fps, P1:
111 fps, max:
237 fps
fps
100%
NVIDIA RTX A6000:
96.2 [X] AMD Ryzen Threadripper PRO 3975WX 3.5GHz
NVIDIA RTX A6000
min:
7.5 fps, P1:
71.4 fps, max:
160 fps
fps
100%
NVIDIA RTX A6000:
95.8 [X] AMD Ryzen Threadripper PRO 3975WX 3.5GHz
NVIDIA RTX A6000
min:
5.51 fps, P1:
71.4 fps, max:
155 fps
fps
100%
NVIDIA RTX A6000:
155 [X] AMD Ryzen Threadripper PRO 3975WX 3.5GHz
NVIDIA RTX A6000
min:
3.76 fps, P1:
100 fps, max:
267 fps
fps
HD Graphics (Broadwell):
23.9 fps
HD Graphics (Broadwell):
16.4 fps
HD Graphics (Broadwell):
13.9 fps
HD Graphics (Broadwell):
9.4 fps
HD Graphics (Broadwell):
34 fps
HD Graphics (Broadwell):
24 fps
HD Graphics (Broadwell):
113.6 fps
HD Graphics (Broadwell):
26.3 fps
HD Graphics (Broadwell):
57.6 fps
HD Graphics (Broadwell):
22.6 fps
HD Graphics (Broadwell):
13.7 fps
HD Graphics (Broadwell):
10.7 fps
HD Graphics (Broadwell):
7 fps
HD Graphics (Broadwell):
25.3 fps
HD Graphics (Broadwell):
14.1 fps
HD Graphics (Broadwell):
11.7 fps
HD Graphics (Broadwell):
34.7 fps
HD Graphics (Broadwell):
17.7 fps
HD Graphics (Broadwell):
11.7 fps
HD Graphics (Broadwell):
15.6 fps
HD Graphics (Broadwell):
11.4 fps
HD Graphics (Broadwell):
5.3 fps
HD Graphics (Broadwell):
43.7 fps
HD Graphics (Broadwell):
31.5 fps
HD Graphics (Broadwell):
23.9 fps
HD Graphics (Broadwell):
38.4 fps
HD Graphics (Broadwell):
24.9 fps
HD Graphics (Broadwell):
19.7 fps
Average Gaming NVIDIA RTX A6000 → 100% Average Gaming 30-70 fps → 100%
NVIDIA RTX A6000 low med. high ultra QHD 4K F1 2021 333 313 281 162 155 99.7 F1 2020 278 248 241 224 210 137 Far Cry New Dawn 71 66 68 65 63 63 Metro Exodus 120 109 96.8 87.9 84.1 70.4 Strange Brigade 382 300 293 288 247 149 Far Cry 5 55 52 53 52 52 50 X-Plane 11.11 109 97 78.1 67.2 Final Fantasy XV Benchmark 176 168 135 127 82.4 Dota 2 Reborn 160.5 144.8 138.7 131.2 127.9 The Witcher 3 362 334 307 180 146 GTA V 177 171 160 96.2 95.8 155 < 30 fps < 60 fps < 120 fps ≥ 120 fps 1 2 8 1 3 7 1 3 7 1 3 5 1 3 4 1 5 5
Intel HD Graphics (Broadwell) low med. high ultra QHD 4K Star Wars Battlefront 15.3 8.5 FIFA 16 38.1 20.6 World of Warships 29 20.8 Dirt Rally 50 13.5 Battlefield Hardline 23.9 16.4 Dragon Age: Inquisition 13.9 9.4 F1 2014 34 24 Sims 4 113.6 26.3 GRID: Autosport 57.6 22.6 Metro: Last Light 13.7 10.7 7 BioShock Infinite 25.3 14.1 11.7 Tomb Raider 34.7 17.7 11.7 Hitman: Absolution 15.6 11.4 5.3 Counter-Strike: GO 43.7 31.5 23.9 Diablo III 38.4 24.9 19.7 < 30 fps < 60 fps < 120 fps ≥ 120 fps 7 7 1 13 1 7
For more games that might be playable and a list of all games and graphics cards visit our Gaming List
v1.28
log 29. 19:21:21
#0 checking url part for id 11097 +0s ... 0s
#1 checking url part for id 5979 +0s ... 0s
#2 redirected to Ajax server, took 1719681681 +0s ... 0s
#3 did not recreate cache, as it is less than 5 days old! Created at Fri, 28 Jun 2024 05:15:43 +0200 +0s ... 0s
#4 composed specs +0.028s ... 0.028s
#5 did output specs +0s ... 0.028s
#6 start showIntegratedCPUs +0s ... 0.028s
#7 getting avg benchmarks for device 11097 +0.022s ... 0.05s
#8 got single benchmarks 11097 +0.004s ... 0.055s
#9 getting avg benchmarks for device 5979 +0.004s ... 0.059s
#10 got single benchmarks 5979 +0.006s ... 0.065s
#11 got avg benchmarks for devices +0s ... 0.065s
#12 min, max, avg, median took s +0.034s ... 0.099s
#13 before gaming benchmark output +0s ... 0.099s
#14 Got 97 rows for game benchmarks. +0.006s ... 0.105s
#15 composed SQL query for gamebenchmarks +0s ... 0.105s
#16 got data and put it in $dataArray +0.001s ... 0.106s
#17 benchmarks composed for output. +0.009s ... 0.115s
#18 calculated avg scores. +0s ... 0.115s
#19 return log +0.002s ... 0.117s
Please share our article, every link counts!
Redaktion, 2017-09- 8 (Update: 2023-07- 1)
 Deutsch
 English
 Español
 Français
 Italiano
 Nederlands
 Polski
 Português
 Русский
 Türkçe
 Svenska
 Chinese
 Magyar