NVIDIA RTX 4000 Ada Generation Laptop GPU vs Intel UHD Graphics 24EUs (Alder Lake-N)
NVIDIA RTX 4000 Ada Generation Laptop GPU ► remove from comparison
The Nvidia RTX 4000 Ada Generation , not to be confused with the A4000 , P4000 or RTX 4000 Turing Generation , is a very powerful professional graphics card for use in laptops that sports 7,424 CUDA cores and 12 GB of ECC GDDR6 VRAM. Brought into existence in 2023, this graphics adapter leverages TSMC's 5 nm process and Nvidia's Ada Lovelace architecture to achieve great performance combined with moderate power consumption. The Nvidia-recommended TGP range for the card is very wide at 60 W to 175 W leading to bizarre performance differences between different systems powered by what is supposed to be the same product.
Hardware-wise, the RTX 4000 is a GeForce RTX 4080 Laptop in disguise. Consequently, both make use of the AD103 chip and have little difficulty running triple-A games at QHD 1440p.
Quadro series graphics cards ship with much different BIOS and drivers than GeForce cards and are targeted at professional users rather than gamers. Commercial product design, large-scale calculations, simulation, data mining, 24 x 7 operation - if any of this sounds familiar, then a Quadro card will make you happy.
Architecture and Features
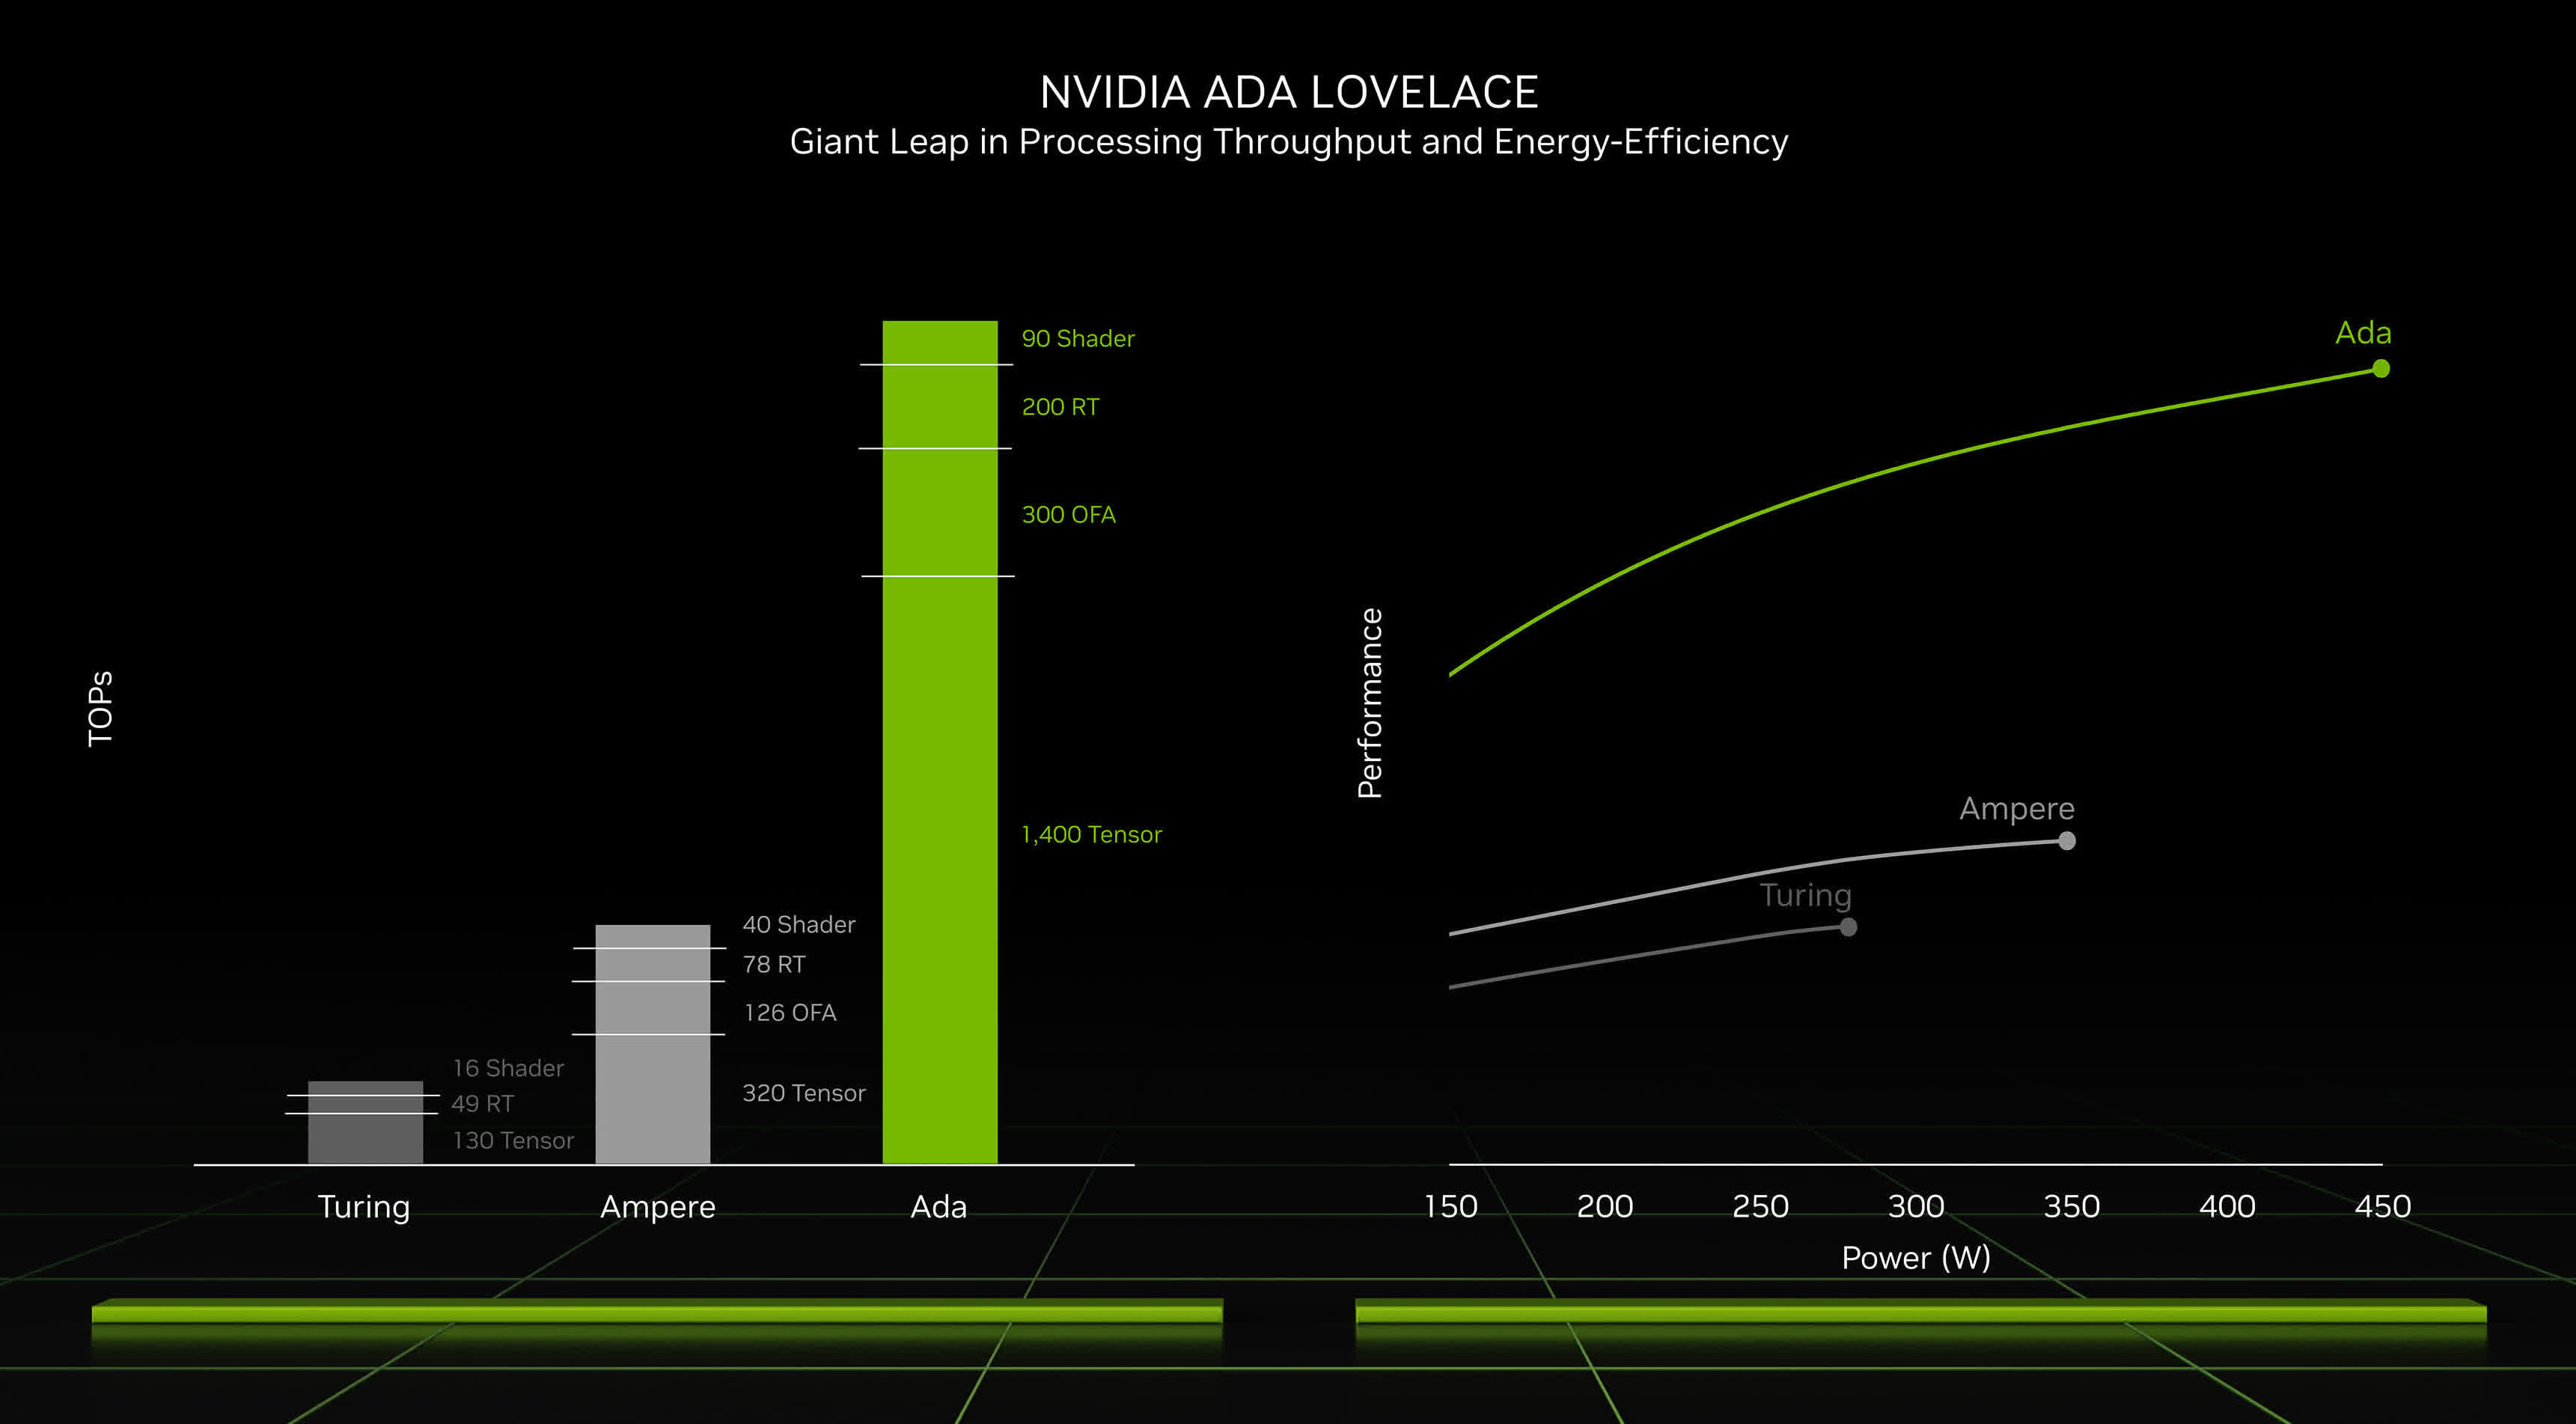
Ada Lovelace brings a range of improvements over older graphics cards utilizing the outgoing Ampere architecture. It's not just a better manufacturing process and a higher number of CUDA cores that we have here (up to 16,384 versus 10,752); under-the-hood refinements are plentiful, including an immensely larger L2 cache and an optimized ray tracing routine (a different way to determine what is transparent and what isn't is used) and other changes. Naturally, these graphics cards can both encode and decode some of the most widely used video codecs, AVC, HEVC and AV1 included; they also support a host of Nvidia technologies, including Optimus and DLSS 3, and they can certainly be used for various AI tasks.
The RTX 4000 features 58 RT cores of the 3rd generation, 232 Tensor cores of the 4th generation and 7,424 CUDA cores, making it a lot faster than the RTX 3500 Ada Generation . Elsewhere, the graphics card comes with 12 GB of 192-bit wide ECC GDDR6 memory for a very healthy throughput of ~432 GB/s. Error correction can be turned off if desired. The fact that error correction is present here proves that the RTX 4000 is indeed targeted at professional users.
Just like Ampere-based cards, the RTX 4000 makes use of the PCI-Express 4 protocol. 8K SUHD monitors are supported, however DP 1.4a video outputs can potentially prove to be a bottleneck down the line.
Performance
While we have not tested a single system featuring an RTX 4000 Ada Generation as of February 2024, we have plenty of performance data for the GeForce RTX 4080 Laptop , a graphics card with very similar specifications. Based on that, we fully expect the RTX 4000 to deliver:
a Blender 3.3 Classroom CUDA score of around 23 seconds a 3DMark 11 GPU score of around 57,000 at least 115 fps in GTA V close to 50 fps in Cyberpunk 2077 Nvidia's marketing materials mention "up to 33.5 TFLOPS" of performance which is impressive. The RTX 5000 Ada Generation delivers a little over 42 TFLOPS, for reference.
Your mileage may vary depending on how competent the cooling solution of your laptop is and how high the TGP power target of the RTX 4000 is. One other thing worth mentioning is that enabling error correction appears to reduce the amount of video memory that is available to applications and games by up to a gigabyte.
Power consumption
Nvidia no longer divides its laptop graphics cards into Max-Q and non-max-Q models. Instead, laptop makers are free to set the TGP according to their needs, and the range can sometimes be shockingly wide. This is the case with the RTX 4000, as the lowest value recommended for it sits at just 60 W while the highest is more than two times higher at 175 W (this most likely includes Dynamic Boost). The slowest system built around an RTX 4000 Ada can easily be 60% slower than the fastest one. This is the kind of delta that we've already seen on consumer-grade laptops featuring the latest GeForce RTX cards.
Last but not the least, the improved 5 nm process (TSMC 4N) the RTX 4000 Ada is built with makes for very decent energy efficiency, as of mid 2023.
Intel UHD Graphics 24EUs (Alder Lake-N) ► remove from comparison
The Intel UHD Graphics 24EUs (Xe-LP, Alder Lake-N, Gen 12.2) is a integrated graphics card in the mid range Alder Lake-N models like the Intel Processor N100 . It is using the current Xe-LP architecture (Gen12) and was announced in late 2022. The GPU uses 24 of the 32 EUs (execution units) in the chip (192 of the 256 shader cores).
The performance is severely hindered by the single channel memory controller of Alder Lake-N, the low CPU performance and relatively low shader count. Therefore, only very low demanding games like Dota 2 in lowest settings can be played with the UHD Graphics GPU.
The whole SoC is manufactured in 10nm (Intel 7 process) at Intel.
NVIDIA RTX 4000 Ada Generation Laptop GPU Intel UHD Graphics 24EUs (Alder Lake-N) Gen. 12 / Xe Series Architecture Ada Lovelace Gen. 12 Pipelines 7424 - unified 24 - unified Raytracing Cores 58 Tensor / AI Cores 232 Theoretical Performance 33.6 TFLOPS FP32 Memory Speed 16000 effective = 2000 MHz Memory Bus Width 192 Bit Memory Type GDDR6 Max. Amount of Memory 12 GB Shared Memory no yes Memory Bandwidth 432 GB/s API DirectX 12 Ultimate, Shader 6.7, OpenGL 4.6, OpenCL 3.0, Vulkan 1.3 DirectX 12_1, OpenGL 4.6 Power Consumption 150 Watt (60 - 150 Watt TGP) technology 5 nm 10 nm PCIe 4.0 x16 Displays 4 Displays (max.), HDMI 2.1, DisplayPort 1.4a Notebook Size large Date of Announcement 21.03.2023 03.01.2023 Link to Manufacturer Page images.nvidia.com Predecessor RTX A3000 Laptop GPU Codename Alder Lake Xe Core Speed 450 - 750 (Boost) MHz Features QuickSync
CPU in UHD Graphics 24EUs (Alder Lake-N) GPU Base Speed GPU Boost / Turbo Intel Processor N97 4 x ? MHz, 12 W ? MHz 1200 MHz Intel Processor N100 4 x 1000 MHz, 6 W ? MHz 750 MHz min. - max. ? MHz 750 - 1200 MHz
Benchmarks Performance Rating - 3DMark 11 + Fire Strike + Time Spy - UHD Graphics 24EUs (Alder Lake-N)
0.5 pt (2%)
...
Intel UHD Graphics 24EUs (Alder Lake-N)
...
max:
3DMark - 3DMark Time Spy Score
min: 345 avg: 377.9 median: 364 (1%) max: 538 Points
3DMark - 3DMark Time Spy Graphics
min: 304 avg: 331.1 median: 320 (1%) max: 473 Points
3DMark - 3DMark Ice Storm Unlimited Graphics
min: 54707 avg: 57907 median: 55681 (6%) max: 79785 Points
3DMark - 3DMark Ice Storm Extreme Graphics
min: 21251 avg: 30932 median: 30479.5 (4%) max: 41235 Points
3DMark - 3DMark Cloud Gate Score
min: 6007 avg: 6805 median: 6751 (7%) max: 8596 Points
3DMark - 3DMark Cloud Gate Graphics
min: 7218 avg: 8532 median: 8303.5 (2%) max: 11498 Points
3DMark - 3DMark Fire Strike Standard Score
min: 1009 avg: 1140 median: 1127 (2%) max: 1512 Points
3DMark - 3DMark Fire Strike Standard Graphics
min: 1080 avg: 1209 median: 1184 (1%) max: 1646 Points
3DMark - 3DMark Ice Storm Graphics
min: 22501 avg: 46670 median: 46436.5 (6%) max: 62083 Points
3DMark 11 - 3DM11 Performance Score
min: 1626 avg: 1763 median: 1710 (2%) max: 2504 Points
3DMark 11 - 3DM11 Performance GPU
min: 1458 avg: 1545 median: 1488.5 (1%) max: 2233 Points
3DMark Vantage + Intel UHD Graphics 24EUs (Alder Lake-N) 3DMark Vantage - 3DM Vant. Perf. total
min: 5527 avg: 6122 median: 5775.5 (2%) max: 8332 Points
3DM Vant. Perf. GPU no PhysX + Intel UHD Graphics 24EUs (Alder Lake-N) 3DMark Vantage - 3DM Vant. Perf. GPU no PhysX
min: 4603 avg: 5188 median: 4957 (3%) max: 7213 Points
3DMark 05 - 3DMark 05 - Standard
min: 12034 avg: 16771 median: 17649 (19%) max: 21014 Points
3DMark 06 3DMark 06 - Standard 1280x1024 + Intel UHD Graphics 24EUs (Alder Lake-N)
min: 8849 avg: 10419 median: 10057 (13%) max: 13452 Points
Unigine Valley 1.0 - Unigine Valley 1.0 DX
min: 4.1 avg: 4.8 median: 4.7 (2%) max: 5.7 fps
SPECviewperf 12 + Intel UHD Graphics 24EUs (Alder Lake-N) SPECviewperf 12 - specvp12 sw-03
min: 20.9 avg: 21.3 median: 21.1 (5%) max: 22 fps
specvp12 snx-02 + Intel UHD Graphics 24EUs (Alder Lake-N) SPECviewperf 12 - specvp12 snx-02
min: 2 avg: 2.1 median: 2.1 (0%) max: 2.13 fps
specvp12 showcase-01 + Intel UHD Graphics 24EUs (Alder Lake-N) SPECviewperf 12 - specvp12 showcase-01
min: 5.71 avg: 6 median: 6 (1%) max: 6.19 fps
specvp12 mediacal-01 + Intel UHD Graphics 24EUs (Alder Lake-N) SPECviewperf 12 - specvp12 mediacal-01
min: 2.53 avg: 2.7 median: 2.8 (1%) max: 2.83 fps
specvp12 maya-04 + Intel UHD Graphics 24EUs (Alder Lake-N) SPECviewperf 12 - specvp12 maya-04
min: 11.4 avg: 11.6 median: 11.5 (3%) max: 12 fps
specvp12 energy-01 + Intel UHD Graphics 24EUs (Alder Lake-N) SPECviewperf 12 - specvp12 energy-01
min: 0.15 avg: 0.2 median: 0.2 (0%) max: 0.18 fps
specvp12 creo-01 + Intel UHD Graphics 24EUs (Alder Lake-N) SPECviewperf 12 - specvp12 creo-01
min: 8.48 avg: 8.6 median: 8.5 (3%) max: 8.69 fps
specvp12 catia-04 + Intel UHD Graphics 24EUs (Alder Lake-N) SPECviewperf 12 - specvp12 catia-04
min: 10.9 avg: 11 median: 10.9 (2%) max: 11.3 fps
specvp12 3dsmax-05 + Intel UHD Graphics 24EUs (Alder Lake-N) SPECviewperf 12 - specvp12 3dsmax-05
min: 13.6 avg: 14.1 median: 13.8 (2%) max: 14.9 fps
SPECviewperf 13 specvp13 sw-04 + Intel UHD Graphics 24EUs (Alder Lake-N) SPECviewperf 13 - specvp13 sw-04
min: 27.4 avg: 27.7 median: 27.7 (7%) max: 28.1 fps
specvp13 snx-03 + Intel UHD Graphics 24EUs (Alder Lake-N) SPECviewperf 13 - specvp13 snx-03
min: 3.6 avg: 3.7 median: 3.8 (0%) max: 3.84 fps
specvp13 showcase-02 + Intel UHD Graphics 24EUs (Alder Lake-N) SPECviewperf 13 - specvp13 showcase-02
min: 5.69 avg: 6 median: 6 (1%) max: 6.17 fps
specvp13 medical-02 + Intel UHD Graphics 24EUs (Alder Lake-N) SPECviewperf 13 - specvp13 medical-02
min: 2.28 avg: 2.6 median: 2.8 (1%) max: 2.84 fps
specvp13 maya-05 + Intel UHD Graphics 24EUs (Alder Lake-N) SPECviewperf 13 - specvp13 maya-05
min: 15.9 avg: 16.4 median: 16.3 (2%) max: 17 fps
specvp13 energy-02 + Intel UHD Graphics 24EUs (Alder Lake-N) SPECviewperf 13 - specvp13 energy-02
310 fps (100%)
specvp13 creo-02 + Intel UHD Graphics 24EUs (Alder Lake-N) SPECviewperf 13 - specvp13 creo-02
min: 11.6 avg: 11.7 median: 11.7 (2%) max: 11.8 fps
specvp13 catia-05 + Intel UHD Graphics 24EUs (Alder Lake-N) SPECviewperf 13 - specvp13 catia-05
min: 15.6 avg: 15.9 median: 15.8 (2%) max: 16.2 fps
specvp13 3dsmax-06 + Intel UHD Graphics 24EUs (Alder Lake-N) SPECviewperf 13 - specvp13 3dsmax-06
min: 13.4 avg: 14 median: 13.7 (2%) max: 14.8 fps
Cinebench R10 Cinebench R10 Shading (32bit) + Intel UHD Graphics 24EUs (Alder Lake-N) Cinebench R10 - Cinebench R10 Shading (32bit)
min: 7035 avg: 8399 median: 8492.5 (6%) max: 10013 Points
Cinebench R11.5 Cinebench R11.5 OpenGL 64 Bit + Intel UHD Graphics 24EUs (Alder Lake-N) Cinebench R11.5 - Cinebench R11.5 OpenGL 64 Bit
min: 33.23 avg: 38.1 median: 36.8 (13%) max: 49.39 fps
Cinebench R15 + Intel UHD Graphics 24EUs (Alder Lake-N) Cinebench R15 - Cinebench R15 OpenGL 64 Bit
min: 34.3 avg: 40.6 median: 39.8 (2%) max: 56.41 fps
Cinebench R15 OpenGL Ref. Match 64 Bit + Intel UHD Graphics 24EUs (Alder Lake-N) Cinebench R15 - Cinebench R15 OpenGL Ref. Match 64 Bit
97.8 % (98%)
Basemark GPU 1.2 - Basemark GPU 1.2 Vulkan Official Medium Offscreen 1080
min: 46.4 avg: 80.6 median: 54.1 (0%) max: 217 fps
Basemark GPU 1.2 - Basemark GPU 1.2 Vulkan Official High Offscreen 2160
min: 3.64 avg: 5.6 median: 3.9 (1%) max: 15.3 fps
Geekbench 6.2 - Geekbench 6.2 GPU OpenCL
min: 3010 avg: 3430 median: 3310 (1%) max: 5145 Points
Geekbench 6.2 - Geekbench 6.2 GPU Vulkan
min: 3443 avg: 3911 median: 3802.5 (1%) max: 5822 Points
LuxMark v2.0 64Bit - LuxMark v2.0 Room GPU
min: 222 avg: 313.8 median: 254 (1%) max: 760 Samples/s
LuxMark v2.0 64Bit - LuxMark v2.0 Sala GPU
min: 473 avg: 653 median: 524.5 (1%) max: 1386 Samples/s
ComputeMark v2.1 - ComputeMark v2.1 Result
min: 628 avg: 679 median: 655.5 (1%) max: 911 Points
Power Consumption - Furmark Stress Test Power Consumption - external Monitor *
min: 9.49 avg: 16.8 median: 15.8 (2%) max: 27.5 Watt
Power Consumption - The Witcher 3 Power Consumption - external Monitor *
min: 21.5 avg: 26.4 median: 26.5 (4%) max: 31.1 Watt
Power Consumption - Witcher 3 Power Consumption *
min: 12.4 avg: 17 median: 17 (4%) max: 21.5 Watt
Power Consumption - Witcher 3 ultra Power Efficiency
0.3 fps per Watt (28%)
Emissions Witcher 3 Fan Noise + Intel UHD Graphics 24EUs (Alder Lake-N) Emissions - Witcher 3 Fan Noise
33 dB(A) (53%)
Average Benchmarks Intel UHD Graphics 24EUs (Alder Lake-N) → 0% n=
- Range of benchmark values for this graphics card
- Average benchmark values for this graphics card
* Smaller numbers mean a higher performance
1 This benchmark is not used for the average calculation
Game Benchmarks The following benchmarks stem from our benchmarks of review laptops. The performance depends on the used graphics memory, clock rate, processor, system settings, drivers, and operating systems. So the results don't have to be representative for all laptops with this GPU. For detailed information on the benchmark results, click on the fps number.
UHD Graphics 24EUs (Alder Lake-N):
6.1 [X] Acemagic S1 2.11
Intel Processor N97 GHz
UHD Graphics 24EUs (Alder Lake-N)
min:
4.62 fps, max:
7.72 fps
fps
UHD Graphics 24EUs (Alder Lake-N):
4.7 [X] Acemagic S1 2.11
Intel Processor N97 GHz
UHD Graphics 24EUs (Alder Lake-N)
min:
3.75 fps, max:
5.57 fps
fps
UHD Graphics 24EUs (Alder Lake-N):
4 [X] Acemagic S1 2.11
Intel Processor N97 GHz
UHD Graphics 24EUs (Alder Lake-N)
min:
3.31 fps, max:
4.85 fps
fps
UHD Graphics 24EUs (Alder Lake-N):
5.2 [X] Trigkey G4 Intel Processor N100 1GHz
UHD Graphics 24EUs (Alder Lake-N)
6.6 [X] Acemagic S1 Intel Processor N95 GHz
UHD Graphics 24EUs (Alder Lake-N)
7 8.5 [X] Acemagic S1 Intel Processor N97 GHz
UHD Graphics 24EUs (Alder Lake-N)
10.2 [X] Acemagic S1 Intel Processor N97 GHz
UHD Graphics 24EUs (Alder Lake-N)
~ 7 fps
UHD Graphics 24EUs (Alder Lake-N):
3.9 [X] Trigkey G4 Intel Processor N100 1GHz
UHD Graphics 24EUs (Alder Lake-N)
5.3 [X] Acemagic S1 Intel Processor N95 GHz
UHD Graphics 24EUs (Alder Lake-N)
5.5 7.9 [X] Acemagic S1 Intel Processor N97 GHz
UHD Graphics 24EUs (Alder Lake-N)
~ 6 fps
UHD Graphics 24EUs (Alder Lake-N):
3.2 [X] Acemagic S1 Intel Processor N95 GHz
UHD Graphics 24EUs (Alder Lake-N)
3.3 [X] Trigkey G4 Intel Processor N100 1GHz
UHD Graphics 24EUs (Alder Lake-N)
3.4 4.9 [X] Acemagic S1 Intel Processor N97 GHz
UHD Graphics 24EUs (Alder Lake-N)
~ 4 fps
UHD Graphics 24EUs (Alder Lake-N):
1.8 [X] Trigkey G4 Intel Processor N100 1GHz
UHD Graphics 24EUs (Alder Lake-N)
fps
UHD Graphics 24EUs (Alder Lake-N):
17.7 [X] BOSGAME N95 800660
Intel Processor N95 GHz
UHD Graphics 24EUs (Alder Lake-N)
min:
6.73 fps, max:
36.1 fps
fps
UHD Graphics 24EUs (Alder Lake-N):
13.6 [X] BOSGAME N95 800660
Intel Processor N95 GHz
UHD Graphics 24EUs (Alder Lake-N)
min:
4.64 fps, max:
51.9 fps
fps
UHD Graphics 24EUs (Alder Lake-N):
9.5 [X] BOSGAME N95 800660
Intel Processor N95 GHz
UHD Graphics 24EUs (Alder Lake-N)
min:
2.41 fps, max:
79.3 fps
fps
UHD Graphics 24EUs (Alder Lake-N):
29.8 [X] BOSGAME N95 874931
Intel Processor N95 GHz
UHD Graphics 24EUs (Alder Lake-N)
min:
24 fps, P1:
23 fps, max:
34 fps
30.6 [X] Blackview MP80 874931
Intel Processor N95 GHz
UHD Graphics 24EUs (Alder Lake-N)
min:
24 fps, P1:
24 fps, max:
36 fps
~ 30 fps
UHD Graphics 24EUs (Alder Lake-N):
12.4 [X] Blackview MP80 874931
Intel Processor N95 GHz
UHD Graphics 24EUs (Alder Lake-N)
min:
10 fps, P1:
10 fps, max:
13 fps
fps
UHD Graphics 24EUs (Alder Lake-N):
9.9 [X] Blackview MP80 874931
Intel Processor N95 GHz
UHD Graphics 24EUs (Alder Lake-N)
min:
8 fps, P1:
8 fps, max:
11 fps
fps
UHD Graphics 24EUs (Alder Lake-N):
6.3 [X] Blackview MP80 874931
Intel Processor N95 GHz
UHD Graphics 24EUs (Alder Lake-N)
min:
5 fps, P1:
5 fps, max:
7 fps
fps
UHD Graphics 24EUs (Alder Lake-N):
25.4 [X] BOSGAME N95 759689
Intel Processor N95 GHz
UHD Graphics 24EUs (Alder Lake-N)
min:
21 fps, max:
30 fps
25.7 [X] Blackview MP80 759689
Intel Processor N95 GHz
UHD Graphics 24EUs (Alder Lake-N)
min:
22 fps, max:
30 fps
~ 26 fps
UHD Graphics 24EUs (Alder Lake-N):
11.2 [X] Blackview MP80 759689
Intel Processor N95 GHz
UHD Graphics 24EUs (Alder Lake-N)
min:
9 fps, max:
12 fps
11.3 [X] BOSGAME N95 759689
Intel Processor N95 GHz
UHD Graphics 24EUs (Alder Lake-N)
min:
9 fps, max:
12 fps
~ 11 fps
UHD Graphics 24EUs (Alder Lake-N):
8.1 [X] Blackview MP80 759689
Intel Processor N95 GHz
UHD Graphics 24EUs (Alder Lake-N)
min:
6 fps, max:
9 fps
8.1 [X] BOSGAME N95 759689
Intel Processor N95 GHz
UHD Graphics 24EUs (Alder Lake-N)
min:
6 fps, max:
9 fps
~ 8 fps
UHD Graphics 24EUs (Alder Lake-N):
12 [X] Acemagic S1 Intel Processor N95 GHz
UHD Graphics 24EUs (Alder Lake-N)
13.6 [X] Trigkey G4 Intel Processor N100 1GHz
UHD Graphics 24EUs (Alder Lake-N)
13.7 19.8 [X] Acemagic S1 Intel Processor N97 GHz
UHD Graphics 24EUs (Alder Lake-N)
~ 15 fps
UHD Graphics 24EUs (Alder Lake-N):
5.2 [X] Acemagic S1 Intel Processor N95 GHz
UHD Graphics 24EUs (Alder Lake-N)
5.8 [X] Trigkey G4 Intel Processor N100 1GHz
UHD Graphics 24EUs (Alder Lake-N)
5.9 8.3 [X] Acemagic S1 Intel Processor N97 GHz
UHD Graphics 24EUs (Alder Lake-N)
~ 6 fps
UHD Graphics 24EUs (Alder Lake-N):
2.9 [X] Acemagic S1 Intel Processor N95 GHz
UHD Graphics 24EUs (Alder Lake-N)
3.4 [X] Trigkey G4 Intel Processor N100 1GHz
UHD Graphics 24EUs (Alder Lake-N)
3.4 4.9 [X] Acemagic S1 Intel Processor N97 GHz
UHD Graphics 24EUs (Alder Lake-N)
~ 4 fps
UHD Graphics 24EUs (Alder Lake-N):
2.1 [X] Acemagic S1 Intel Processor N95 GHz
UHD Graphics 24EUs (Alder Lake-N)
2.4 [X] Trigkey G4 Intel Processor N100 1GHz
UHD Graphics 24EUs (Alder Lake-N)
2.4 3.6 [X] Acemagic S1 Intel Processor N97 GHz
UHD Graphics 24EUs (Alder Lake-N)
~ 3 fps
UHD Graphics 24EUs (Alder Lake-N):
14 [X] BOSGAME N95 Intel Processor N95 GHz
UHD Graphics 24EUs (Alder Lake-N)
min:
10 fps, max:
17 fps
14 [X] Acemagic S1 Intel Processor N95 GHz
UHD Graphics 24EUs (Alder Lake-N)
min:
10 fps, max:
17 fps
14 [X] Trigkey G4 Intel Processor N100 1GHz
UHD Graphics 24EUs (Alder Lake-N)
min:
9 fps, max:
17 fps
14 [X] Geekom MiniAir 12 Intel Processor N100 1GHz
UHD Graphics 24EUs (Alder Lake-N)
min:
9 fps, max:
18 fps
15 [X] Blackview MP80 Intel Processor N95 GHz
UHD Graphics 24EUs (Alder Lake-N)
min:
10 fps, max:
18 fps
19 [X] Acemagic S1 Intel Processor N97 GHz
UHD Graphics 24EUs (Alder Lake-N)
min:
13 fps, max:
24 fps
~ 15 fps
UHD Graphics 24EUs (Alder Lake-N):
7 [X] BOSGAME N95 Intel Processor N95 GHz
UHD Graphics 24EUs (Alder Lake-N)
min:
5 fps, max:
8 fps
7 [X] Blackview MP80 Intel Processor N95 GHz
UHD Graphics 24EUs (Alder Lake-N)
min:
5 fps, max:
9 fps
7 [X] Acemagic S1 Intel Processor N95 GHz
UHD Graphics 24EUs (Alder Lake-N)
min:
5 fps, max:
8 fps
7 [X] Trigkey G4 Intel Processor N100 1GHz
UHD Graphics 24EUs (Alder Lake-N)
min:
5 fps, max:
9 fps
7 [X] Geekom MiniAir 12 Intel Processor N100 1GHz
UHD Graphics 24EUs (Alder Lake-N)
min:
5 fps, max:
9 fps
10 [X] Acemagic S1 Intel Processor N97 GHz
UHD Graphics 24EUs (Alder Lake-N)
min:
7 fps, max:
12 fps
~ 8 fps
UHD Graphics 24EUs (Alder Lake-N):
6 [X] BOSGAME N95 Intel Processor N95 GHz
UHD Graphics 24EUs (Alder Lake-N)
min:
5 fps, max:
8 fps
6 [X] Blackview MP80 Intel Processor N95 GHz
UHD Graphics 24EUs (Alder Lake-N)
min:
5 fps, max:
8 fps
6 [X] Acemagic S1 Intel Processor N95 GHz
UHD Graphics 24EUs (Alder Lake-N)
min:
5 fps, max:
8 fps
6 [X] Trigkey G4 Intel Processor N100 1GHz
UHD Graphics 24EUs (Alder Lake-N)
min:
5 fps, max:
8 fps
7 [X] Geekom MiniAir 12 Intel Processor N100 1GHz
UHD Graphics 24EUs (Alder Lake-N)
min:
5 fps, max:
8 fps
9 [X] Acemagic S1 Intel Processor N97 GHz
UHD Graphics 24EUs (Alder Lake-N)
min:
7 fps, max:
11 fps
~ 7 fps
UHD Graphics 24EUs (Alder Lake-N):
6 [X] BOSGAME N95 Intel Processor N95 GHz
UHD Graphics 24EUs (Alder Lake-N)
min:
4 fps, max:
7 fps
6 [X] Acemagic S1 Intel Processor N95 GHz
UHD Graphics 24EUs (Alder Lake-N)
min:
4 fps, max:
7 fps
6 [X] Trigkey G4 Intel Processor N100 1GHz
UHD Graphics 24EUs (Alder Lake-N)
min:
4 fps, max:
8 fps
6 [X] Geekom MiniAir 12 Intel Processor N100 1GHz
UHD Graphics 24EUs (Alder Lake-N)
min:
4 fps, max:
8 fps
~ 6 fps
UHD Graphics 24EUs (Alder Lake-N):
12.4 [X] Trigkey G4 Intel Processor N100 1GHz
UHD Graphics 24EUs (Alder Lake-N)
min:
8.07 fps, max:
17.64 fps
12.6 [X] Geekom MiniAir 12 Intel Processor N100 1GHz
UHD Graphics 24EUs (Alder Lake-N)
min:
7.91 fps, max:
18.46 fps
13 [X] Acemagic S1 Intel Processor N95 GHz
UHD Graphics 24EUs (Alder Lake-N)
min:
8.26 fps, max:
18.75 fps
~ 13 fps
UHD Graphics 24EUs (Alder Lake-N):
5.6 [X] Trigkey G4 Intel Processor N100 1GHz
UHD Graphics 24EUs (Alder Lake-N)
min:
2.91 fps, max:
7.96 fps
5.8 [X] Geekom MiniAir 12 Intel Processor N100 1GHz
UHD Graphics 24EUs (Alder Lake-N)
min:
3.02 fps, max:
8.32 fps
5.9 [X] Acemagic S1 Intel Processor N95 GHz
UHD Graphics 24EUs (Alder Lake-N)
min:
3.25 fps, max:
7.8 fps
~ 6 fps
UHD Graphics 24EUs (Alder Lake-N):
4.3 [X] Trigkey G4 Intel Processor N100 1GHz
UHD Graphics 24EUs (Alder Lake-N)
min:
2.12 fps, max:
5.99 fps
4.4 [X] Geekom MiniAir 12 Intel Processor N100 1GHz
UHD Graphics 24EUs (Alder Lake-N)
min:
2.11 fps, max:
6.25 fps
4.5 [X] Acemagic S1 Intel Processor N95 GHz
UHD Graphics 24EUs (Alder Lake-N)
min:
2.33 fps, max:
6.29 fps
~ 4 fps
UHD Graphics 24EUs (Alder Lake-N):
3.6 [X] Trigkey G4 Intel Processor N100 1GHz
UHD Graphics 24EUs (Alder Lake-N)
min:
1.86 fps, max:
4.87 fps
fps
UHD Graphics 24EUs (Alder Lake-N):
4.9 6 [X] Acemagic S1 Intel Processor N95 GHz
UHD Graphics 24EUs (Alder Lake-N)
6.5 [X] Trigkey G4 Intel Processor N100 1GHz
UHD Graphics 24EUs (Alder Lake-N)
6.5 6.6 9 [X] Acemagic S1 Intel Processor N97 GHz
UHD Graphics 24EUs (Alder Lake-N)
~ 7 fps
UHD Graphics 24EUs (Alder Lake-N):
6 6 [X] Trigkey G4 Intel Processor N100 1GHz
UHD Graphics 24EUs (Alder Lake-N)
6 8.3 [X] Acemagic S1 Intel Processor N97 GHz
UHD Graphics 24EUs (Alder Lake-N)
~ 7 fps
UHD Graphics 24EUs (Alder Lake-N):
23.2 26.9 27 [X] Trigkey G4 1.47.22.14 D3D12
Intel Processor N100 1GHz
UHD Graphics 24EUs (Alder Lake-N)
min:
6.1 fps, P1:
7.25 fps, max:
274 fps
27.8 [X] Geekom MiniAir 12 1.47.22.14 D3D12
Intel Processor N100 1GHz
UHD Graphics 24EUs (Alder Lake-N)
min:
6.2 fps, P1:
7.49 fps, max:
267 fps
27.9 [X] BOSGAME N95 1.47.22.14 D3D12
Intel Processor N95 GHz
UHD Graphics 24EUs (Alder Lake-N)
min:
6 fps, P1:
7.32 fps, max:
245 fps
28 [X] Acemagic S1 1.47.22.14 D3D12
Intel Processor N95 GHz
UHD Graphics 24EUs (Alder Lake-N)
min:
6.3 fps, P1:
7.37 fps, max:
246 fps
28.7 [X] Blackview MP80 1.47.22.14 D3D12
Intel Processor N95 GHz
UHD Graphics 24EUs (Alder Lake-N)
min:
6.5 fps, P1:
7.42 fps, max:
245 fps
37.7 [X] Acemagic S1 1.47.22.14 D3D12
Intel Processor N97 GHz
UHD Graphics 24EUs (Alder Lake-N)
min:
8.6 fps, P1:
10.3 fps, max:
249 fps
~ 28 fps
UHD Graphics 24EUs (Alder Lake-N):
9.7 10.1 10.2 [X] BOSGAME N95 1.47.22.14 D3D12
Intel Processor N95 GHz
UHD Graphics 24EUs (Alder Lake-N)
min:
5 fps, P1:
5 fps, max:
206 fps
10.2 [X] Trigkey G4 1.47.22.14 D3D12
Intel Processor N100 1GHz
UHD Graphics 24EUs (Alder Lake-N)
min:
5 fps, P1:
5 fps, max:
216 fps
10.4 [X] Acemagic S1 1.47.22.14 D3D12
Intel Processor N95 GHz
UHD Graphics 24EUs (Alder Lake-N)
min:
5 fps, P1:
5 fps, max:
204 fps
10.8 [X] Geekom MiniAir 12 1.47.22.14 D3D12
Intel Processor N100 1GHz
UHD Graphics 24EUs (Alder Lake-N)
min:
5 fps, P1:
5 fps, max:
181.5 fps
14.1 [X] Blackview MP80 1.47.22.14 D3D12
Intel Processor N95 GHz
UHD Graphics 24EUs (Alder Lake-N)
min:
5 fps, P1:
5 fps, max:
205 fps
14.1 [X] Acemagic S1 1.47.22.14 D3D12
Intel Processor N97 GHz
UHD Graphics 24EUs (Alder Lake-N)
min:
5 fps, P1:
6.1 fps, max:
209 fps
~ 11 fps
UHD Graphics 24EUs (Alder Lake-N):
9.4 [X] Trigkey G4 1.47.22.14 D3D12
Intel Processor N100 1GHz
UHD Graphics 24EUs (Alder Lake-N)
min:
5 fps, P1:
5 fps, max:
215 fps
9.5 9.7 9.9 [X] BOSGAME N95 1.47.22.14 D3D12
Intel Processor N95 GHz
UHD Graphics 24EUs (Alder Lake-N)
min:
5 fps, P1:
5 fps, max:
195.2 fps
10.1 [X] Geekom MiniAir 12 1.47.22.14 D3D12
Intel Processor N100 1GHz
UHD Graphics 24EUs (Alder Lake-N)
min:
5 fps, P1:
5 fps, max:
186.8 fps
10.7 [X] Blackview MP80 1.47.22.14 D3D12
Intel Processor N95 GHz
UHD Graphics 24EUs (Alder Lake-N)
min:
5 fps, P1:
5 fps, max:
188.4 fps
10.8 [X] Acemagic S1 1.47.22.14 D3D12
Intel Processor N95 GHz
UHD Graphics 24EUs (Alder Lake-N)
min:
5 fps, P1:
5 fps, max:
212 fps
11.9 [X] Acemagic S1 1.47.22.14 D3D12
Intel Processor N97 GHz
UHD Graphics 24EUs (Alder Lake-N)
min:
5 fps, P1:
5 fps, max:
206 fps
~ 10 fps
UHD Graphics 24EUs (Alder Lake-N):
9.7 [X] Blackview MP80 1.47.22.14 D3D12
Intel Processor N95 GHz
UHD Graphics 24EUs (Alder Lake-N)
min:
5 fps, P1:
5 fps, max:
193.6 fps
10.6 14.2 [X] Trigkey G4 1.47.22.14 D3D12
Intel Processor N100 1GHz
UHD Graphics 24EUs (Alder Lake-N)
min:
5 fps, P1:
5 fps, max:
213 fps
14.8 [X] Acemagic S1 1.47.22.14 D3D12
Intel Processor N97 GHz
UHD Graphics 24EUs (Alder Lake-N)
min:
5 fps, P1:
5 fps, max:
202 fps
~ 12 fps
UHD Graphics 24EUs (Alder Lake-N):
14 [X] BOSGAME N95 Intel Processor N95 GHz
UHD Graphics 24EUs (Alder Lake-N)
min:
11 fps, max:
16 fps
14 [X] Acemagic S1 Intel Processor N95 GHz
UHD Graphics 24EUs (Alder Lake-N)
min:
12 fps, max:
16 fps
15 [X] Blackview MP80 Intel Processor N95 GHz
UHD Graphics 24EUs (Alder Lake-N)
min:
13 fps, max:
18 fps
15 [X] Trigkey G4 Intel Processor N100 1GHz
UHD Graphics 24EUs (Alder Lake-N)
min:
13 fps, max:
18 fps
15 [X] Geekom MiniAir 12 Intel Processor N100 1GHz
UHD Graphics 24EUs (Alder Lake-N)
min:
13 fps, max:
18 fps
20 [X] Acemagic S1 Intel Processor N97 GHz
UHD Graphics 24EUs (Alder Lake-N)
min:
17 fps, max:
22 fps
~ 16 fps
UHD Graphics 24EUs (Alder Lake-N):
6 [X] Acemagic S1 Intel Processor N95 GHz
UHD Graphics 24EUs (Alder Lake-N)
min:
5 fps, max:
8 fps
7 [X] Blackview MP80 Intel Processor N95 GHz
UHD Graphics 24EUs (Alder Lake-N)
min:
5 fps, max:
8 fps
7 [X] Trigkey G4 Intel Processor N100 1GHz
UHD Graphics 24EUs (Alder Lake-N)
min:
5 fps, max:
9 fps
7 [X] Geekom MiniAir 12 Intel Processor N100 1GHz
UHD Graphics 24EUs (Alder Lake-N)
min:
6 fps, max:
9 fps
9 [X] Acemagic S1 Intel Processor N97 GHz
UHD Graphics 24EUs (Alder Lake-N)
min:
8 fps, max:
11 fps
~ 7 fps
UHD Graphics 24EUs (Alder Lake-N):
6 [X] Blackview MP80 Intel Processor N95 GHz
UHD Graphics 24EUs (Alder Lake-N)
min:
5 fps, max:
8 fps
6 [X] Acemagic S1 Intel Processor N95 GHz
UHD Graphics 24EUs (Alder Lake-N)
min:
5 fps, max:
7 fps
6 [X] Trigkey G4 Intel Processor N100 1GHz
UHD Graphics 24EUs (Alder Lake-N)
min:
5 fps, max:
8 fps
6 [X] Geekom MiniAir 12 Intel Processor N100 1GHz
UHD Graphics 24EUs (Alder Lake-N)
min:
5 fps, max:
8 fps
9 [X] Acemagic S1 Intel Processor N97 GHz
UHD Graphics 24EUs (Alder Lake-N)
min:
8 fps, max:
11 fps
~ 7 fps
UHD Graphics 24EUs (Alder Lake-N):
5 [X] Acemagic S1 Intel Processor N95 GHz
UHD Graphics 24EUs (Alder Lake-N)
min:
5 fps, max:
7 fps
6 [X] Trigkey G4 Intel Processor N100 1GHz
UHD Graphics 24EUs (Alder Lake-N)
min:
5 fps, max:
7 fps
6 [X] Geekom MiniAir 12 Intel Processor N100 1GHz
UHD Graphics 24EUs (Alder Lake-N)
min:
5 fps, max:
7 fps
~ 6 fps
UHD Graphics 24EUs (Alder Lake-N):
44.7 52 62.1 68.7 [X] Acemagic S1 Intel Processor N95 GHz
UHD Graphics 24EUs (Alder Lake-N)
min:
48 fps, max:
-1 fps
69.3 [X] Blackview MP80 Intel Processor N95 GHz
UHD Graphics 24EUs (Alder Lake-N)
min:
50.1 fps, max:
-1 fps
69.7 72.7 [X] Acemagic S1 Intel Processor N97 GHz
UHD Graphics 24EUs (Alder Lake-N)
min:
53.4 fps, max:
-1 fps
74 [X] Geekom MiniAir 12 Intel Processor N100 1GHz
UHD Graphics 24EUs (Alder Lake-N)
min:
53.5 fps, max:
-1 fps
74.2 [X] BOSGAME N95 Intel Processor N95 GHz
UHD Graphics 24EUs (Alder Lake-N)
min:
56 fps, max:
-1 fps
76.6 [X] Trigkey G4 Intel Processor N100 1GHz
UHD Graphics 24EUs (Alder Lake-N)
min:
56.5 fps, max:
-1 fps
80.8 ~ 68 fps
UHD Graphics 24EUs (Alder Lake-N):
27.6 33.2 41 44.9 47.1 [X] Acemagic S1 Intel Processor N95 GHz
UHD Graphics 24EUs (Alder Lake-N)
min:
39.2 fps, max:
-1 fps
47.8 [X] BOSGAME N95 Intel Processor N95 GHz
UHD Graphics 24EUs (Alder Lake-N)
min:
40.4 fps, max:
-1 fps
47.9 [X] Trigkey G4 Intel Processor N100 1GHz
UHD Graphics 24EUs (Alder Lake-N)
min:
41.8 fps, max:
-1 fps
48.3 [X] Blackview MP80 Intel Processor N95 GHz
UHD Graphics 24EUs (Alder Lake-N)
min:
34.8 fps, max:
-1 fps
49.9 [X] Geekom MiniAir 12 Intel Processor N100 1GHz
UHD Graphics 24EUs (Alder Lake-N)
min:
41.6 fps, max:
-1 fps
51.6 52 [X] Acemagic S1 Intel Processor N97 GHz
UHD Graphics 24EUs (Alder Lake-N)
min:
39.9 fps, max:
-1 fps
~ 45 fps
UHD Graphics 24EUs (Alder Lake-N):
14.2 18.2 18.7 [X] Acemagic S1 Intel Processor N95 GHz
UHD Graphics 24EUs (Alder Lake-N)
min:
17.5 fps, max:
-1 fps
18.8 [X] BOSGAME N95 Intel Processor N95 GHz
UHD Graphics 24EUs (Alder Lake-N)
min:
17.5 fps, max:
-1 fps
19.2 19.6 [X] Blackview MP80 Intel Processor N95 GHz
UHD Graphics 24EUs (Alder Lake-N)
min:
18.2 fps, max:
-1 fps
19.8 [X] Trigkey G4 Intel Processor N100 1GHz
UHD Graphics 24EUs (Alder Lake-N)
min:
18.6 fps, max:
-1 fps
20.1 20.3 [X] Geekom MiniAir 12 Intel Processor N100 1GHz
UHD Graphics 24EUs (Alder Lake-N)
min:
18.9 fps, max:
-1 fps
20.7 26.8 [X] Acemagic S1 Intel Processor N97 GHz
UHD Graphics 24EUs (Alder Lake-N)
min:
25.1 fps, max:
-1 fps
~ 20 fps
UHD Graphics 24EUs (Alder Lake-N):
13.4 17 17.4 [X] Acemagic S1 Intel Processor N95 GHz
UHD Graphics 24EUs (Alder Lake-N)
min:
16.2 fps, max:
-1 fps
17.5 [X] BOSGAME N95 Intel Processor N95 GHz
UHD Graphics 24EUs (Alder Lake-N)
min:
16.4 fps, max:
-1 fps
17.8 18 [X] Blackview MP80 Intel Processor N95 GHz
UHD Graphics 24EUs (Alder Lake-N)
min:
16.9 fps, max:
-1 fps
18.4 [X] Trigkey G4 Intel Processor N100 1GHz
UHD Graphics 24EUs (Alder Lake-N)
min:
17.2 fps, max:
-1 fps
18.6 18.8 [X] Geekom MiniAir 12 Intel Processor N100 1GHz
UHD Graphics 24EUs (Alder Lake-N)
min:
17.5 fps, max:
-1 fps
19.1 24.9 [X] Acemagic S1 Intel Processor N97 GHz
UHD Graphics 24EUs (Alder Lake-N)
min:
23.1 fps, max:
-1 fps
~ 18 fps
UHD Graphics 24EUs (Alder Lake-N):
16 22 [X] BOSGAME N95 Intel Processor N95 GHz
UHD Graphics 24EUs (Alder Lake-N)
22.3 [X] Trigkey G4 Intel Processor N100 1GHz
UHD Graphics 24EUs (Alder Lake-N)
min:
9.85 fps, P0.1:
11.2 fps, P1:
12.8 fps, max:
97.4 fps
22.5 22.9 [X] Geekom MiniAir 12 Intel Processor N100 1GHz
UHD Graphics 24EUs (Alder Lake-N)
min:
9.81 fps, P0.1:
10.8 fps, P1:
13 fps, max:
111.5 fps
23.1 [X] Acemagic S1 Intel Processor N95 GHz
UHD Graphics 24EUs (Alder Lake-N)
min:
6.38 fps, P0.1:
8.66 fps, P1:
13.9 fps, max:
98.3 fps
33.3 [X] Acemagic S1 Intel Processor N97 GHz
UHD Graphics 24EUs (Alder Lake-N)
min:
3.59 fps, P0.1:
11.3 fps, P1:
17 fps, max:
121.4 fps
~ 23 fps
UHD Graphics 24EUs (Alder Lake-N):
14.6 [X] Trigkey G4 Intel Processor N100 1GHz
UHD Graphics 24EUs (Alder Lake-N)
min:
6.86 fps, P0.1:
7.07 fps, P1:
8.24 fps, max:
63.3 fps
14.7 [X] Geekom MiniAir 12 Intel Processor N100 1GHz
UHD Graphics 24EUs (Alder Lake-N)
min:
1.581 fps, P0.1:
4.59 fps, P1:
8.41 fps, max:
65.3 fps
14.8 [X] Acemagic S1 Intel Processor N95 GHz
UHD Graphics 24EUs (Alder Lake-N)
min:
1.456 fps, P0.1:
5.17 fps, P1:
8.48 fps, max:
69.5 fps
15.2 20.9 [X] Acemagic S1 Intel Processor N97 GHz
UHD Graphics 24EUs (Alder Lake-N)
min:
1.552 fps, P0.1:
10.9 fps, P1:
12.2 fps, max:
80.3 fps
~ 16 fps
UHD Graphics 24EUs (Alder Lake-N):
7.2 [X] BOSGAME N95 Intel Processor N95 GHz
UHD Graphics 24EUs (Alder Lake-N)
7.4 [X] Acemagic S1 Intel Processor N95 GHz
UHD Graphics 24EUs (Alder Lake-N)
min:
3.77 fps, P0.1:
3.86 fps, P1:
4.29 fps, max:
41.2 fps
7.8 [X] Trigkey G4 Intel Processor N100 1GHz
UHD Graphics 24EUs (Alder Lake-N)
min:
4.16 fps, P0.1:
4.19 fps, P1:
4.45 fps, max:
31 fps
8.2 [X] Geekom MiniAir 12 Intel Processor N100 1GHz
UHD Graphics 24EUs (Alder Lake-N)
min:
4.19 fps, P0.1:
4.42 fps, P1:
4.54 fps, max:
36.4 fps
8.4 10.8 [X] Acemagic S1 Intel Processor N97 GHz
UHD Graphics 24EUs (Alder Lake-N)
min:
5.74 fps, P0.1:
5.93 fps, P1:
6.14 fps, max:
50.2 fps
~ 8 fps
UHD Graphics 24EUs (Alder Lake-N):
3.8 5.2 [X] Acemagic S1 Intel Processor N97 GHz
UHD Graphics 24EUs (Alder Lake-N)
min:
3.14 fps, P0.1:
3.16 fps, P1:
3.24 fps, max:
12.8 fps
~ 4 fps
UHD Graphics 24EUs (Alder Lake-N):
44.7 51 [X] Trigkey G4 Intel Processor N100 1GHz
UHD Graphics 24EUs (Alder Lake-N)
min:
15.2 fps, P1:
35.7 fps, max:
97.9 fps
54 [X] Acemagic S1 Intel Processor N95 GHz
UHD Graphics 24EUs (Alder Lake-N)
min:
15.4 fps, P1:
37 fps, max:
88.1 fps
54.3 [X] BOSGAME N95 Intel Processor N95 GHz
UHD Graphics 24EUs (Alder Lake-N)
min:
1.817 fps, P1:
26.3 fps, max:
103.8 fps
57.2 [X] Blackview MP80 Intel Processor N95 GHz
UHD Graphics 24EUs (Alder Lake-N)
min:
17.3 fps, P1:
40 fps, max:
101.9 fps
58.2 [X] Acemagic S1 Intel Processor N97 GHz
UHD Graphics 24EUs (Alder Lake-N)
min:
7.46 fps, P1:
37 fps, max:
180.9 fps
59 [X] Geekom MiniAir 12 Intel Processor N100 1GHz
UHD Graphics 24EUs (Alder Lake-N)
min:
27.3 fps, P1:
43.5 fps, max:
97.9 fps
~ 54 fps
UHD Graphics 24EUs (Alder Lake-N):
36.6 39.4 [X] BOSGAME N95 Intel Processor N95 GHz
UHD Graphics 24EUs (Alder Lake-N)
min:
3.32 fps, P1:
20 fps, max:
95.5 fps
41.9 [X] Acemagic S1 Intel Processor N95 GHz
UHD Graphics 24EUs (Alder Lake-N)
min:
17.9 fps, P1:
29.4 fps, max:
70.1 fps
42.1 [X] Trigkey G4 Intel Processor N100 1GHz
UHD Graphics 24EUs (Alder Lake-N)
min:
18.8 fps, P1:
30.3 fps, max:
70.1 fps
48 [X] Geekom MiniAir 12 Intel Processor N100 1GHz
UHD Graphics 24EUs (Alder Lake-N)
min:
27.9 fps, P1:
35.7 fps, max:
82.2 fps
48 [X] Acemagic S1 Intel Processor N97 GHz
UHD Graphics 24EUs (Alder Lake-N)
min:
3.5 fps, P1:
31.3 fps, max:
81.1 fps
51.3 [X] Blackview MP80 Intel Processor N95 GHz
UHD Graphics 24EUs (Alder Lake-N)
min:
19.4 fps, P1:
37 fps, max:
78.4 fps
~ 44 fps
UHD Graphics 24EUs (Alder Lake-N):
5.9 6.4 [X] Acemagic S1 Intel Processor N95 GHz
UHD Graphics 24EUs (Alder Lake-N)
min:
3.66 fps, P1:
5.13 fps, max:
33.8 fps
6.4 [X] Trigkey G4 Intel Processor N100 1GHz
UHD Graphics 24EUs (Alder Lake-N)
min:
2.61 fps, P1:
4.78 fps, max:
33.3 fps
7.2 [X] Blackview MP80 Intel Processor N95 GHz
UHD Graphics 24EUs (Alder Lake-N)
min:
4.2 fps, P1:
5.52 fps, max:
38.5 fps
7.7 [X] Acemagic S1 Intel Processor N97 GHz
UHD Graphics 24EUs (Alder Lake-N)
min:
3.86 fps, P1:
5.62 fps, max:
33.2 fps
36.5 [X] BOSGAME N95 Intel Processor N95 GHz
UHD Graphics 24EUs (Alder Lake-N)
min:
0.2961 fps, P1:
3.83 fps, max:
88.9 fps
~ 12 fps
UHD Graphics 24EUs (Alder Lake-N):
2.7 [X] Trigkey G4 Intel Processor N100 1GHz
UHD Graphics 24EUs (Alder Lake-N)
min:
1.226 fps, P1:
1.558 fps, max:
13.3 fps
2.8 [X] Trigkey G4 Intel Processor N100 1GHz
UHD Graphics 24EUs (Alder Lake-N)
min:
1.26 fps, P1:
1.608 fps, max:
21.5 fps
2.9 [X] Acemagic S1 Intel Processor N95 GHz
UHD Graphics 24EUs (Alder Lake-N)
min:
1.295 fps, P1:
1.563 fps, max:
16.1 fps
3.2 [X] Blackview MP80 Intel Processor N95 GHz
UHD Graphics 24EUs (Alder Lake-N)
min:
1.439 fps, P1:
1.761 fps, max:
18.7 fps
3.2 [X] Blackview MP80 Intel Processor N95 GHz
UHD Graphics 24EUs (Alder Lake-N)
min:
1.461 fps, P1:
1.821 fps, max:
19.5 fps
3.4 [X] Acemagic S1 Intel Processor N97 GHz
UHD Graphics 24EUs (Alder Lake-N)
min:
1.558 fps, P1:
2.15 fps, max:
21.5 fps
~ 3 fps
For more games that might be playable and a list of all games and graphics cards visit our Gaming List
v1.28
log 02. 19:16:23
#0 checking url part for id 11607 +0s ... 0s
#1 checking url part for id 11547 +0s ... 0s
#2 redirected to Ajax server, took 1719940582 +0s ... 0s
#3 did not recreate cache, as it is less than 5 days old! Created at Mon, 01 Jul 2024 05:16:07 +0200 +0s ... 0s
#4 composed specs +0.096s ... 0.096s
#5 did output specs +0s ... 0.096s
#6 start showIntegratedCPUs +0s ... 0.096s
#7 getting avg benchmarks for device 11607 +0.02s ... 0.116s
#8 got single benchmarks 11607 +0s ... 0.117s
#9 getting avg benchmarks for device 11547 +0.004s ... 0.12s
#10 got single benchmarks 11547 +0.016s ... 0.137s
#11 got avg benchmarks for devices +0s ... 0.137s
#12 min, max, avg, median took s +0.029s ... 0.165s
#13 before gaming benchmark output +0s ... 0.165s
#14 Got 282 rows for game benchmarks. +0.018s ... 0.183s
#15 composed SQL query for gamebenchmarks +0s ... 0.183s
#16 got data and put it in $dataArray +0.001s ... 0.184s
#17 benchmarks composed for output. +0.006s ... 0.19s
#18 calculated avg scores. +0s ... 0.19s
#19 return log +0.002s ... 0.192s
Please share our article, every link counts!
Redaktion, 2017-09- 8 (Update: 2023-07- 1)
 Deutsch
 English
 Español
 Français
 Italiano
 Nederlands
 Polski
 Português
 Русский
 Türkçe
 Svenska
 Chinese
 Magyar