NVIDIA RTX 3500 Ada Generation Laptop GPU vs NVIDIA T600 vs NVIDIA RTX 5000 Ada Generation Laptop GPU
NVIDIA RTX 3500 Ada Generation Laptop GPU ► remove from comparison
The Nvidia RTX 3500 Ada Generation is a higher-end professional graphics card for use in laptops that sports 5,120 CUDA cores and 12 GB of ECC GDDR6 VRAM. Brought into existence in 2023, this graphics adapter leverages TSMC's 5 nm process and Nvidia's Ada Lovelace architecture to achieve higher-than-average performance combined with moderate power consumption. The Nvidia-recommended TGP range for the card is very wide at 60 W to 140 W leading to bizarre performance differences between different systems powered by what is supposed to be the same product.
Hardware-wise, the RTX 3500 is a cut-down GeForce RTX 4070 Desktop , as far as we can tell. Consequently, both make use of the AD104 chip and have little difficulty running triple-A games at QHD 1440p.
Quadro series graphics cards ship with a different BIOS and drivers than GeForce cards and are targeted at professional users rather than gaming. Commercial product design, large-scale calculations, simulation, data mining, 24 x 7 operation, certified drivers - if any of this sounds familiar, then a Quadro card will make you happy.
Architecture and Features
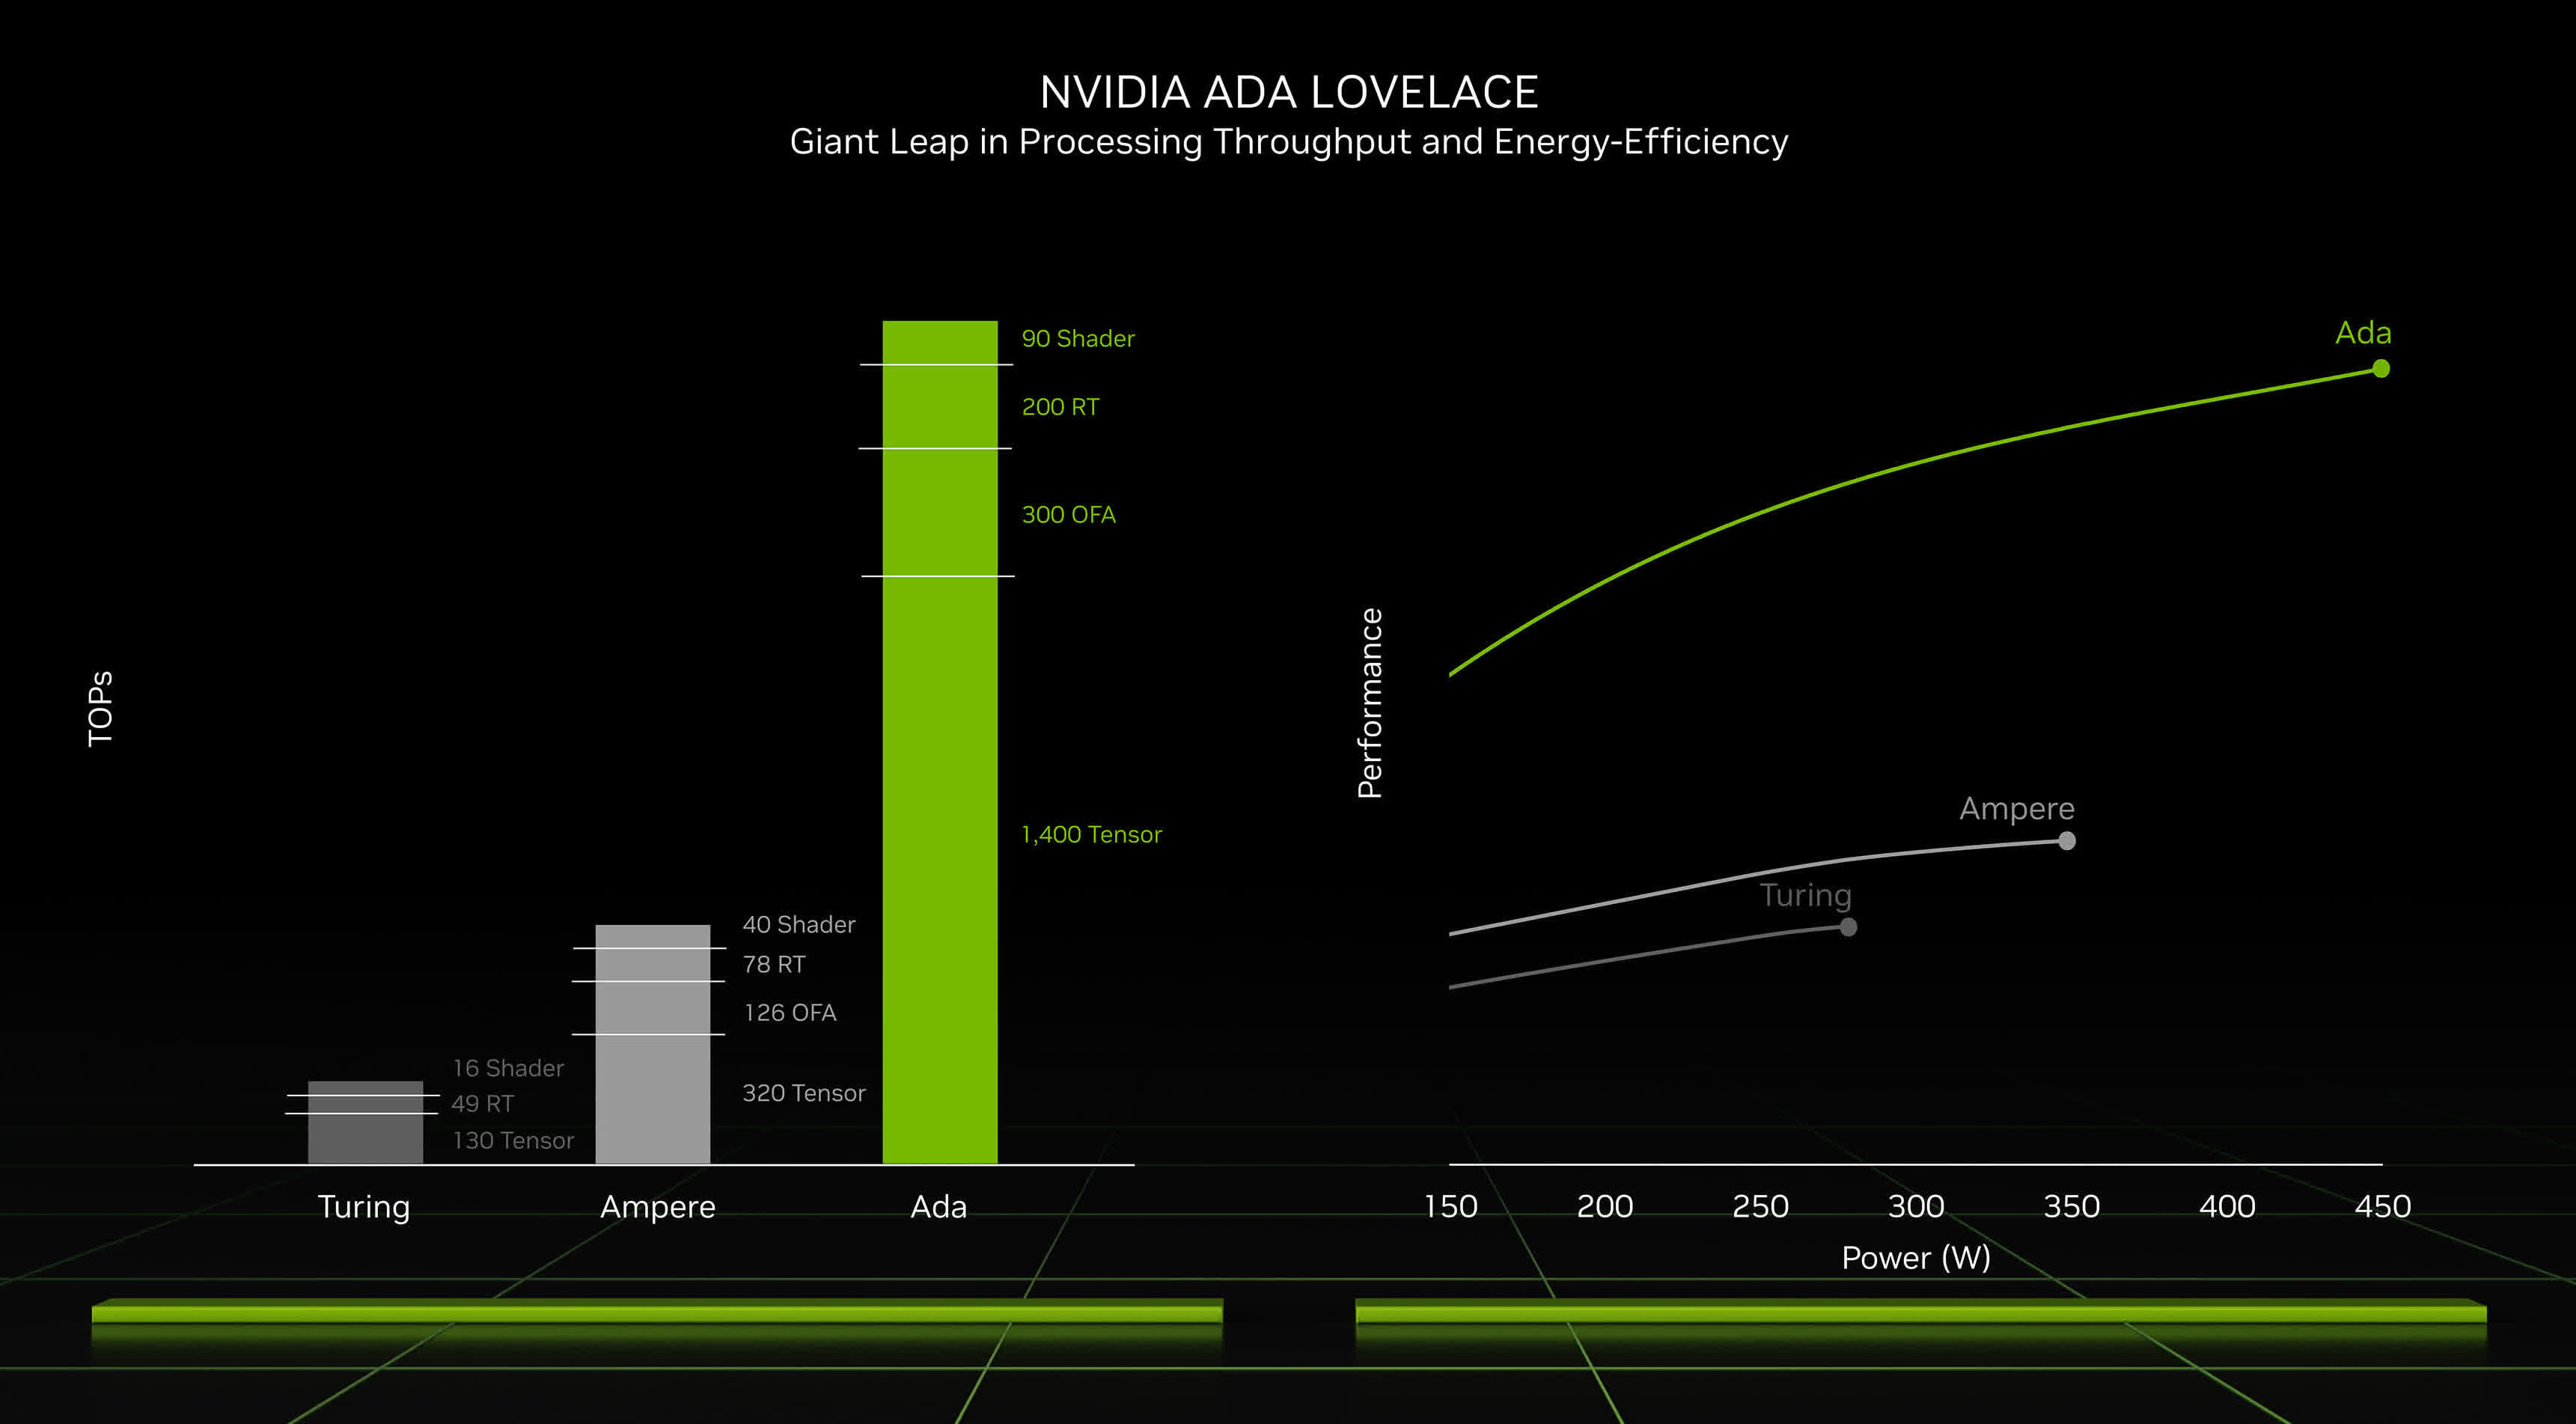
Ada Lovelace brings a range of improvements over older graphics cards utilizing the outgoing Ampere architecture. It's not just a better manufacturing process and a higher number of CUDA cores that we have here (up to 16,384 versus 10,752); under-the-hood refinements are plentiful, including an immensely larger L2 cache, an optimized ray tracing routine (a different wat to determine what is transparent and what isn't is used), and other changes. Naturally, these graphics cards can both encode and decode some of the most widely used video codecs, AVC, HEVC and AV1 included; they also support a host of Nvidia technologies, including Optimus and DLSS 3, and they can certainly be used for various AI tasks.
The RTX 3500 Ada features 40 RT cores of the 3rd generation, 160 Tensor cores of the 4th generation and 5,120 CUDA cores. Multiply those numbers by 1.15 and what you get looks exactly like a desktop RTX 4070 : 46, 184 and 5,888, respectively. Elsewhere, the graphics card comes with 12 GB of 192-bit wide ECC GDDR6 memory for a very healthy throughput of ~432 GB/s. Error correction can be turned off if desired. The fact that error correction is present here proves that the RTX 3500 Ada is indeed targeted at professional users.
Just like Ampere-based cards, the RTX 3500 makes use of the PCI-Express 4 protocol. 8K SUHD monitors are supported, however, DP 1.4a video outputs may prove to be a bottleneck down the line.
Performance
While we have not tested a single system featuring an RTX 3500 Ada Generation as of February 2024, we have plenty of performance data for the RTX 4070 Desktop , a graphics card that's about 20% superior to the RTX 3500 Ada Generation. Based on that, we fully expect the RTX 3500 to deliver:
a Blender 3.3 Classroom CUDA score of around 32 seconds a 3DMark 11 GPU score of around 44,000 around 90 fps in GTA V around 50 fps in Cyberpunk 2077 Nvidia's marketing materials mention "up to 23 TFLOPS" of performance, a 15% improvement over 20 TFLOPS delivered by the RTX 3000 Ada Generation .
Your mileage may vary depending on how competent the cooling solution of your laptop is and how high the TGP power target of the RTX 3500 is. One other thing worth mentioning is that enabling error correction appears to reduce the amount of video memory that is available to applications and games by up to a gigabyte.
Power consumption
Nvidia no longer divides its laptop graphics cards into Max-Q and non-max-Q models. Instead, laptop makers are free to set the TGP according to their needs, and the range can sometimes be shockingly wide. This is the case for the RTX 3500, as the lowest value recommended for it sits at just 60 W while the highest is more than two times higher at 140 W (this most likely includes Dynamic Boost). The slowest system built around an RTX 3500 Ada can easily be 60% slower than the fastest one. This is the kind of delta that we've been seeing on consumer-grade laptops featuring the latest GeForce RTX cards.
Last but not the least, the improved 5 nm process (TSMC 4N) the RTX 3500 is built with makes for very decent energy efficiency, as of mid 2023.
NVIDIA T600 ► remove from comparison
The Nvidia T600 Desktop GPU is a professional graphics card for workstations that is based on the Turing architecture (TU117 chip). The desktop version only offers 640 of the 1024 cores and therefore also less than the T600 mobile (896 CUDA cores). The card offers 4 GB GDDR6 graphics memory connected with a 128 bit bus (up to 160 GB/s bandwidth). The T600 supports certified drivers (former Quadro line) for professional applications like CAD, 3D modelling, DCC, medicine, or visualization applications.
The maximum power consumption of the card is rated at 40W.
NVIDIA RTX 5000 Ada Generation Laptop GPU ► remove from comparison
The Nvidia RTX 5000 Ada Generation , not to be confused with the A5000 , P5000 and the RTX 5000 Turing Generation , is a super-powerful professional graphics card for use in laptops that sports 9,728 CUDA cores and 16 GB of ECC GDDR6 VRAM. Brought into existence in 2023, this graphics adapter leverages TSMC's 5 nm process and Nvidia's Ada Lovelace architecture to achieve great performance combined with reasonable power consumption. The Nvidia-recommended TGP range for the card is very wide at 80 W to 175 W leading to bizarre performance differences between different systems powered by what is supposed to be the same product.
Hardware-wise, the RTX 5000 is a GeForce RTX 4090 Laptop in disguise. Consequently, both make use of the AD103 chip and have little difficulty running triple-A games at UHD 2160p.
Quadro series graphics cards ship with much different BIOS and drivers than GeForce cards and are targeted at professional users rather than gamers. Commercial product design, large-scale calculations, simulation, data mining, 24 x 7 operation - if any of this sounds familiar, then a Quadro card will make you happy.
Architecture and Features
Ada Lovelace brings a range of improvements over older graphics cards utilizing the outgoing Ampere architecture. It's not just a better manufacturing process and a higher number of CUDA cores that we have here (up to 16,384 versus 10,752); under-the-hood refinements are plentiful, including an immensely larger L2 cache and an optimized ray tracing routine (a different way to determine what is transparent and what isn't is used) and other changes. Naturally, these graphics cards can both encode and decode some of the most widely used video codecs, AVC, HEVC and AV1 included; they also support a host of proprietary Nvidia technologies, including Optimus and DLSS 3, and they can certainly be used for various AI tasks.
The RTX 5000 features 76 RT cores of the 3rd generation, 304 Tensor cores of the 4th generation and 9,728 CUDA cores, making it a lot faster than the RTX 4000 Ada Generation . Elsewhere, the graphics card comes with 16 GB of 256-bit wide ECC GDDR6 memory for an impressive throughput of ~576 GB/s. Error correction can be turned off if desired. The fact that error correction is present here proves that the RTX 5000 is indeed targeted at professional users.
Just like Ampere-based cards, the RTX 5000 makes use of the PCI-Express 4 protocol. 8K SUHD monitors are supported, however DP 1.4a video outputs can potentially prove to be a bottleneck down the line.
Performance
The average RTX 5000 Ada Generation in our extensive database is noticeably inferior to the GeForce RTX 4080 in some tests but is totally comparable to the GeForce RTX 4090 in other ones, such as the Geekbench 6.2 GPU Vulkan test.
Nvidia's marketing materials mention "up to 42.6 TFLOPS" of performance which is very impressive. The RTX 4000 Ada Generation delivers up to 33.5 TFLOPS, for reference, while the RTX 500 Ada is only good for 9 TFLOPS.
Your mileage may vary depending on how competent the cooling solution of your laptop is and how high the TGP power target of the RTX 5000 is. One other thing worth mentioning is that enabling error correction appears to reduce the amount of video memory that is available to applications and games by up to a gigabyte.
Power consumption
Nvidia no longer divides its laptop graphics cards into Max-Q and non-max-Q models. Instead, laptop makers are free to set the TGP according to their needs, and the range can sometimes be shockingly wide. This is the case with the RTX 5000 Ada, as the lowest value recommended for it sits at just 80 W while the highest is more than two times higher at 175 W (this most likely includes Dynamic Boost). The slowest system built around an RTX 5000 Ada can easily be 60% slower than the fastest one. This is the kind of delta that we've already seen on consumer-grade laptops featuring the latest GeForce RTX cards.
Last but not the least, the improved 5 nm process (TSMC 4N) the RTX 5000 is built with makes for very decent energy efficiency, as of mid 2023.
NVIDIA RTX 3500 Ada Generation Laptop GPU NVIDIA T600 NVIDIA RTX 5000 Ada Generation Laptop GPU RTX Ada Generation Laptop GPU Series Architecture Ada Lovelace Turing Ada Lovelace Pipelines 5120 - unified 640 - unified 9728 - unified Raytracing Cores 40 76 Tensor / AI Cores 160 304 Theoretical Performance 23 TFLOPS FP32 Memory Speed 16000 effective = 2000 MHz 10000 effective = 1250 MHz 20000 effective = 2250 MHz Memory Bus Width 192 Bit 128 Bit 256 Bit Memory Type GDDR6 GDDR6 GDDR6 Max. Amount of Memory 12 GB 4 GB 16 GB Shared Memory no no no Memory Bandwidth 432 GB/s 160 GB/s 576 GB/s API DirectX 12 Ultimate, Shader 6.7, OpenGL 4.6, OpenCL 3.0, Vulkan 1.3 DirectX 12_1, Shader 6.6, OpenGL 4.6, OpenCL 3.0, Vulkan 1.3 DirectX 12 Ultimate, Shader 6.7, OpenGL 4.6, OpenCL 3.0, Vulkan 1.3 Power Consumption 115 Watt (60 - 115 Watt TGP) 40 Watt 150 Watt (80 - 150 Watt TGP) technology 5 nm 12 nm 4 nm PCIe 4.0 x16 3.0 x16 4 x16/x8 Displays 4 Displays (max.), HDMI 2.1, DisplayPort 1.4a 4 Displays (max.), DisplayPort 4x mini-DisplayPort 1.4a 4 Displays (max.), HDMI 2.1, DisplayPort 1.4a Notebook Size large large Date of Announcement 21.03.2023 12.04.2021 21.03.2023 Link to Manufacturer Page images.nvidia.com images.nvidia.com Predecessor RTX A3000 Laptop GPU RTX A5500 Laptop GPU TMUs 40 304 ROPs 32 112 Core Speed 735 - 1335 (Boost) MHz 930 - 1680 (Boost) MHz Transistors 4.7 Billion 76.3 Billion Die Size 200 mm² Cache L2: 64 MB
Benchmarks Performance Rating - 3DMark 11 + Fire Strike + Time Spy - T600
3 pt (9%)
...
...
max:
3DMark - 3DMark Time Spy Score
2496 Points (7%)
min: 14048 avg: 14894 median: 14644 (42%) max: 15989 Points
GPU TDP ? TDP 95 W TDP 105 W 16% 90% 100%
3DMark - 3DMark Time Spy Graphics
2195 Points (6%)
min: 14472 avg: 15184 median: 14861 (39%) max: 16218 Points
GPU TDP ? TDP 95 W TDP 105 W 14% 90% 100%
3DMark - 3DMark Ice Storm Unlimited Graphics
304731 Points (35%)
3DMark - 3DMark Ice Storm Extreme Graphics
152912 Points (20%)
3DMark - 3DMark Cloud Gate Score
31922 Points (34%)
3DMark - 3DMark Cloud Gate Graphics
40917 Points (11%)
3DMark - 3DMark Fire Strike Standard Score
6284 Points (11%)
min: 25968 avg: 27190 median: 26765 (47%) max: 28837 Points
GPU TDP ? TDP 95 W TDP 105 W 22% 91% 100%
3DMark - 3DMark Fire Strike Standard Graphics
6552 Points (7%)
min: 29664 avg: 31985 median: 30422 (34%) max: 35868 Points
GPU TDP ? TDP 95 W TDP 105 W 18% 84% 100%
3DMark - 3DMark Ice Storm Graphics
182459 Points (22%)
3DMark 11 - 3DM11 Performance Score
9497 Points (13%)
min: 38230 avg: 39111 median: 39530 (55%) max: 39574 Points
GPU TDP ? TDP 95 W TDP 105 W 24% 98% 100%
3DMark 11 - 3DM11 Performance GPU
8694 Points (7%)
min: 49833 avg: 51979 median: 51771 (44%) max: 54334 Points
GPU TDP ? TDP 95 W TDP 105 W 16% 93% 100%
3DMark Vantage + NVIDIA T600 3DMark Vantage - 3DM Vant. Perf. total
344838 Points (100%)
3DM Vant. Perf. GPU no PhysX + NVIDIA T600 3DMark Vantage - 3DM Vant. Perf. GPU no PhysX
30400 Points (17%)
3DMark 05 - 3DMark 05 - Standard
46380 Points (51%)
3DMark 06 3DMark 06 - Standard 1280x1024 + NVIDIA T600
43997 Points (57%)
Unigine Valley 1.0 - Unigine Valley 1.0 DX
32.7 fps (11%)
Blender - Blender 3.3 Classroom CUDA *
min: 21 avg: 22.3 median: 23 (3%) max: 23 Seconds
GPU TDP 95 W TDP 105 W 100% 100%
Blender - Blender 3.3 Classroom OPTIX *
min: 14 avg: 15 median: 15 (6%) max: 16 Seconds
GPU TDP 95 W TDP 105 W 100% 100%
SPECviewperf 12 + NVIDIA T600 SPECviewperf 12 - specvp12 sw-03
115 fps (29%)
specvp12 sw-03 + NVIDIA RTX 5000 Ada Generation Laptop GPU
min: 189.92 avg: 205.4 median: 201.1 (50%) max: 225.04 fps
GPU TDP ? TDP 95 W TDP 105 W 51% 87% 100%
specvp12 snx-02 + NVIDIA T600 SPECviewperf 12 - specvp12 snx-02
68.6 fps (10%)
specvp12 snx-02 + NVIDIA RTX 5000 Ada Generation Laptop GPU
min: 291.54 avg: 297.4 median: 292 (43%) max: 308.58 fps
GPU TDP ? TDP 95 W TDP 105 W 22% 95% 100%
specvp12 showcase-01 + NVIDIA T600 SPECviewperf 12 - specvp12 showcase-01
35.3 fps (8%)
specvp12 showcase-01 + NVIDIA RTX 5000 Ada Generation Laptop GPU
min: 150.65 avg: 158.8 median: 153.1 (33%) max: 172.49 fps
GPU TDP ? TDP 95 W TDP 105 W 20% 88% 100%
specvp12 mediacal-01 + NVIDIA T600 SPECviewperf 12 - specvp12 mediacal-01
19.5 fps (5%)
specvp12 mediacal-01 + NVIDIA RTX 5000 Ada Generation Laptop GPU
min: 132.41 avg: 134.5 median: 134.5 (34%) max: 136.68 fps
GPU TDP ? TDP 95 W TDP 105 W 14% 97% 100%
specvp12 maya-04 + NVIDIA T600 SPECviewperf 12 - specvp12 maya-04
67.4 fps (18%)
specvp12 maya-04 + NVIDIA RTX 5000 Ada Generation Laptop GPU
min: 170.7 avg: 180.8 median: 181.6 (49%) max: 190.08 fps
GPU TDP ? TDP 95 W TDP 105 W 35% 93% 100%
specvp12 energy-01 + NVIDIA T600 SPECviewperf 12 - specvp12 energy-01
5 fps (4%)
specvp12 energy-01 + NVIDIA RTX 5000 Ada Generation Laptop GPU
min: 29.61 avg: 30.6 median: 30.5 (27%) max: 31.48 fps
GPU TDP ? TDP 95 W TDP 105 W 16% 94% 100%
specvp12 creo-01 + NVIDIA T600 SPECviewperf 12 - specvp12 creo-01
78.5 fps (31%)
specvp12 creo-01 + NVIDIA RTX 5000 Ada Generation Laptop GPU
min: 178.71 avg: 192.1 median: 193.9 (78%) max: 203.54 fps
GPU TDP ? TDP 95 W TDP 105 W 39% 92% 100%
specvp12 catia-04 + NVIDIA T600 SPECviewperf 12 - specvp12 catia-04
76.9 fps (13%)
specvp12 catia-04 + NVIDIA RTX 5000 Ada Generation Laptop GPU
min: 221.81 avg: 242 median: 236.4 (39%) max: 267.81 fps
GPU TDP ? TDP 95 W TDP 105 W 29% 86% 100%
specvp12 3dsmax-05 + NVIDIA T600 SPECviewperf 12 - specvp12 3dsmax-05
80 fps (14%)
SPECviewperf 13 specvp13 sw-04 + NVIDIA T600 SPECviewperf 13 - specvp13 sw-04
114 fps (31%)
specvp13 sw-04 + NVIDIA RTX 5000 Ada Generation Laptop GPU
min: 195.09 avg: 210.3 median: 209.3 (56%) max: 226.6 fps
GPU TDP ? TDP 95 W TDP 105 W 50% 89% 100%
specvp13 snx-03 + NVIDIA T600 SPECviewperf 13 - specvp13 snx-03
122 fps (14%)
specvp13 snx-03 + NVIDIA RTX 5000 Ada Generation Laptop GPU
min: 524.73 avg: 535 median: 530.4 (59%) max: 550.94 fps
GPU TDP ? TDP 95 W TDP 105 W 22% 96% 100%
specvp13 showcase-02 + NVIDIA T600 SPECviewperf 13 - specvp13 showcase-02
34.9 fps (8%)
specvp13 showcase-02 + NVIDIA RTX 5000 Ada Generation Laptop GPU
min: 150.88 avg: 165.1 median: 154.1 (34%) max: 190.3 fps
GPU TDP ? TDP 95 W TDP 105 W 18% 80% 100%
specvp13 medical-02 + NVIDIA T600 SPECviewperf 13 - specvp13 medical-02
35.7 fps (7%)
specvp13 medical-02 + NVIDIA RTX 5000 Ada Generation Laptop GPU
min: 169 avg: 198.4 median: 176.2 (37%) max: 249.87 fps
GPU TDP ? TDP 95 W TDP 105 W 17% 100% 79%
specvp13 maya-05 + NVIDIA T600 SPECviewperf 13 - specvp13 maya-05
99.8 fps (11%)
specvp13 maya-05 + NVIDIA RTX 5000 Ada Generation Laptop GPU
min: 385.99 avg: 400.8 median: 391.6 (44%) max: 424.73 fps
GPU TDP ? TDP 95 W TDP 105 W 23% 92% 100%
specvp13 energy-02 + NVIDIA T600 SPECviewperf 13 - specvp13 energy-02
12.6 fps (4%)
specvp13 energy-02 + NVIDIA RTX 5000 Ada Generation Laptop GPU
min: 105.16 avg: 107.7 median: 108.2 (35%) max: 109.73 fps
GPU TDP ? TDP 95 W TDP 105 W 11% 97% 100%
specvp13 creo-02 + NVIDIA T600 SPECviewperf 13 - specvp13 creo-02
98 fps (14%)
specvp13 creo-02 + NVIDIA RTX 5000 Ada Generation Laptop GPU
min: 354.77 avg: 375.9 median: 375.1 (55%) max: 397.76 fps
GPU TDP ? TDP 95 W TDP 105 W 25% 92% 100%
specvp13 3dsmax-06 + NVIDIA T600 SPECviewperf 13 - specvp13 3dsmax-06
79.9 fps (14%)
specvp13 3dsmax-06 + NVIDIA RTX 5000 Ada Generation Laptop GPU
min: 258.63 avg: 269.7 median: 272.1 (47%) max: 278.36 fps
GPU TDP ? TDP 95 W TDP 105 W 29% 95% 100%
specvp13 catia-05 + NVIDIA RTX 5000 Ada Generation Laptop GPU SPECviewperf 13 - specvp13 catia-05
min: 352.35 avg: 378.7 median: 374.4 (42%) max: 409.2 fps
GPU TDP 95 W TDP 105 W 89% 100%
SPECviewperf 2020 specvp2020 solidworks-05 4k + NVIDIA T600 SPECviewperf 2020 - specvp2020 solidworks-05 4k
16.9 fps (5%)
specvp2020 solidworks-05 4k + NVIDIA RTX 5000 Ada Generation Laptop GPU
min: 129.32 avg: 135 median: 135 (40%) max: 140.59 fps
GPU TDP ? TDP 95 W TDP 105 W 12% 92% 100%
specvp2020 snx-04 4k + NVIDIA T600 SPECviewperf 2020 - specvp2020 snx-04 4k
75.6 fps (8%)
specvp2020 snx-04 4k + NVIDIA RTX 5000 Ada Generation Laptop GPU
min: 214.15 avg: 271.1 median: 237 (24%) max: 362.19 fps
GPU TDP ? TDP 95 W TDP 105 W 21% 62% 100%
specvp2020 medical-03 4k + NVIDIA T600 SPECviewperf 2020 - specvp2020 medical-03 4k
4.5 fps (4%)
specvp2020 medical-03 4k + NVIDIA RTX 5000 Ada Generation Laptop GPU
min: 36.13 avg: 43.8 median: 36.8 (35%) max: 58.46 fps
GPU TDP ? TDP 95 W TDP 105 W 9% 100% 76%
specvp2020 maya-06 4k + NVIDIA T600 SPECviewperf 2020 - specvp2020 maya-06 4k
46.1 fps (8%)
specvp2020 maya-06 4k + NVIDIA RTX 5000 Ada Generation Laptop GPU
min: 184.05 avg: 211 median: 207.2 (34%) max: 241.7 fps
GPU TDP ? TDP 95 W TDP 105 W 19% 81% 100%
specvp2020 energy-03 4k + NVIDIA T600 SPECviewperf 2020 - specvp2020 energy-03 4k
6.7 fps (1%)
specvp2020 energy-03 4k + NVIDIA RTX 5000 Ada Generation Laptop GPU
min: 38.09 avg: 42.3 median: 39.6 (9%) max: 49.16 fps
GPU TDP ? TDP 95 W TDP 105 W 15% 100% 91%
specvp2020 creo-03 4k + NVIDIA T600 SPECviewperf 2020 - specvp2020 creo-03 4k
32.3 fps (15%)
specvp2020 creo-03 4k + NVIDIA RTX 5000 Ada Generation Laptop GPU
min: 100.9 avg: 111.1 median: 115.9 (55%) max: 116.47 fps
GPU TDP ? TDP 95 W TDP 105 W 28% 94% 100%
specvp2020 catia-06 4k + NVIDIA T600 SPECviewperf 2020 - specvp2020 catia-06 4k
13.8 fps (9%)
specvp2020 catia-06 4k + NVIDIA RTX 5000 Ada Generation Laptop GPU
min: 67.17 avg: 70.4 median: 68.7 (45%) max: 75.33 fps
GPU TDP ? TDP 95 W TDP 105 W 18% 90% 100%
specvp2020 3dsmax-07 4k + NVIDIA T600 SPECviewperf 2020 - specvp2020 3dsmax-07 4k
19.4 fps (8%)
specvp2020 3dsmax-07 4k + NVIDIA RTX 5000 Ada Generation Laptop GPU
min: 84.87 avg: 92.4 median: 94.6 (39%) max: 97.75 fps
GPU TDP ? TDP 95 W TDP 105 W 20% 100% 88%
specvp2020 solidworks-07 4k + NVIDIA RTX 5000 Ada Generation Laptop GPU SPECviewperf 2020 - specvp2020 solidworks-07 4k
128.1 fps (37%)
specvp2020 solidworks-07 1080p + NVIDIA RTX 5000 Ada Generation Laptop GPU SPECviewperf 2020 - specvp2020 solidworks-07 1080p
307.2 fps (82%)
specvp2020 solidworks-05 1080p + NVIDIA RTX 5000 Ada Generation Laptop GPU SPECviewperf 2020 - specvp2020 solidworks-05 1080p
min: 307.72 avg: 324 median: 324 (63%) max: 340.35 fps
GPU TDP 95 W TDP 105 W 90% 100%
specvp2020 snx-04 1080p + NVIDIA RTX 5000 Ada Generation Laptop GPU SPECviewperf 2020 - specvp2020 snx-04 1080p
min: 520.25 avg: 533 median: 525.6 (86%) max: 554.23 fps
GPU TDP 95 W TDP 105 W 94% 100%
specvp2020 medical-03 1080p + NVIDIA RTX 5000 Ada Generation Laptop GPU SPECviewperf 2020 - specvp2020 medical-03 1080p
min: 85.08 avg: 104.1 median: 86.3 (61%) max: 140.89 fps
GPU TDP 95 W TDP 105 W 100% 75%
specvp2020 maya-06 1080p + NVIDIA RTX 5000 Ada Generation Laptop GPU SPECviewperf 2020 - specvp2020 maya-06 1080p
min: 419.68 avg: 437.7 median: 433.6 (63%) max: 459.91 fps
GPU TDP 95 W TDP 105 W 93% 100%
specvp2020 energy-03 1080p + NVIDIA RTX 5000 Ada Generation Laptop GPU SPECviewperf 2020 - specvp2020 energy-03 1080p
min: 104.5 avg: 107.4 median: 108.2 (87%) max: 109.65 fps
GPU TDP 95 W TDP 105 W 97% 100%
specvp2020 creo-03 1080p + NVIDIA RTX 5000 Ada Generation Laptop GPU SPECviewperf 2020 - specvp2020 creo-03 1080p
min: 133.03 avg: 152.1 median: 153.8 (76%) max: 169.52 fps
GPU TDP 95 W TDP 105 W 85% 100%
specvp2020 catia-06 1080p + NVIDIA RTX 5000 Ada Generation Laptop GPU SPECviewperf 2020 - specvp2020 catia-06 1080p
min: 121.41 avg: 124.7 median: 122.7 (79%) max: 130.04 fps
GPU TDP 95 W TDP 105 W 94% 100%
specvp2020 3dsmax-07 1080p + NVIDIA RTX 5000 Ada Generation Laptop GPU SPECviewperf 2020 - specvp2020 3dsmax-07 1080p
min: 161.08 avg: 165.8 median: 161.5 (73%) max: 174.72 fps
GPU TDP 95 W TDP 105 W 92% 100%
Cinebench R10 Cinebench R10 Shading (32bit) + NVIDIA T600 Cinebench R10 - Cinebench R10 Shading (32bit)
6830 Points (5%)
Cinebench R11.5 Cinebench R11.5 OpenGL 64 Bit + NVIDIA T600 Cinebench R11.5 - Cinebench R11.5 OpenGL 64 Bit
104.1 fps (36%)
Cinebench R15 + NVIDIA T600 Cinebench R15 - Cinebench R15 OpenGL 64 Bit
227.1 fps (13%)
Cinebench R15 OpenGL 64 Bit + NVIDIA RTX 5000 Ada Generation Laptop GPU
min: 267 avg: 334 median: 347 (20%) max: 388 fps
GPU TDP ? TDP 95 W TDP 105 W 59% 79% 100%
Cinebench R15 OpenGL Ref. Match 64 Bit + NVIDIA T600 Cinebench R15 - Cinebench R15 OpenGL Ref. Match 64 Bit
99.6 % (100%)
Cinebench R15 OpenGL Ref. Match 64 Bit + NVIDIA RTX 5000 Ada Generation Laptop GPU
99.6 % (100%)
GPU TDP ? TDP 95 W TDP 105 W 100% 100% 100%
Basemark GPU 1.2 - Basemark GPU 1.2 Vulkan Official Medium Offscreen 1080
min: 104.6 avg: 1019 median: 1380 (9%) max: 1572 fps
GPU TDP 95 W TDP 105 W 100% 7%
Basemark GPU 1.2 - Basemark GPU 1.2 Vulkan Official High Offscreen 2160
3.6 fps (1%)
GPU TDP 95 W TDP 105 W 100% 100%
Geekbench 6.2 - Geekbench 6.2 GPU OpenCL
min: 152959 avg: 161815 median: 162695 (47%) max: 169792 Points
GPU TDP 95 W TDP 105 W 93% 100%
Geekbench 6.2 - Geekbench 6.2 GPU Vulkan
min: 124149 avg: 133082 median: 136348 (44%) max: 138748 Points
GPU TDP 95 W TDP 105 W 94% 100%
LuxMark v2.0 64Bit - LuxMark v2.0 Room GPU
1121 Samples/s (5%)
LuxMark v2.0 64Bit - LuxMark v2.0 Sala GPU
2049 Samples/s (4%)
ComputeMark v2.1 - ComputeMark v2.1 Result
4825 Points (5%)
Power Consumption - Furmark Stress Test Power Consumption - external Monitor *
76.7 Watt (11%)
min: 121.1 avg: 143.4 median: 133 (19%) max: 176.1 Watt
GPU TDP ? TDP 95 W TDP 105 W 119% 109% 100%
Power Consumption - The Witcher 3 Power Consumption - external Monitor *
83.5 Watt (12%)
min: 134.7 avg: 152.7 median: 140.9 (20%) max: 182.5 Watt
GPU TDP ? TDP 95 W TDP 105 W 119% 108% 100%
Power Consumption - Witcher 3 Power Consumption *
min: 134 avg: 156 median: 144.5 (32%) max: 189.4 Watt
GPU TDP 95 W TDP 105 W 119% 100%
Power Consumption - Witcher 3 ultra Power Efficiency
min: 0.826 avg: 0.9 median: 0.9 (80%) max: 0.952 fps per Watt
GPU TDP 95 W TDP 105 W 100% 87%
Power Consumption - Witcher 3 ultra Power Efficiency - external Monitor
0.3 fps per Watt (27%)
min: 0.858 avg: 0.9 median: 0.9 (76%) max: 0.977 fps per Watt
GPU TDP ? TDP 95 W TDP 105 W 33% 100% 88%
Emissions Witcher 3 Fan Noise + NVIDIA RTX 5000 Ada Generation Laptop GPU Emissions - Witcher 3 Fan Noise
min: 44.1 avg: 47.8 median: 48.3 (77%) max: 51 dB(A)
GPU TDP 95 W TDP 105 W 100% 89%
Average Benchmarks NVIDIA T600 → 0% n= Average Benchmarks NVIDIA RTX 5000 Ada Generation Laptop GPU → 0% n=
- Range of benchmark values for this graphics card
- Average benchmark values for this graphics card
* Smaller numbers mean a higher performance
1 This benchmark is not used for the average calculation
Game Benchmarks The following benchmarks stem from our benchmarks of review laptops. The performance depends on the used graphics memory, clock rate, processor, system settings, drivers, and operating systems. So the results don't have to be representative for all laptops with this GPU. For detailed information on the benchmark results, click on the fps number.
NVIDIA RTX 5000 Ada Generation Laptop GPU:
125 [X] Dell Precision 5690 2.02
Intel Core Ultra 9 185H 3.8GHz
NVIDIA RTX 5000 Ada Generation Laptop GPU
min:
22.3 fps, max:
161.8 fps
fps
NVIDIA RTX 5000 Ada Generation Laptop GPU:
116.6 [X] Dell Precision 5690 2.02
Intel Core Ultra 9 185H 3.8GHz
NVIDIA RTX 5000 Ada Generation Laptop GPU
min:
21.8 fps, max:
159 fps
fps
NVIDIA RTX 5000 Ada Generation Laptop GPU:
94.6 [X] Dell Precision 5690 2.02
Intel Core Ultra 9 185H 3.8GHz
NVIDIA RTX 5000 Ada Generation Laptop GPU
min:
39.9 fps, max:
136.4 fps
fps
NVIDIA RTX 5000 Ada Generation Laptop GPU:
108.5 [X] Dell Precision 5690 2.02
Intel Core Ultra 9 185H 3.8GHz
NVIDIA RTX 5000 Ada Generation Laptop GPU
min:
48.4 fps, max:
151.8 fps
fps
NVIDIA RTX 5000 Ada Generation Laptop GPU:
63.7 [X] Dell Precision 5690 2.02
Intel Core Ultra 9 185H 3.8GHz
NVIDIA RTX 5000 Ada Generation Laptop GPU
min:
28 fps, max:
98.6 fps
fps
NVIDIA RTX 5000 Ada Generation Laptop GPU:
28.8 [X] Dell Precision 5690 2.02
Intel Core Ultra 9 185H 3.8GHz
NVIDIA RTX 5000 Ada Generation Laptop GPU
min:
21.2 fps, max:
43.6 fps
fps
NVIDIA RTX 5000 Ada Generation Laptop GPU:
172.3 fps
NVIDIA RTX 5000 Ada Generation Laptop GPU:
155.2 fps
NVIDIA RTX 5000 Ada Generation Laptop GPU:
139.2 fps
NVIDIA RTX 5000 Ada Generation Laptop GPU:
134.6 fps
NVIDIA RTX 5000 Ada Generation Laptop GPU:
100.5 fps
NVIDIA RTX 5000 Ada Generation Laptop GPU:
53.3 fps
NVIDIA RTX 5000 Ada Generation Laptop GPU:
87.8 fps
NVIDIA RTX 5000 Ada Generation Laptop GPU:
118 fps
NVIDIA RTX 5000 Ada Generation Laptop GPU:
93.9 fps
NVIDIA RTX 5000 Ada Generation Laptop GPU:
69.4 fps
NVIDIA RTX 5000 Ada Generation Laptop GPU:
54.5 fps
NVIDIA RTX 5000 Ada Generation Laptop GPU:
43.4 fps
NVIDIA RTX 5000 Ada Generation Laptop GPU:
33.3 fps
NVIDIA RTX 5000 Ada Generation Laptop GPU:
98 fps
NVIDIA RTX 5000 Ada Generation Laptop GPU:
94 fps
NVIDIA RTX 5000 Ada Generation Laptop GPU:
90 fps
NVIDIA RTX 5000 Ada Generation Laptop GPU:
81 fps
NVIDIA RTX 5000 Ada Generation Laptop GPU:
60 fps
NVIDIA RTX 5000 Ada Generation Laptop GPU:
34 fps
NVIDIA RTX 5000 Ada Generation Laptop GPU:
228 [X] Dell Precision 5690 959964
Intel Core Ultra 9 185H 3.8GHz
NVIDIA RTX 5000 Ada Generation Laptop GPU
min:
166 fps, P1:
140 fps, max:
259 fps
232 [X] Dell Precision 5000 5680 959964
Intel Core i9-13900H 1.9GHz
NVIDIA RTX 5000 Ada Generation Laptop GPU
min:
167 fps, P1:
122 fps, max:
271 fps
249 [X] HP ZBook Fury 16 G10 959964
Intel Core i9-13950HX 1.6GHz
NVIDIA RTX 5000 Ada Generation Laptop GPU
min:
164 fps, P1:
90 fps, max:
332 fps
~ 236 fps
NVIDIA RTX 5000 Ada Generation Laptop GPU:
218 [X] Dell Precision 5000 5680 959964
Intel Core i9-13900H 1.9GHz
NVIDIA RTX 5000 Ada Generation Laptop GPU
min:
160 fps, P1:
104 fps, max:
269 fps
224 [X] Dell Precision 5690 959964
Intel Core Ultra 9 185H 3.8GHz
NVIDIA RTX 5000 Ada Generation Laptop GPU
min:
185 fps, P1:
132 fps, max:
257 fps
246 [X] HP ZBook Fury 16 G10 959964
Intel Core i9-13950HX 1.6GHz
NVIDIA RTX 5000 Ada Generation Laptop GPU
min:
158 fps, P1:
72 fps, max:
293 fps
~ 229 fps
NVIDIA RTX 5000 Ada Generation Laptop GPU:
202 [X] Dell Precision 5000 5680 959964
Intel Core i9-13900H 1.9GHz
NVIDIA RTX 5000 Ada Generation Laptop GPU
min:
158 fps, P1:
101 fps, max:
236 fps
211 [X] HP ZBook Fury 16 G10 959964
Intel Core i9-13950HX 1.6GHz
NVIDIA RTX 5000 Ada Generation Laptop GPU
min:
162 fps, P1:
86 fps, max:
261 fps
217 [X] Dell Precision 5690 959964
Intel Core Ultra 9 185H 3.8GHz
NVIDIA RTX 5000 Ada Generation Laptop GPU
min:
166 fps, P1:
110 fps, max:
253 fps
~ 210 fps
NVIDIA RTX 5000 Ada Generation Laptop GPU:
84.5 [X] Dell Precision 5000 5680 959964
Intel Core i9-13900H 1.9GHz
NVIDIA RTX 5000 Ada Generation Laptop GPU
min:
74 fps, P1:
57 fps, max:
93 fps
86.2 [X] HP ZBook Fury 16 G10 959964
Intel Core i9-13950HX 1.6GHz
NVIDIA RTX 5000 Ada Generation Laptop GPU
min:
74 fps, P1:
37 fps, max:
97 fps
91.1 [X] Dell Precision 5690 959964
Intel Core Ultra 9 185H 3.8GHz
NVIDIA RTX 5000 Ada Generation Laptop GPU
min:
75 fps, P1:
64 fps, max:
103 fps
~ 87 fps
NVIDIA RTX 5000 Ada Generation Laptop GPU:
56.1 [X] Dell Precision 5000 5680 959964
Intel Core i9-13900H 1.9GHz
NVIDIA RTX 5000 Ada Generation Laptop GPU
min:
49 fps, P1:
34 fps, max:
64 fps
60.1 [X] Dell Precision 5690 959964
Intel Core Ultra 9 185H 3.8GHz
NVIDIA RTX 5000 Ada Generation Laptop GPU
min:
52 fps, P1:
48 fps, max:
70 fps
64.4 [X] HP ZBook Fury 16 G10 959964
Intel Core i9-13950HX 1.6GHz
NVIDIA RTX 5000 Ada Generation Laptop GPU
min:
56 fps, P1:
34 fps, max:
72 fps
~ 60 fps
NVIDIA RTX 5000 Ada Generation Laptop GPU:
28.8 [X] Dell Precision 5000 5680 959964
Intel Core i9-13900H 1.9GHz
NVIDIA RTX 5000 Ada Generation Laptop GPU
min:
24 fps, P1:
23 fps, max:
33 fps
29.6 [X] Dell Precision 5690 959964
Intel Core Ultra 9 185H 3.8GHz
NVIDIA RTX 5000 Ada Generation Laptop GPU
min:
25 fps, P1:
24 fps, max:
34 fps
33.4 [X] HP ZBook Fury 16 G10 959964
Intel Core i9-13950HX 1.6GHz
NVIDIA RTX 5000 Ada Generation Laptop GPU
min:
29 fps, P1:
27 fps, max:
38 fps
~ 31 fps
NVIDIA RTX 5000 Ada Generation Laptop GPU:
196.5 220 267.5 ~ 228 fps
NVIDIA RTX 5000 Ada Generation Laptop GPU:
124 125 139.4 ~ 129 fps
NVIDIA RTX 5000 Ada Generation Laptop GPU:
87.1 90.1 99.4 ~ 92 fps
NVIDIA RTX 5000 Ada Generation Laptop GPU:
48.4 50.9 53.9 ~ 51 fps
NVIDIA RTX 5000 Ada Generation Laptop GPU:
110.5 [X] HP ZBook Fury 16 G10 Intel Core i9-13950HX 1.6GHz
NVIDIA RTX 5000 Ada Generation Laptop GPU
min:
17.3 fps, max:
147 fps
124.9 ~ 118 fps
NVIDIA RTX 5000 Ada Generation Laptop GPU:
106.8 [X] HP ZBook Fury 16 G10 Intel Core i9-13950HX 1.6GHz
NVIDIA RTX 5000 Ada Generation Laptop GPU
min:
18.6 fps, max:
145 fps
122.7 ~ 115 fps
NVIDIA RTX 5000 Ada Generation Laptop GPU:
104.9 [X] HP ZBook Fury 16 G10 Intel Core i9-13950HX 1.6GHz
NVIDIA RTX 5000 Ada Generation Laptop GPU
min:
16.3 fps, max:
140.7 fps
107.7 ~ 106 fps
NVIDIA RTX 5000 Ada Generation Laptop GPU:
100 103.8 [X] HP ZBook Fury 16 G10 Intel Core i9-13950HX 1.6GHz
NVIDIA RTX 5000 Ada Generation Laptop GPU
min:
21.1 fps, max:
138.2 fps
~ 102 fps
NVIDIA RTX 5000 Ada Generation Laptop GPU:
66.2 74.7 [X] HP ZBook Fury 16 G10 Intel Core i9-13950HX 1.6GHz
NVIDIA RTX 5000 Ada Generation Laptop GPU
min:
19.2 fps, max:
104.6 fps
~ 70 fps
NVIDIA RTX 5000 Ada Generation Laptop GPU:
32.2 37 [X] HP ZBook Fury 16 G10 Intel Core i9-13950HX 1.6GHz
NVIDIA RTX 5000 Ada Generation Laptop GPU
min:
23.2 fps, max:
50.2 fps
~ 35 fps
NVIDIA RTX 5000 Ada Generation Laptop GPU:
405 [X] Dell Precision 5690 1.47.22.14 D3D12
Intel Core Ultra 9 185H 3.8GHz
NVIDIA RTX 5000 Ada Generation Laptop GPU
min:
197.5 fps, P1:
300 fps, max:
582 fps
411 [X] HP ZBook Fury 16 G10 1.47.22.14 D3D12
Intel Core i9-13950HX 1.6GHz
NVIDIA RTX 5000 Ada Generation Laptop GPU
min:
39.2 fps, P1:
289 fps, max:
615 fps
~ 408 fps
NVIDIA RTX 5000 Ada Generation Laptop GPU:
314 [X] Dell Precision 5690 1.47.22.14 D3D12
Intel Core Ultra 9 185H 3.8GHz
NVIDIA RTX 5000 Ada Generation Laptop GPU
min:
98.2 fps, P1:
230 fps, max:
467 fps
337 [X] HP ZBook Fury 16 G10 1.47.22.14 D3D12
Intel Core i9-13950HX 1.6GHz
NVIDIA RTX 5000 Ada Generation Laptop GPU
min:
26.6 fps, P1:
232 fps, max:
519 fps
~ 326 fps
NVIDIA RTX 5000 Ada Generation Laptop GPU:
276 [X] Dell Precision 5690 1.47.22.14 D3D12
Intel Core Ultra 9 185H 3.8GHz
NVIDIA RTX 5000 Ada Generation Laptop GPU
min:
48.4 fps, P1:
199.7 fps, max:
414 fps
306 [X] HP ZBook Fury 16 G10 1.47.22.14 D3D12
Intel Core i9-13950HX 1.6GHz
NVIDIA RTX 5000 Ada Generation Laptop GPU
min:
30.3 fps, P1:
212 fps, max:
484 fps
~ 291 fps
NVIDIA RTX 5000 Ada Generation Laptop GPU:
252 [X] Dell Precision 5690 1.47.22.14 D3D12
Intel Core Ultra 9 185H 3.8GHz
NVIDIA RTX 5000 Ada Generation Laptop GPU
min:
95 fps, P1:
179 fps, max:
377 fps
283 [X] HP ZBook Fury 16 G10 1.47.22.14 D3D12
Intel Core i9-13950HX 1.6GHz
NVIDIA RTX 5000 Ada Generation Laptop GPU
min:
35 fps, P1:
198.2 fps, max:
433 fps
~ 268 fps
NVIDIA RTX 5000 Ada Generation Laptop GPU:
190.6 [X] Dell Precision 5690 1.47.22.14 D3D12
Intel Core Ultra 9 185H 3.8GHz
NVIDIA RTX 5000 Ada Generation Laptop GPU
min:
44.7 fps, P1:
135.8 fps, max:
291 fps
216 [X] HP ZBook Fury 16 G10 1.47.22.14 D3D12
Intel Core i9-13950HX 1.6GHz
NVIDIA RTX 5000 Ada Generation Laptop GPU
min:
36.8 fps, P1:
158.7 fps, max:
373 fps
~ 203 fps
NVIDIA RTX 5000 Ada Generation Laptop GPU:
105.1 [X] HP ZBook Fury 16 G10 1.47.22.14 D3D12
Intel Core i9-13950HX 1.6GHz
NVIDIA RTX 5000 Ada Generation Laptop GPU
min:
42.4 fps, P1:
85.1 fps, max:
228 fps
105.3 [X] Dell Precision 5690 1.47.22.14 D3D12
Intel Core Ultra 9 185H 3.8GHz
NVIDIA RTX 5000 Ada Generation Laptop GPU
min:
44 fps, P1:
89.3 fps, max:
212 fps
~ 105 fps
NVIDIA RTX 5000 Ada Generation Laptop GPU:
144 [X] Dell Precision 5690 Intel Core Ultra 9 185H 3.8GHz
NVIDIA RTX 5000 Ada Generation Laptop GPU
min:
103 fps, max:
184 fps
145 158 [X] HP ZBook Fury 16 G10 Intel Core i9-13950HX 1.6GHz
NVIDIA RTX 5000 Ada Generation Laptop GPU
min:
117 fps, max:
202 fps
~ 149 fps
NVIDIA RTX 5000 Ada Generation Laptop GPU:
132 134 [X] Dell Precision 5690 Intel Core Ultra 9 185H 3.8GHz
NVIDIA RTX 5000 Ada Generation Laptop GPU
min:
107 fps, max:
180 fps
144 [X] HP ZBook Fury 16 G10 Intel Core i9-13950HX 1.6GHz
NVIDIA RTX 5000 Ada Generation Laptop GPU
min:
107 fps, max:
183 fps
~ 137 fps
NVIDIA RTX 5000 Ada Generation Laptop GPU:
127 [X] Dell Precision 5690 Intel Core Ultra 9 185H 3.8GHz
NVIDIA RTX 5000 Ada Generation Laptop GPU
min:
97 fps, max:
176 fps
129 138 [X] HP ZBook Fury 16 G10 Intel Core i9-13950HX 1.6GHz
NVIDIA RTX 5000 Ada Generation Laptop GPU
min:
102 fps, max:
178 fps
~ 131 fps
NVIDIA RTX 5000 Ada Generation Laptop GPU:
119 [X] Dell Precision 5690 Intel Core Ultra 9 185H 3.8GHz
NVIDIA RTX 5000 Ada Generation Laptop GPU
min:
91 fps, max:
159 fps
131 [X] HP ZBook Fury 16 G10 Intel Core i9-13950HX 1.6GHz
NVIDIA RTX 5000 Ada Generation Laptop GPU
min:
98 fps, max:
172 fps
132 ~ 127 fps
NVIDIA RTX 5000 Ada Generation Laptop GPU:
113 [X] Dell Precision 5690 Intel Core Ultra 9 185H 3.8GHz
NVIDIA RTX 5000 Ada Generation Laptop GPU
min:
88 fps, max:
145 fps
114 129 [X] HP ZBook Fury 16 G10 Intel Core i9-13950HX 1.6GHz
NVIDIA RTX 5000 Ada Generation Laptop GPU
min:
94 fps, max:
166 fps
~ 119 fps
NVIDIA RTX 5000 Ada Generation Laptop GPU:
70 72 [X] Dell Precision 5690 Intel Core Ultra 9 185H 3.8GHz
NVIDIA RTX 5000 Ada Generation Laptop GPU
min:
64 fps, max:
85 fps
~ 71 fps
NVIDIA RTX 5000 Ada Generation Laptop GPU:
113.9 133 153.9 ~ 134 fps
NVIDIA RTX 5000 Ada Generation Laptop GPU:
74.8 86.2 102.6 ~ 88 fps
NVIDIA RTX 5000 Ada Generation Laptop GPU:
100.8 103.8 120 ~ 108 fps
NVIDIA RTX 5000 Ada Generation Laptop GPU:
60.4 63.2 68.7 ~ 64 fps
NVIDIA RTX 5000 Ada Generation Laptop GPU:
169.4 [X] Dell Precision 5690 Intel Core Ultra 9 185H 3.8GHz
NVIDIA RTX 5000 Ada Generation Laptop GPU
min:
144.5 fps, max:
-1 fps
178 211 [X] HP ZBook Fury 16 G10 Intel Core i9-13950HX 1.6GHz
NVIDIA RTX 5000 Ada Generation Laptop GPU
min:
181.5 fps, max:
-1 fps
~ 186 fps
NVIDIA RTX 5000 Ada Generation Laptop GPU:
149.2 [X] Dell Precision 5690 Intel Core Ultra 9 185H 3.8GHz
NVIDIA RTX 5000 Ada Generation Laptop GPU
min:
129.7 fps, max:
-1 fps
161.7 191.7 [X] HP ZBook Fury 16 G10 Intel Core i9-13950HX 1.6GHz
NVIDIA RTX 5000 Ada Generation Laptop GPU
min:
164.6 fps, max:
-1 fps
~ 168 fps
NVIDIA RTX 5000 Ada Generation Laptop GPU:
150.1 [X] Dell Precision 5690 Intel Core Ultra 9 185H 3.8GHz
NVIDIA RTX 5000 Ada Generation Laptop GPU
min:
128.5 fps, max:
-1 fps
154 188.2 [X] HP ZBook Fury 16 G10 Intel Core i9-13950HX 1.6GHz
NVIDIA RTX 5000 Ada Generation Laptop GPU
min:
149.9 fps, max:
-1 fps
~ 164 fps
NVIDIA RTX 5000 Ada Generation Laptop GPU:
139.9 [X] Dell Precision 5690 Intel Core Ultra 9 185H 3.8GHz
NVIDIA RTX 5000 Ada Generation Laptop GPU
min:
118 fps, max:
-1 fps
144 166.7 [X] HP ZBook Fury 16 G10 Intel Core i9-13950HX 1.6GHz
NVIDIA RTX 5000 Ada Generation Laptop GPU
min:
137.7 fps, max:
-1 fps
~ 150 fps
NVIDIA RTX 5000 Ada Generation Laptop GPU:
130 [X] Dell Precision 5690 Intel Core Ultra 9 185H 3.8GHz
NVIDIA RTX 5000 Ada Generation Laptop GPU
min:
104.9 fps, max:
-1 fps
142.5 157.3 [X] HP ZBook Fury 16 G10 Intel Core i9-13950HX 1.6GHz
NVIDIA RTX 5000 Ada Generation Laptop GPU
min:
129.2 fps, max:
-1 fps
~ 143 fps
NVIDIA RTX 5000 Ada Generation Laptop GPU:
411.3 [X] Dell Precision 5690 Intel Core Ultra 9 185H 3.8GHz
NVIDIA RTX 5000 Ada Generation Laptop GPU
min:
368 fps, max:
433 fps
412.7 510.5 [X] HP ZBook Fury 16 G10 Intel Core i9-13950HX 1.6GHz
NVIDIA RTX 5000 Ada Generation Laptop GPU
min:
455 fps, max:
633 fps
~ 445 fps
NVIDIA RTX 5000 Ada Generation Laptop GPU:
329.6 351.2 [X] Dell Precision 5690 Intel Core Ultra 9 185H 3.8GHz
NVIDIA RTX 5000 Ada Generation Laptop GPU
min:
333 fps, max:
380 fps
430.3 [X] HP ZBook Fury 16 G10 Intel Core i9-13950HX 1.6GHz
NVIDIA RTX 5000 Ada Generation Laptop GPU
min:
414 fps, max:
456 fps
~ 370 fps
NVIDIA RTX 5000 Ada Generation Laptop GPU:
256 258.7 [X] Dell Precision 5690 Intel Core Ultra 9 185H 3.8GHz
NVIDIA RTX 5000 Ada Generation Laptop GPU
min:
245 fps, max:
274 fps
298.1 [X] HP ZBook Fury 16 G10 Intel Core i9-13950HX 1.6GHz
NVIDIA RTX 5000 Ada Generation Laptop GPU
min:
272 fps, max:
327 fps
~ 271 fps
NVIDIA RTX 5000 Ada Generation Laptop GPU:
137 137.6 [X] Dell Precision 5690 Intel Core Ultra 9 185H 3.8GHz
NVIDIA RTX 5000 Ada Generation Laptop GPU
min:
127 fps, max:
147 fps
156.5 [X] HP ZBook Fury 16 G10 Intel Core i9-13950HX 1.6GHz
NVIDIA RTX 5000 Ada Generation Laptop GPU
min:
147 fps, max:
170 fps
~ 144 fps
NVIDIA RTX 5000 Ada Generation Laptop GPU:
97 103.9 [X] Dell Precision 5690 Intel Core Ultra 9 185H 3.8GHz
NVIDIA RTX 5000 Ada Generation Laptop GPU
min:
98 fps, max:
118 fps
105.2 [X] HP ZBook Fury 16 G10 Intel Core i9-13950HX 1.6GHz
NVIDIA RTX 5000 Ada Generation Laptop GPU
min:
96 fps, max:
135 fps
~ 102 fps
NVIDIA RTX 5000 Ada Generation Laptop GPU:
185.4 [X] Dell Precision 5000 5680 Intel Core i9-13900H 1.9GHz
NVIDIA RTX 5000 Ada Generation Laptop GPU
min:
2.25 fps, P1:
142.9 fps, max:
454 fps
fps
NVIDIA RTX 5000 Ada Generation Laptop GPU:
179.7 [X] Dell Precision 5000 5680 Intel Core i9-13900H 1.9GHz
NVIDIA RTX 5000 Ada Generation Laptop GPU
min:
3.5 fps, P1:
125 fps, max:
388 fps
fps
NVIDIA RTX 5000 Ada Generation Laptop GPU:
175.3 [X] Dell Precision 5000 5680 Intel Core i9-13900H 1.9GHz
NVIDIA RTX 5000 Ada Generation Laptop GPU
min:
3.07 fps, P1:
125 fps, max:
318 fps
fps
NVIDIA RTX 5000 Ada Generation Laptop GPU:
117.1 [X] Dell Precision 5000 5680 Intel Core i9-13900H 1.9GHz
NVIDIA RTX 5000 Ada Generation Laptop GPU
min:
6.83 fps, P1:
76.9 fps, max:
199.3 fps
fps
NVIDIA RTX 5000 Ada Generation Laptop GPU:
106.6 [X] Dell Precision 5000 5680 Intel Core i9-13900H 1.9GHz
NVIDIA RTX 5000 Ada Generation Laptop GPU
min:
4.29 fps, P1:
71.4 fps, max:
201 fps
fps
NVIDIA RTX 5000 Ada Generation Laptop GPU:
108 [X] Dell Precision 5000 5680 Intel Core i9-13900H 1.9GHz
NVIDIA RTX 5000 Ada Generation Laptop GPU
min:
22.1 fps, P1:
66.7 fps, max:
257 fps
fps
NVIDIA RTX 5000 Ada Generation Laptop GPU low med. high ultra QHD 4K Cyberpunk 2077 2.1 Phantom Liberty 125 116.6 94.6 108.5 63.7 28.8 Baldur's Gate 3 172.3 155.2 139.2 134.6 100.5 53.3 Ratchet & Clank Rift Apart 118 93.9 69.4 54.5 43.4 33.3 Returnal 98 94 90 81 60 34 F1 22 236 229 210 87 60 31 Tiny Tina's Wonderlands 228 203 157 129 92 51 Cyberpunk 2077 1.6 118 115 106 102 70 35 Strange Brigade 408 326 291 268 203 105 Far Cry 5 149 137 131 127 119 71 X-Plane 11.11 155 134 105 88 Final Fantasy XV Benchmark 197 170 136 108 64 Dota 2 Reborn 186 168 164 150 143 The Witcher 3 445 370 271 144 102 GTA V 185.4 179.7 175.3 117.1 106.6 108 < 30 fps < 60 fps < 120 fps ≥ 120 fps 3 11 4 10 5 9 1 5 6 1 9 1 1 6 6 1
NVIDIA T600 low med. high ultra QHD 4K Far Cry 6 93.5 44.6 21.3 6.33 F1 2021 171.9 78.8 63.7 40.2 29.1 15.7 F1 2020 150.4 73.1 55.5 38.6 27 14.5 Borderlands 3 107.6 42 26.7 19.9 13.4 5.54 Metro Exodus 74.6 34 24 19.4 14.8 8.47 Strange Brigade 174.4 64.9 51.4 44.8 31.9 17.9 Far Cry 5 95 46 42 39 26 12 X-Plane 11.11 132.8 107 95.9 40.8 Final Fantasy XV Benchmark 70.7 34.9 25.1 17.8 9.98 Dota 2 Reborn 162.8 148.6 120.7 110.5 39.6 The Witcher 3 139.1 82.8 47.5 27.2 16.1 GTA V 181.5 175.6 80.3 38.2 26.6 25 < 30 fps < 60 fps < 120 fps ≥ 120 fps 5 7 5 5 2 4 4 3 1 4 5 1 7 1 9 2
For more games that might be playable and a list of all games and graphics cards visit our Gaming List
v1.28
log 02. 17:05:18
#0 checking url part for id 11605 +0s ... 0s
#1 checking url part for id 11373 +0s ... 0s
#2 checking url part for id 11597 +0s ... 0s
#3 redirected to Ajax server, took 1719932717 +0s ... 0s
#4 did not recreate cache, as it is less than 5 days old! Created at Mon, 01 Jul 2024 05:16:07 +0200 +0s ... 0s
#5 composed specs +0.062s ... 0.062s
#6 did output specs +0s ... 0.062s
#7 start showIntegratedCPUs +0s ... 0.062s
#8 getting avg benchmarks for device 11605 +0.03s ... 0.092s
#9 got single benchmarks 11605 +0s ... 0.093s
#10 getting avg benchmarks for device 11373 +0.005s ... 0.097s
#11 got single benchmarks 11373 +0.005s ... 0.102s
#12 getting avg benchmarks for device 11597 +0s ... 0.103s
#13 got single benchmarks 11597 +0.008s ... 0.11s
#14 got avg benchmarks for devices +0s ... 0.11s
#15 min, max, avg, median took s +0.049s ... 0.159s
#16 before gaming benchmark output +0s ... 0.159s
#17 Got 230 rows for game benchmarks. +0.019s ... 0.178s
#18 composed SQL query for gamebenchmarks +0s ... 0.178s
#19 got data and put it in $dataArray +0.002s ... 0.179s
#20 benchmarks composed for output. +0.007s ... 0.187s
#21 calculated avg scores. +0s ... 0.187s
#22 return log +0.001s ... 0.187s
Please share our article, every link counts!
Redaktion, 2017-09- 8 (Update: 2023-07- 1)
 Deutsch
 English
 Español
 Français
 Italiano
 Nederlands
 Polski
 Português
 Русский
 Türkçe
 Svenska
 Chinese
 Magyar