NVIDIA RTX 2000 Ada Generation Laptop GPU vs NVIDIA Quadro T2000 (Laptop) vs NVIDIA T600 Laptop GPU
NVIDIA RTX 2000 Ada Generation Laptop GPU ► remove from comparison
The Nvidia RTX 2000 Ada Generation Laptop GPU , not to be confused with the A2000 , P2000 or T2000 , is a mid-range professional graphics card for use in laptops that sports 3,072 CUDA cores and 8 GB of GDDR6 VRAM. It would be fair to say that this is a GeForce RTX 4060 (Laptop) in disguise; consequently, the former is powered by the same AD107 chip as the latter, and is fast enough to handle any triple-A game at 1080p with Ultra quality settings. Brought into existence in 2023, the RTX 2000 leverages TSMC's 5 nm process and Nvidia's Ada Lovelace architecture to achieve very decent performance combined with moderate power consumption. The Nvidia-recommended TGP range for the card is very wide at 35 W to 140 W leading to bizarre performance differences between different systems powered by what is supposed to be the same product.
Quadro series graphics cards ship with much different BIOS and drivers than GeForce cards and are targeted at professional users rather than gamers. Commercial product design, large-scale calculations, simulation, data mining, 24 x 7 operation, certified drivers - if any of this sounds familiar, then a Quadro card will make you happy.
Architecture and Features
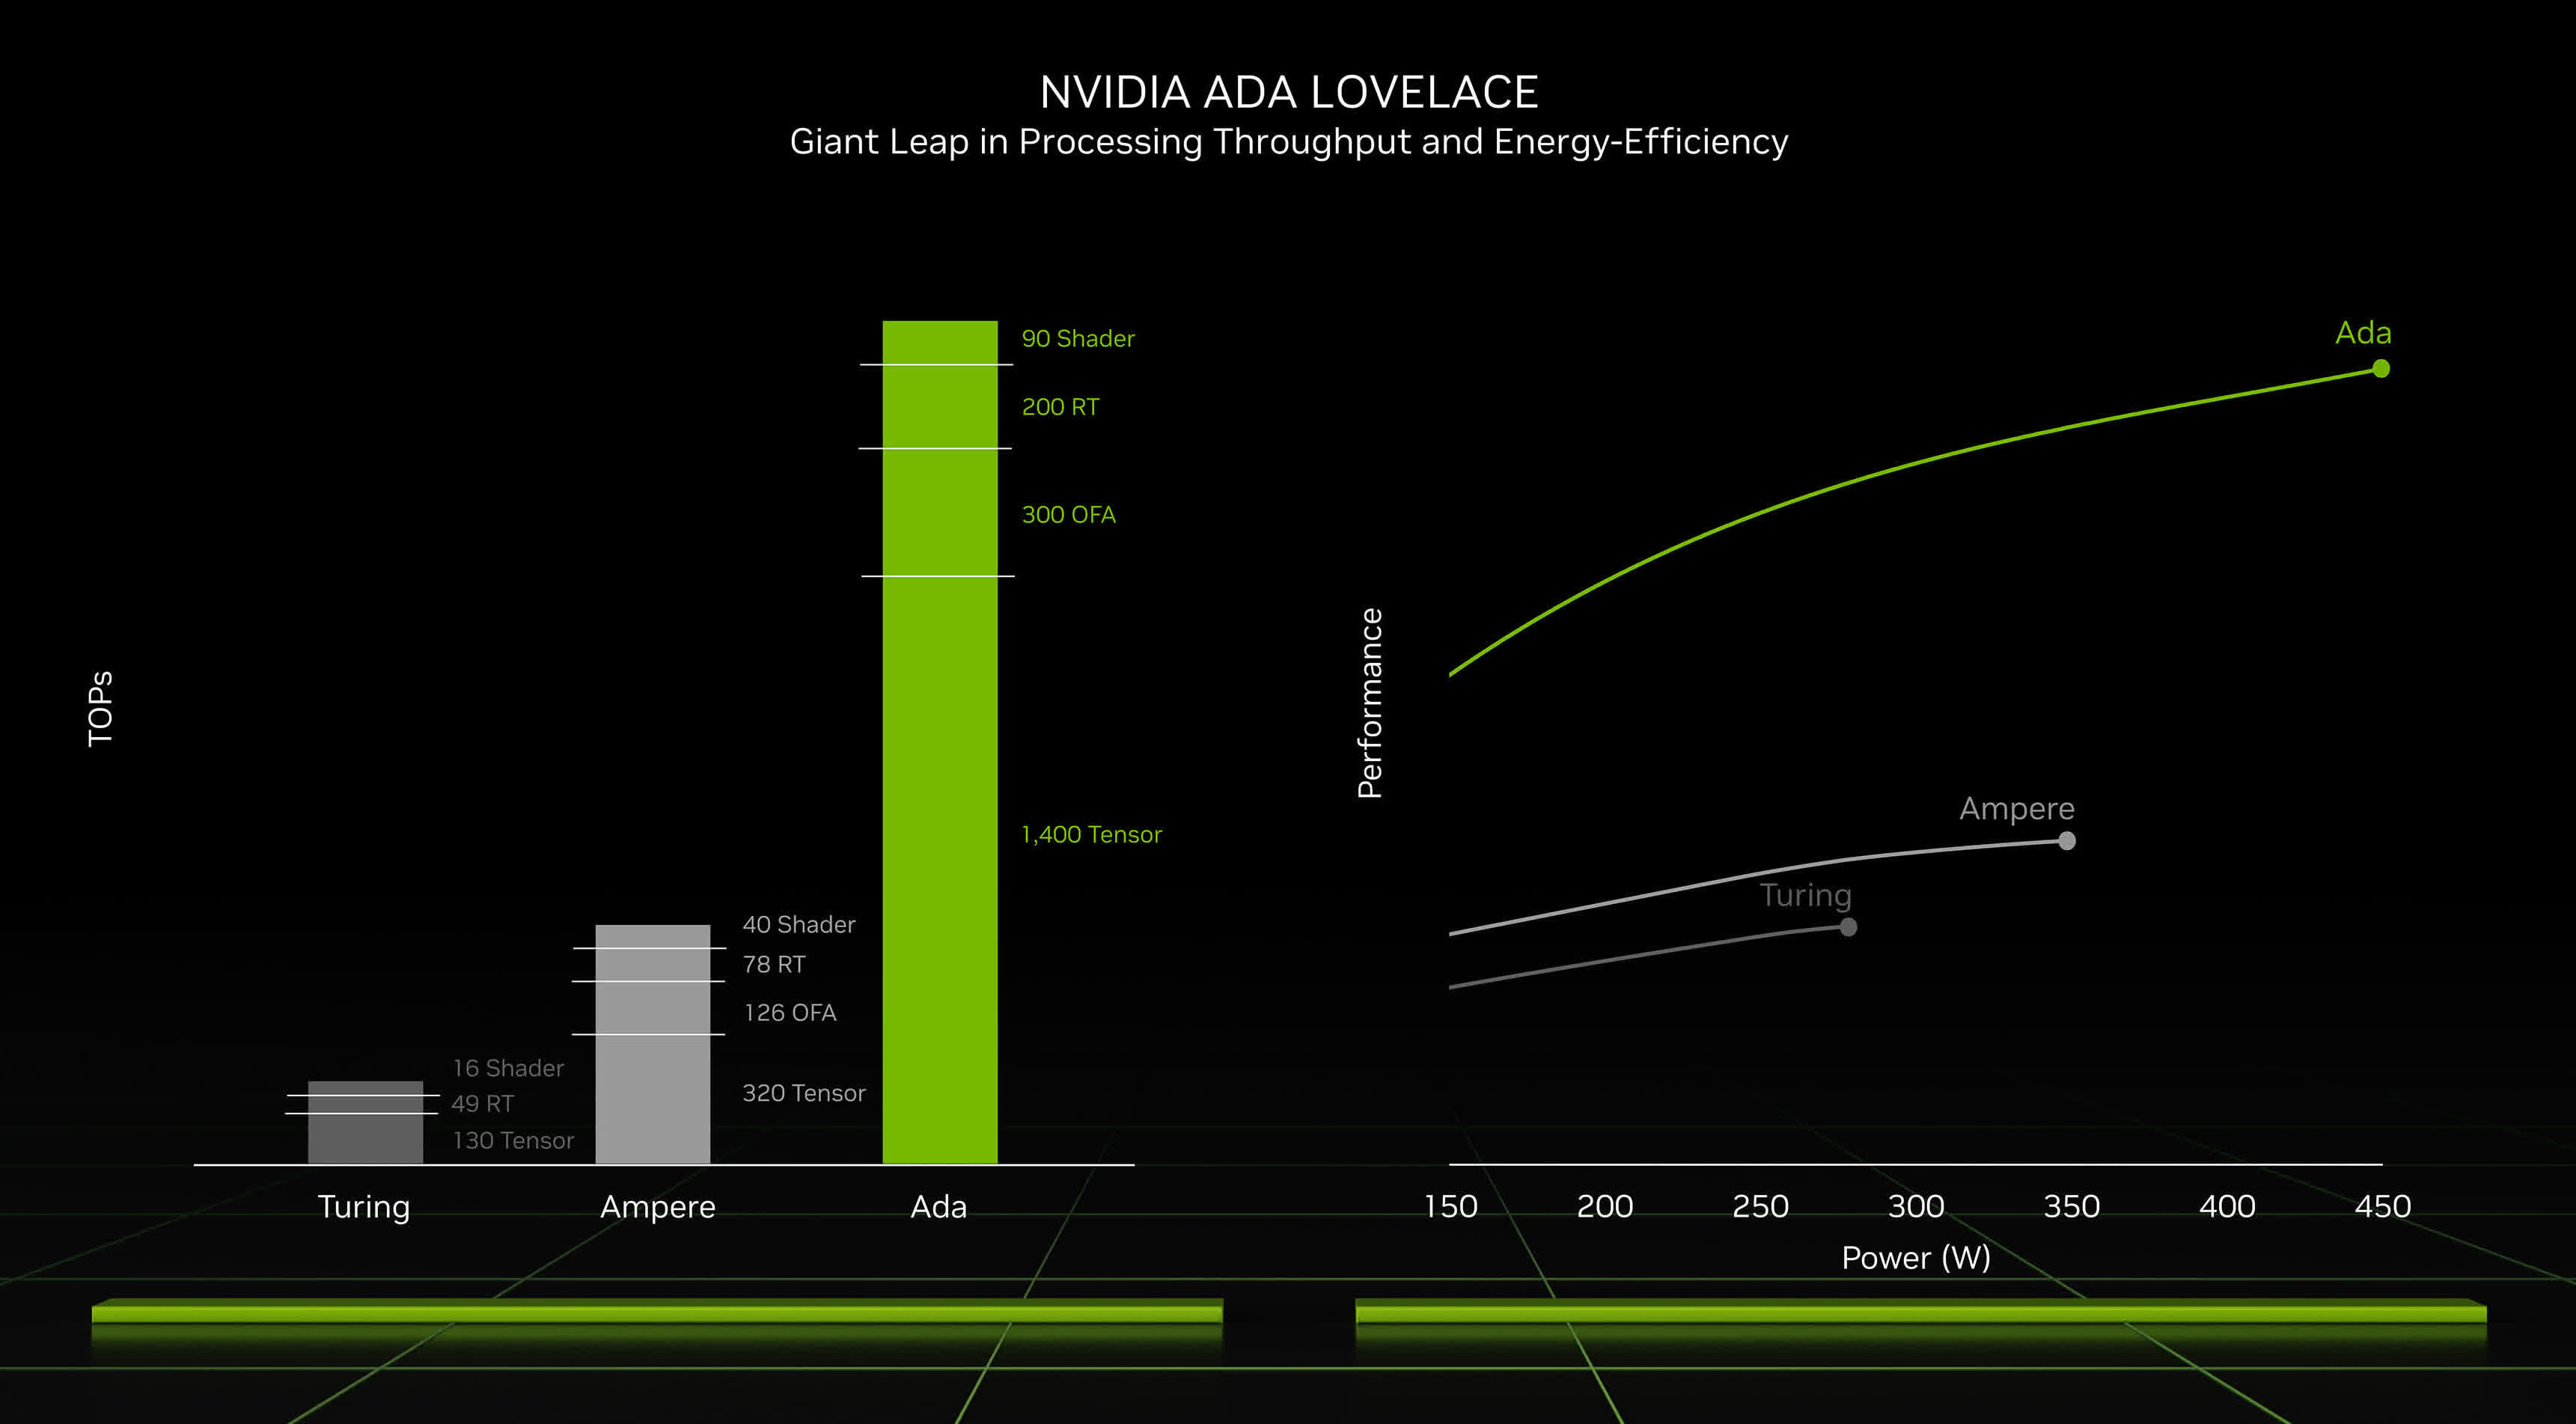
Ada Lovelace brings a range of improvements over older graphics cards utilizing the outgoing Ampere architecture. It's not just a better manufacturing process and a higher number of CUDA cores that we have here (up to 16,384 versus 10,752); under-the-hood refinements are plentiful, including an immensely larger L2 cache, an optimized ray tracing routine (a different way is employed to determine what is transparent and what isn't), and other changes. Naturally, these graphics cards can both encode and decode some of the most widely used video codecs, AVC, HEVC and AV1 included; they also support a host of Nvidia technologies, including Optimus and DLSS 3, and they can certainly be used for various AI applications.
The RTX 2000 features 24 RT cores of the 3rd generation, 96 Tensor cores of the 4th generation and 3,072 CUDA cores. Increase those numbers by 50%, and you get an RTX 3000 Ada Generation - as long as we disregard clock speed differences, of course. Unlike costlier Ada Generation professional laptop graphics cards, the RTX 2000 comes with 8 GB of non-ECC VRAM; the lack of error correction makes this card less suitable for super-important tasks and round-the-clock operation. Much like it is with the RTX 3000 Ada Generation, the VRAM is 128-bit wide and delivers a decent bandwidth of ~256 GB/s.
The RTX 2000 Ada Generation makes use of the PCI-Express 4 protocol, just like Ampere-based cards. 8K SUHD monitors are supported, however, DP 1.4a video outputs can potentially prove to be a bottleneck down the line.
Performance
The average RTX 2000 Ada in our extensive database is much closer to the RTX 4050 Laptop than it is to the RTX 4060 Laptop .
Nvidia's marketing materials mention "up to 14.5 TFLOPS" of performance, a significant downgrade compared to 20 TFLOPS delivered by the RTX 3000 Ada Generation .
Your mileage may vary depending on how competent the cooling solution of your laptop is and how high the TGP power target of the RTX 2000 Ada is.
Power consumption
Nvidia no longer divides its laptop graphics cards into Max-Q and non-max-Q models. Instead, laptop makers are free to set the TGP according to their needs, and the range can sometimes be shockingly wide. This is especially the case for the RTX 2000, as the lowest value recommended for it sits at just 35 W while the highest is 300% higher at 140 W. The slowest system built around an RTX 2000 Ada can easily be half as fast as the fastest one. This is the kind of delta that we've already seen on consumer-grade laptops featuring the latest GeForce RTX cards.
Last but not the least, the improved 5 nm process (TSMC 4N) the RTX 2000 is built with makes for very decent energy efficiency, as of mid 2023.
NVIDIA Quadro T2000 (Laptop) ► remove from comparison
The Nvidia Quadro T2000 for laptops is a professional mobile graphics card that is based on the Turing architecture (TU117 chip). It is based on the consumer desktop GTX 1650 Ti with comparable clock speeds and therefore currently between a mobile GTX 1650 and GTX 1660 Ti . The chip is manufactured in 12nm FinFET at TSMC.
The GPU features 1024 shaders, 64 texture mapping units and 32 ROPs. The 4 GB GDDR5 memory is connected with a 128-bit memory interface and clocked at 2000 MHz. At a TGP of 60W, the clock speeds are specified from 1575 MHz (base) to 1785 MHz (boost).
The Turing generation did not only introduce raytracing for the RTX cards, but also optimized the architecture of the cores and caches. According to Nvidia the CUDA cores offer now a concurrent execution of floating point and integer operations for increased performance in compute-heavy workloads of modern games. Furthermore, the caches were reworked (new unified memory architecture with twice the cache compared to Pascal). This leads to up to 50% more instructions per clock and a 40% more power efficient usage compared to Pascal. In contrary to the faster Quadro RTX cards (e.g. Quadro RTX 3000 ), the T1000 and T2000 don not feature raytracing and Tensor cores.
NVIDIA T600 Laptop GPU ► remove from comparison
The Nvidia T600 Laptop GPU (or Quadro T600 for laptops) is a professional mobile graphics card that is based on the Turing architecture (TU117 chip). It is similar to the consumer GTX 1650 with 896 CUDA cores and a 128 Bit memory bus for GDDR6 graphics memory (10 Gbits). The chip is manufactured in 12nm FinFET at TSMC. The T600 was introduced as a refresh together with the T1200 and should be slightly slower than the older Quadro T1000 (2.6 versus 2.5 TFLOPS peak SP performance).
The Turing generation did not only introduce raytracing for the RTX cards, but also optimized the architecture of the cores and caches. According to Nvidia the CUDA cores offer now a concurrent execution of floating point and integer operations for increased performance in compute-heavy workloads of modern games.
Furthermore, the caches were reworked (new unified memory architecture with twice the cache compared to Pascal). This leads to up to 50% more instructions per clock and a 40% more power efficient usage compared to Pascal. In contrary to the faster Quadro RTX cards, the T600 do not feature raytracing and Tensor cores.
Currently Nvidia only specifies the TDP of 25 Watt (the older T1000 had a TGP of 40-50 Watt). Therefore, the T600 should be well suited for thin and light laptops.
NVIDIA RTX 2000 Ada Generation Laptop GPU NVIDIA Quadro T2000 (Laptop) NVIDIA T600 Laptop GPU Quadro Turing Series Architecture Ada Lovelace Turing Turing Pipelines 3072 - unified 1024 - unified 896 - unified TMUs 96 ROPs 32 Raytracing Cores 24 Tensor / AI Cores 96 Cache L2: 32 MB Memory Speed 16000 effective = 2000 MHz 8000 MHz 10000 MHz Memory Bus Width 128 Bit 128 Bit 128 Bit Memory Type GDDR6 GDDR5 GDDR6 Max. Amount of Memory 8 GB 4 GB 4 GB Shared Memory no no no Memory Bandwidth 256 GB/s API DirectX 12 Ultimate, Shader 6.7, OpenGL 4.6, OpenCL 3.0, Vulkan 1.3 DirectX 12_1, OpenGL 4.6 DirectX 12_1, OpenGL 4.6 Power Consumption 115 Watt (35 - 115 Watt TGP) 60 Watt 40 Watt technology 5 nm 12 nm 12 nm PCIe 4 Displays 4 Displays (max.), HDMI 2.1, DisplayPort 1.4a Notebook Size large medium sized medium sized Date of Announcement 21.03.2023 27.05.2019 12.04.2021 Link to Manufacturer Page images.nvidia.com www.nvidia.com Predecessor RTX A2000 Laptop GPU Codename N19P-Q3 Core Speed 1575 - 1785 (Boost) MHz 1400 (Boost) MHz Transistors 4.7 Billion Features 2.5 TFLOPS SP max. performance, DisplayPort 1.4, HDMI 2.0b, PCIe 4.0 x8, 160 GB/s memory bandwidth
Benchmarks Performance Rating - 3DMark 11 + Fire Strike + Time Spy - T600 Laptop GPU
3.6 pt (11%)
...
...
max:
3DMark - 3DMark Time Spy Score
min: 7813 avg: 8763 median: 8849 (26%) max: 9628 Points
GPU TDP 50 W TDP 65 W TDP 80 W 81% 92% 100%
3075 Points (9%)
GPU TDP 25 W TDP 50 W TDP 65 W TDP 80 W 32% 81% 92% 100%
3DMark - 3DMark Time Spy Graphics
min: 7410 avg: 8334 median: 8433 (22%) max: 9158 Points
GPU TDP 50 W TDP 65 W TDP 80 W 81% 92% 100%
2766 Points (7%)
GPU TDP 25 W TDP 50 W TDP 65 W TDP 80 W 30% 81% 92% 100%
3DMark - 3DMark Cloud Gate Score
58198 Points (62%)
35278 Points (38%)
GPU TDP 25 W TDP 80 W 61% 100%
3DMark - 3DMark Cloud Gate Graphics
133204 Points (35%)
53941 Points (14%)
GPU TDP 25 W TDP 80 W 40% 100%
3DMark - 3DMark Fire Strike Standard Score
min: 18177 avg: 20223 median: 19987 (35%) max: 22505 Points
GPU TDP 50 W TDP 65 W TDP 80 W 81% 89% 100%
7475 Points (13%)
GPU TDP 25 W TDP 50 W TDP 65 W TDP 80 W 33% 81% 89% 100%
3DMark - 3DMark Fire Strike Standard Graphics
min: 20340 avg: 22325 median: 22039 (25%) max: 24596 Points
GPU TDP 50 W TDP 65 W TDP 80 W 83% 90% 100%
7928 Points (9%)
GPU TDP 25 W TDP 50 W TDP 65 W TDP 80 W 32% 83% 90% 100%
3DMark - 3DMark Ice Storm Graphics
75124 Points (9%)
3DMark - 3DMark Wild Life Extreme Unlimited
15840 Points (18%)
3DMark 11 - 3DM11 Performance Score
min: 25876 avg: 27504 median: 27558 (38%) max: 29077 Points
GPU TDP 50 W TDP 65 W TDP 80 W 89% 95% 100%
min: 13150 avg: 13271 median: 13271 (18%) max: 13392 Points
GPU TDP ? TDP 50 W TDP 65 W TDP 80 W 46% 89% 95% 100%
10973 Points (15%)
GPU TDP ? TDP 25 W TDP 50 W TDP 65 W TDP 80 W 46% 38% 89% 95% 100%
3DMark 11 - 3DM11 Performance GPU
min: 26968 avg: 30077 median: 30262 (26%) max: 33001 Points
GPU TDP 50 W TDP 65 W TDP 80 W 82% 92% 100%
min: 13370 avg: 13524 median: 13523.5 (12%) max: 13677 Points
GPU TDP ? TDP 50 W TDP 65 W TDP 80 W 41% 82% 92% 100%
10498 Points (9%)
GPU TDP ? TDP 25 W TDP 50 W TDP 65 W TDP 80 W 41% 32% 82% 92% 100%
3DMark Vantage + NVIDIA RTX 2000 Ada Generation Laptop GPU 3DMark Vantage - 3DM Vant. Perf. total
37844 Points (11%)
3DM Vant. Perf. total + NVIDIA T600 Laptop GPU
39112 Points (11%)
GPU TDP 25 W TDP 65 W 100% 97%
3DM Vant. Perf. GPU no PhysX + NVIDIA RTX 2000 Ada Generation Laptop GPU 3DMark Vantage - 3DM Vant. Perf. GPU no PhysX
32473 Points (18%)
3DM Vant. Perf. GPU no PhysX + NVIDIA T600 Laptop GPU
34680 Points (20%)
GPU TDP 25 W TDP 65 W 100% 94%
3DMark 06 3DMark 06 - Standard 1280x1024 + NVIDIA RTX 2000 Ada Generation Laptop GPU
53707 Points (70%)
3DMark 06 - Standard 1280x1024 + NVIDIA T600 Laptop GPU
43438 Points (57%)
GPU TDP 25 W TDP 65 W 81% 100%
Unigine Valley 1.0 - Unigine Valley 1.0 DX
34.1 fps (11%)
Blender - Blender 3.3 Classroom CUDA *
min: 51 avg: 85.7 median: 51 (8%) max: 155 Seconds
GPU TDP 50 W TDP 65 W TDP 80 W 120% 120% 100%
Blender - Blender 3.3 Classroom OPTIX *
min: 25 avg: 26.3 median: 26 (10%) max: 28 Seconds
GPU TDP 50 W TDP 65 W TDP 80 W 101% 100% 101%
SPECviewperf 12 + NVIDIA Quadro T2000 (Laptop) SPECviewperf 12 - specvp12 sw-03
106 fps (26%)
specvp12 snx-02 + NVIDIA Quadro T2000 (Laptop) SPECviewperf 12 - specvp12 snx-02
91.1 fps (13%)
specvp12 showcase-01 + NVIDIA Quadro T2000 (Laptop) SPECviewperf 12 - specvp12 showcase-01
43.9 fps (10%)
specvp12 maya-04 + NVIDIA Quadro T2000 (Laptop) SPECviewperf 12 - specvp12 maya-04
47.2 fps (13%)
specvp12 creo-01 + NVIDIA Quadro T2000 (Laptop) SPECviewperf 12 - specvp12 creo-01
101 fps (40%)
specvp12 catia-04 + NVIDIA Quadro T2000 (Laptop) SPECviewperf 12 - specvp12 catia-04
101 fps (17%)
specvp12 3dsmax-05 + NVIDIA Quadro T2000 (Laptop) SPECviewperf 12 - specvp12 3dsmax-05
111 fps (19%)
SPECviewperf 13 specvp13 sw-04 + NVIDIA RTX 2000 Ada Generation Laptop GPU SPECviewperf 13 - specvp13 sw-04
min: 173.89 avg: 181.1 median: 174.7 (47%) max: 194.75 fps
GPU TDP 50 W TDP 65 W TDP 80 W 89% 100% 90%
specvp13 sw-04 + NVIDIA Quadro T2000 (Laptop)
111 fps (30%)
GPU TDP ? TDP 50 W TDP 65 W TDP 80 W 57% 89% 100% 90%
specvp13 sw-04 + NVIDIA T600 Laptop GPU
106 fps (28%)
GPU TDP ? TDP 25 W TDP 50 W TDP 65 W TDP 80 W 57% 54% 89% 100% 90%
specvp13 snx-03 + NVIDIA RTX 2000 Ada Generation Laptop GPU SPECviewperf 13 - specvp13 snx-03
min: 315.35 avg: 333.9 median: 330 (37%) max: 356.29 fps
GPU TDP 50 W TDP 65 W TDP 80 W 89% 93% 100%
specvp13 snx-03 + NVIDIA Quadro T2000 (Laptop)
167 fps (19%)
GPU TDP ? TDP 50 W TDP 65 W TDP 80 W 47% 89% 93% 100%
specvp13 snx-03 + NVIDIA T600 Laptop GPU
137 fps (15%)
GPU TDP ? TDP 25 W TDP 50 W TDP 65 W TDP 80 W 47% 38% 89% 93% 100%
specvp13 showcase-02 + NVIDIA RTX 2000 Ada Generation Laptop GPU SPECviewperf 13 - specvp13 showcase-02
min: 79.97 avg: 85.9 median: 82.8 (18%) max: 95.04 fps
GPU TDP 50 W TDP 65 W TDP 80 W 87% 100% 84%
specvp13 showcase-02 + NVIDIA Quadro T2000 (Laptop)
42.7 fps (9%)
GPU TDP ? TDP 50 W TDP 65 W TDP 80 W 45% 87% 100% 84%
specvp13 showcase-02 + NVIDIA T600 Laptop GPU
41.4 fps (9%)
GPU TDP ? TDP 25 W TDP 50 W TDP 65 W TDP 80 W 45% 44% 87% 100% 84%
specvp13 medical-02 + NVIDIA RTX 2000 Ada Generation Laptop GPU SPECviewperf 13 - specvp13 medical-02
min: 103.3 avg: 126.4 median: 110.7 (23%) max: 165.27 fps
GPU TDP 50 W TDP 65 W TDP 80 W 63% 100% 67%
specvp13 medical-02 + NVIDIA T600 Laptop GPU
42.6 fps (9%)
GPU TDP 25 W TDP 50 W TDP 65 W TDP 80 W 26% 63% 100% 67%
specvp13 maya-05 + NVIDIA RTX 2000 Ada Generation Laptop GPU SPECviewperf 13 - specvp13 maya-05
min: 271.86 avg: 280.7 median: 276.7 (31%) max: 293.61 fps
GPU TDP 50 W TDP 65 W TDP 80 W 93% 100% 94%
specvp13 maya-05 + NVIDIA Quadro T2000 (Laptop)
125 fps (14%)
GPU TDP ? TDP 50 W TDP 65 W TDP 80 W 43% 93% 100% 94%
specvp13 maya-05 + NVIDIA T600 Laptop GPU
110 fps (12%)
GPU TDP ? TDP 25 W TDP 50 W TDP 65 W TDP 80 W 43% 37% 93% 100% 94%
specvp13 energy-02 + NVIDIA RTX 2000 Ada Generation Laptop GPU SPECviewperf 13 - specvp13 energy-02
min: 46.29 avg: 48.4 median: 49.4 (16%) max: 49.58 fps
GPU TDP 50 W TDP 65 W TDP 80 W 93% 100% 100%
specvp13 energy-02 + NVIDIA T600 Laptop GPU
16.1 fps (5%)
GPU TDP 25 W TDP 50 W TDP 65 W TDP 80 W 32% 93% 100% 100%
specvp13 creo-02 + NVIDIA RTX 2000 Ada Generation Laptop GPU SPECviewperf 13 - specvp13 creo-02
min: 249.3 avg: 258.6 median: 261.4 (38%) max: 265.15 fps
GPU TDP 50 W TDP 65 W TDP 80 W 94% 100% 99%
specvp13 creo-02 + NVIDIA Quadro T2000 (Laptop)
120 fps (18%)
GPU TDP ? TDP 50 W TDP 65 W TDP 80 W 45% 94% 100% 99%
specvp13 creo-02 + NVIDIA T600 Laptop GPU
110 fps (16%)
GPU TDP ? TDP 25 W TDP 50 W TDP 65 W TDP 80 W 45% 41% 94% 100% 99%
specvp13 catia-05 + NVIDIA RTX 2000 Ada Generation Laptop GPU SPECviewperf 13 - specvp13 catia-05
min: 257.86 avg: 293.4 median: 309.5 (34%) max: 312.95 fps
GPU TDP 50 W TDP 65 W TDP 80 W 82% 99% 100%
specvp13 catia-05 + NVIDIA Quadro T2000 (Laptop)
164 fps (18%)
GPU TDP ? TDP 50 W TDP 65 W TDP 80 W 52% 82% 99% 100%
specvp13 catia-05 + NVIDIA T600 Laptop GPU
130 fps (14%)
GPU TDP ? TDP 25 W TDP 50 W TDP 65 W TDP 80 W 52% 42% 82% 99% 100%
specvp13 3dsmax-06 + NVIDIA RTX 2000 Ada Generation Laptop GPU SPECviewperf 13 - specvp13 3dsmax-06
min: 155.94 avg: 179.7 median: 182.5 (32%) max: 200.54 fps
GPU TDP 50 W TDP 65 W TDP 80 W 91% 100% 78%
specvp13 3dsmax-06 + NVIDIA Quadro T2000 (Laptop)
111 fps (19%)
GPU TDP ? TDP 50 W TDP 65 W TDP 80 W 55% 91% 100% 78%
specvp13 3dsmax-06 + NVIDIA T600 Laptop GPU
89.8 fps (16%)
GPU TDP ? TDP 25 W TDP 50 W TDP 65 W TDP 80 W 55% 45% 91% 100% 78%
SPECviewperf 2020 specvp2020 solidworks-05 1080p + NVIDIA RTX 2000 Ada Generation Laptop GPU SPECviewperf 2020 - specvp2020 solidworks-05 1080p
min: 191.93 avg: 205.4 median: 198.6 (39%) max: 225.76 fps
GPU TDP 50 W TDP 65 W TDP 80 W 85% 88% 100%
specvp2020 solidworks-05 1080p + NVIDIA T600 Laptop GPU
73.4 fps (14%)
GPU TDP 25 W TDP 50 W TDP 65 W TDP 80 W 33% 85% 88% 100%
specvp2020 snx-04 1080p + NVIDIA RTX 2000 Ada Generation Laptop GPU SPECviewperf 2020 - specvp2020 snx-04 1080p
min: 315.31 avg: 341.5 median: 327.9 (53%) max: 381.32 fps
GPU TDP 50 W TDP 65 W TDP 80 W 83% 86% 100%
specvp2020 snx-04 1080p + NVIDIA T600 Laptop GPU
136 fps (22%)
GPU TDP 25 W TDP 50 W TDP 65 W TDP 80 W 36% 83% 86% 100%
specvp2020 medical-03 1080p + NVIDIA RTX 2000 Ada Generation Laptop GPU SPECviewperf 2020 - specvp2020 medical-03 1080p
min: 50.48 avg: 66.6 median: 57.2 (41%) max: 92.01 fps
GPU TDP 50 W TDP 65 W TDP 80 W 55% 100% 62%
specvp2020 medical-03 1080p + NVIDIA T600 Laptop GPU
18.7 fps (13%)
GPU TDP 25 W TDP 50 W TDP 65 W TDP 80 W 20% 55% 100% 62%
specvp2020 maya-06 1080p + NVIDIA RTX 2000 Ada Generation Laptop GPU SPECviewperf 2020 - specvp2020 maya-06 1080p
min: 309.59 avg: 331.5 median: 329.5 (48%) max: 355.25 fps
GPU TDP 50 W TDP 65 W TDP 80 W 87% 93% 100%
specvp2020 maya-06 1080p + NVIDIA T600 Laptop GPU
125 fps (18%)
GPU TDP 25 W TDP 50 W TDP 65 W TDP 80 W 35% 87% 93% 100%
specvp2020 energy-03 1080p + NVIDIA RTX 2000 Ada Generation Laptop GPU SPECviewperf 2020 - specvp2020 energy-03 1080p
min: 46.5 avg: 50.2 median: 49.7 (40%) max: 54.54 fps
GPU TDP 50 W TDP 65 W TDP 80 W 85% 91% 100%
specvp2020 energy-03 1080p + NVIDIA T600 Laptop GPU
16 fps (13%)
GPU TDP 25 W TDP 50 W TDP 65 W TDP 80 W 29% 85% 91% 100%
specvp2020 creo-03 1080p + NVIDIA RTX 2000 Ada Generation Laptop GPU SPECviewperf 2020 - specvp2020 creo-03 1080p
min: 96.6 avg: 118.7 median: 121.7 (60%) max: 137.93 fps
GPU TDP 50 W TDP 65 W TDP 80 W 88% 100% 70%
specvp2020 creo-03 1080p + NVIDIA T600 Laptop GPU
67.3 fps (33%)
GPU TDP 25 W TDP 50 W TDP 65 W TDP 80 W 49% 88% 100% 70%
specvp2020 catia-06 1080p + NVIDIA RTX 2000 Ada Generation Laptop GPU SPECviewperf 2020 - specvp2020 catia-06 1080p
min: 81.59 avg: 85.6 median: 84 (54%) max: 91.24 fps
GPU TDP 50 W TDP 65 W TDP 80 W 89% 92% 100%
specvp2020 catia-06 1080p + NVIDIA T600 Laptop GPU
33.1 fps (21%)
GPU TDP 25 W TDP 50 W TDP 65 W TDP 80 W 36% 89% 92% 100%
specvp2020 3dsmax-07 1080p + NVIDIA RTX 2000 Ada Generation Laptop GPU SPECviewperf 2020 - specvp2020 3dsmax-07 1080p
min: 73.7 avg: 84.5 median: 84.6 (38%) max: 95.09 fps
GPU TDP 50 W TDP 65 W TDP 80 W 78% 89% 100%
specvp2020 3dsmax-07 1080p + NVIDIA T600 Laptop GPU
40.9 fps (19%)
GPU TDP 25 W TDP 50 W TDP 65 W TDP 80 W 43% 78% 89% 100%
specvp2020 solidworks-05 4k + NVIDIA RTX 2000 Ada Generation Laptop GPU SPECviewperf 2020 - specvp2020 solidworks-05 4k
77.6 fps (23%)
specvp2020 snx-04 4k + NVIDIA RTX 2000 Ada Generation Laptop GPU SPECviewperf 2020 - specvp2020 snx-04 4k
148.1 fps (15%)
specvp2020 medical-03 4k + NVIDIA RTX 2000 Ada Generation Laptop GPU SPECviewperf 2020 - specvp2020 medical-03 4k
17 fps (16%)
specvp2020 maya-06 4k + NVIDIA RTX 2000 Ada Generation Laptop GPU SPECviewperf 2020 - specvp2020 maya-06 4k
114 fps (19%)
specvp2020 energy-03 4k + NVIDIA RTX 2000 Ada Generation Laptop GPU SPECviewperf 2020 - specvp2020 energy-03 4k
14.9 fps (3%)
specvp2020 creo-03 4k + NVIDIA RTX 2000 Ada Generation Laptop GPU SPECviewperf 2020 - specvp2020 creo-03 4k
69.2 fps (33%)
specvp2020 catia-06 4k + NVIDIA RTX 2000 Ada Generation Laptop GPU SPECviewperf 2020 - specvp2020 catia-06 4k
44.7 fps (29%)
specvp2020 3dsmax-07 4k + NVIDIA RTX 2000 Ada Generation Laptop GPU SPECviewperf 2020 - specvp2020 3dsmax-07 4k
46.8 fps (20%)
Cinebench R11.5 Cinebench R11.5 OpenGL 64 Bit + NVIDIA T600 Laptop GPU Cinebench R11.5 - Cinebench R11.5 OpenGL 64 Bit
162.3 fps (56%)
Cinebench R15 + NVIDIA RTX 2000 Ada Generation Laptop GPU Cinebench R15 - Cinebench R15 OpenGL 64 Bit
min: 223 avg: 290.3 median: 295 (17%) max: 353 fps
GPU TDP 50 W TDP 65 W TDP 80 W 63% 84% 100%
Cinebench R15 OpenGL 64 Bit + NVIDIA Quadro T2000 (Laptop)
203 fps (12%)
GPU TDP ? TDP 50 W TDP 65 W TDP 80 W 58% 63% 84% 100%
Cinebench R15 OpenGL 64 Bit + NVIDIA T600 Laptop GPU
268 fps (16%)
GPU TDP ? TDP 25 W TDP 50 W TDP 65 W TDP 80 W 58% 76% 63% 84% 100%
Cinebench R15 OpenGL Ref. Match 64 Bit + NVIDIA RTX 2000 Ada Generation Laptop GPU Cinebench R15 - Cinebench R15 OpenGL Ref. Match 64 Bit
99.6 % (100%)
GPU TDP 50 W TDP 65 W TDP 80 W 100% 100% 100%
Cinebench R15 OpenGL Ref. Match 64 Bit + NVIDIA T600 Laptop GPU
99.6 % (100%)
GPU TDP 25 W TDP 50 W TDP 65 W TDP 80 W 100% 100% 100% 100%
GFXBench - GFXBench 5.0 4K Aztec Ruins High Tier Offscreen
27 fps (11%)
GFXBench - GFXBench 5.0 Aztec Ruins High Tier Offscreen
61.4 fps (11%)
62.7 fps (11%)
GPU TDP 25 W TDP 65 W 100% 98%
GFXBench - GFXBench 5.0 Aztec Ruins Normal Tier Offscreen
162.8 fps (12%)
162.2 fps (12%)
GPU TDP 25 W TDP 65 W 100% 100%
GFXBench - GFXBench Car Chase Offscreen
145.2 fps (16%)
156.5 fps (18%)
GPU TDP 25 W TDP 65 W 100% 93%
GFXBench 3.1 - GFXBench Manhattan ES 3.1 Offscreen
193.4 fps (4%)
GFXBench 3.0 - GFXBench 3.0 Manhattan Offscreen
304.1 fps (18%)
GFXBench (DX / GLBenchmark) 2.7 + NVIDIA RTX 2000 Ada Generation Laptop GPU GFXBench (DX / GLBenchmark) 2.7 - GFXBench T-Rex HD Offscreen C24Z16
599 fps (5%)
GFXBench T-Rex HD Offscreen C24Z16 + NVIDIA T600 Laptop GPU
585 fps (5%)
GPU TDP 25 W TDP 65 W 98% 100%
Basemark GPU 1.2 - Basemark GPU 1.2 Vulkan Official Medium Offscreen 1080
min: 104.6 avg: 196.8 median: 196.8 (1%) max: 289 fps
GPU TDP 50 W TDP 65 W 36% 100%
Basemark GPU 1.2 - Basemark GPU 1.2 Vulkan Official High Offscreen 2160
3.6 fps (1%)
Geekbench 6.2 - Geekbench 6.2 GPU OpenCL
min: 75472 avg: 76342 median: 76342 (22%) max: 77212 Points
GPU TDP 50 W TDP 65 W 100% 98%
Geekbench 6.2 - Geekbench 6.2 GPU Vulkan
min: 19217 avg: 46136 median: 46136 (15%) max: 73055 Points
GPU TDP 50 W TDP 65 W 100% 26%
LuxMark v2.0 64Bit - LuxMark v2.0 Room GPU
2981 Samples/s (13%)
1166 Samples/s (5%)
GPU TDP 25 W TDP 65 W 39% 100%
LuxMark v2.0 64Bit - LuxMark v2.0 Sala GPU
6323 Samples/s (11%)
2200 Samples/s (4%)
GPU TDP 25 W TDP 65 W 35% 100%
ComputeMark v2.1 - ComputeMark v2.1 Result
14884 Points (16%)
5694 Points (6%)
GPU TDP 25 W TDP 65 W 38% 100%
Power Consumption - Furmark Stress Test Power Consumption - external Monitor *
min: 75.1 avg: 94.2 median: 87.9 (12%) max: 119.5 Watt
GPU TDP 50 W TDP 65 W TDP 80 W 108% 105% 100%
54.7 Watt (8%)
GPU TDP 25 W TDP 50 W TDP 65 W TDP 80 W 111% 108% 105% 100%
Power Consumption - The Witcher 3 Power Consumption - external Monitor *
min: 84.4 avg: 109.1 median: 101.5 (14%) max: 141.5 Watt
GPU TDP 50 W TDP 65 W TDP 80 W 110% 107% 100%
60.6 Watt (8%)
GPU TDP 25 W TDP 50 W TDP 65 W TDP 80 W 114% 110% 107% 100%
Power Consumption - Witcher 3 Power Consumption *
min: 87.9 avg: 112.5 median: 104.7 (23%) max: 144.9 Watt
GPU TDP 50 W TDP 65 W TDP 80 W 118% 113% 100%
62.3 Watt (14%)
GPU TDP 25 W TDP 50 W TDP 65 W TDP 80 W 127% 118% 113% 100%
Power Consumption - Witcher 3 ultra Power Efficiency
0.8 fps per Watt (69%)
0.4 fps per Watt (40%)
GPU TDP 25 W TDP 65 W 58% 100%
Power Consumption - Witcher 3 ultra Power Efficiency - external Monitor
0.8 fps per Watt (65%)
0.5 fps per Watt (38%)
GPU TDP 25 W TDP 65 W 58% 100%
Emissions Witcher 3 Fan Noise + NVIDIA RTX 2000 Ada Generation Laptop GPU Emissions - Witcher 3 Fan Noise
min: 40.7 avg: 44.9 median: 43.3 (69%) max: 50.6 dB(A)
GPU TDP 50 W TDP 65 W TDP 80 W 86% 80% 100%
Witcher 3 Fan Noise + NVIDIA T600 Laptop GPU
46.6 dB(A) (75%)
GPU TDP 25 W TDP 50 W TDP 65 W TDP 80 W 92% 86% 80% 100%
Average Benchmarks NVIDIA RTX 2000 Ada Generation Laptop GPU → 100% n=10 Average Benchmarks NVIDIA Quadro T2000 (Laptop) → 53% n=10 Average Benchmarks NVIDIA T600 Laptop GPU → 49% n=10
- Range of benchmark values for this graphics card
- Average benchmark values for this graphics card
* Smaller numbers mean a higher performance
1 This benchmark is not used for the average calculation
Game Benchmarks The following benchmarks stem from our benchmarks of review laptops. The performance depends on the used graphics memory, clock rate, processor, system settings, drivers, and operating systems. So the results don't have to be representative for all laptops with this GPU. For detailed information on the benchmark results, click on the fps number.
100%
NVIDIA RTX 2000 Ada Generation Laptop GPU:
113 fps
100%
NVIDIA RTX 2000 Ada Generation Laptop GPU:
103 fps
100%
NVIDIA RTX 2000 Ada Generation Laptop GPU:
97 fps
100%
NVIDIA RTX 2000 Ada Generation Laptop GPU:
76 fps
100%
NVIDIA RTX 2000 Ada Generation Laptop GPU:
58 fps
100%
NVIDIA RTX 2000 Ada Generation Laptop GPU:
85.4 [X] HP ZBook Power 15 G10 2.02
AMD Ryzen 7 PRO 7840HS 3.8GHz
NVIDIA RTX 2000 Ada Generation Laptop GPU
min:
49.2 fps, max:
119.7 fps
fps
100%
NVIDIA RTX 2000 Ada Generation Laptop GPU:
64.5 [X] HP ZBook Power 15 G10 2.02
AMD Ryzen 7 PRO 7840HS 3.8GHz
NVIDIA RTX 2000 Ada Generation Laptop GPU
min:
46.8 fps, max:
101.4 fps
fps
100%
NVIDIA RTX 2000 Ada Generation Laptop GPU:
55.2 [X] HP ZBook Power 15 G10 2.02
AMD Ryzen 7 PRO 7840HS 3.8GHz
NVIDIA RTX 2000 Ada Generation Laptop GPU
min:
41.1 fps, max:
72 fps
fps
100%
NVIDIA RTX 2000 Ada Generation Laptop GPU:
48.3 [X] HP ZBook Power 15 G10 2.02
AMD Ryzen 7 PRO 7840HS 3.8GHz
NVIDIA RTX 2000 Ada Generation Laptop GPU
min:
29.5 fps, max:
105.8 fps
fps
100%
NVIDIA RTX 2000 Ada Generation Laptop GPU:
29.9 [X] HP ZBook Power 15 G10 2.02
AMD Ryzen 7 PRO 7840HS 3.8GHz
NVIDIA RTX 2000 Ada Generation Laptop GPU
min:
24.5 fps, max:
41 fps
fps
100%
NVIDIA RTX 2000 Ada Generation Laptop GPU:
201 202 ~ 202 fps
100%
NVIDIA RTX 2000 Ada Generation Laptop GPU:
191.1 192.1 ~ 192 fps
100%
NVIDIA RTX 2000 Ada Generation Laptop GPU:
142.1 147 ~ 145 fps
100%
NVIDIA RTX 2000 Ada Generation Laptop GPU:
44.4 49.2 ~ 47 fps
100%
NVIDIA RTX 2000 Ada Generation Laptop GPU:
27.6 31.6 ~ 30 fps
100%
NVIDIA RTX 2000 Ada Generation Laptop GPU:
49 fps
100%
NVIDIA RTX 2000 Ada Generation Laptop GPU:
45 fps
100%
NVIDIA RTX 2000 Ada Generation Laptop GPU:
42 fps
100%
NVIDIA RTX 2000 Ada Generation Laptop GPU:
40 fps
100%
NVIDIA RTX 2000 Ada Generation Laptop GPU:
27 fps
100%
NVIDIA RTX 2000 Ada Generation Laptop GPU:
101 fps
100%
NVIDIA RTX 2000 Ada Generation Laptop GPU:
80 fps
100%
NVIDIA RTX 2000 Ada Generation Laptop GPU:
64 fps
100%
NVIDIA RTX 2000 Ada Generation Laptop GPU:
53 fps
100%
NVIDIA RTX 2000 Ada Generation Laptop GPU:
38 fps
100%
NVIDIA RTX 2000 Ada Generation Laptop GPU:
166.7 [X] HP ZBook Power 15 G10 959964
AMD Ryzen 7 PRO 7840HS 3.8GHz
NVIDIA RTX 2000 Ada Generation Laptop GPU
min:
143 fps, P1:
98 fps, max:
207 fps
213 ~ 190 fps
100%
NVIDIA RTX 2000 Ada Generation Laptop GPU:
151.8 [X] HP ZBook Power 15 G10 959964
AMD Ryzen 7 PRO 7840HS 3.8GHz
NVIDIA RTX 2000 Ada Generation Laptop GPU
min:
137 fps, P1:
92 fps, max:
171 fps
193.2 ~ 173 fps
100%
NVIDIA RTX 2000 Ada Generation Laptop GPU:
119.9 [X] HP ZBook Power 15 G10 959964
AMD Ryzen 7 PRO 7840HS 3.8GHz
NVIDIA RTX 2000 Ada Generation Laptop GPU
min:
104 fps, P1:
74 fps, max:
129 fps
138.5 ~ 129 fps
100%
NVIDIA RTX 2000 Ada Generation Laptop GPU:
44.2 [X] HP ZBook Power 15 G10 959964
AMD Ryzen 7 PRO 7840HS 3.8GHz
NVIDIA RTX 2000 Ada Generation Laptop GPU
min:
38 fps, P1:
37 fps, max:
51 fps
52.8 ~ 49 fps
100%
NVIDIA RTX 2000 Ada Generation Laptop GPU:
28.9 [X] HP ZBook Power 15 G10 959964
AMD Ryzen 7 PRO 7840HS 3.8GHz
NVIDIA RTX 2000 Ada Generation Laptop GPU
min:
24 fps, P1:
24 fps, max:
33 fps
34.2 ~ 32 fps
100%
NVIDIA RTX 2000 Ada Generation Laptop GPU:
119.8 fps
48%
T600 Laptop GPU:
57.5 fps
100%
NVIDIA RTX 2000 Ada Generation Laptop GPU:
110.5 fps
30%
T600 Laptop GPU:
32.8 fps
100%
NVIDIA RTX 2000 Ada Generation Laptop GPU:
77.3 fps
62%
T600 Laptop GPU:
48.3 fps
100%
NVIDIA RTX 2000 Ada Generation Laptop GPU:
62.3 fps
44%
T600 Laptop GPU:
27.2 fps
100%
NVIDIA RTX 2000 Ada Generation Laptop GPU:
43.5 fps
100%
NVIDIA RTX 2000 Ada Generation Laptop GPU:
101 fps
100%
NVIDIA RTX 2000 Ada Generation Laptop GPU:
81 fps
100%
NVIDIA RTX 2000 Ada Generation Laptop GPU:
72 fps
100%
NVIDIA RTX 2000 Ada Generation Laptop GPU:
65 fps
100%
NVIDIA RTX 2000 Ada Generation Laptop GPU:
41 fps
T600 Laptop GPU:
104.1 fps
T600 Laptop GPU:
175.4 fps
100%
NVIDIA RTX 2000 Ada Generation Laptop GPU:
157 fps
100%
NVIDIA RTX 2000 Ada Generation Laptop GPU:
121 fps
100%
NVIDIA RTX 2000 Ada Generation Laptop GPU:
104 fps
100%
NVIDIA RTX 2000 Ada Generation Laptop GPU:
87 fps
100%
NVIDIA RTX 2000 Ada Generation Laptop GPU:
63 fps
100%
NVIDIA RTX 2000 Ada Generation Laptop GPU:
353 fps
100%
NVIDIA RTX 2000 Ada Generation Laptop GPU:
230 fps
100%
NVIDIA RTX 2000 Ada Generation Laptop GPU:
186.6 fps
100%
NVIDIA RTX 2000 Ada Generation Laptop GPU:
99.2 fps
100%
NVIDIA RTX 2000 Ada Generation Laptop GPU:
74.9 fps
T600 Laptop GPU:
113.6 fps
100%
NVIDIA RTX 2000 Ada Generation Laptop GPU:
332 [X] HP ZBook Power 15 G10 1.47.22.14 D3D12
AMD Ryzen 7 PRO 7840HS 3.8GHz
NVIDIA RTX 2000 Ada Generation Laptop GPU
min:
112.3 fps, P1:
251 fps, max:
511 fps
408 459 ~ 400 fps
48%
T600 Laptop GPU:
190.4 fps
100%
NVIDIA RTX 2000 Ada Generation Laptop GPU:
183 [X] HP ZBook Power 15 G10 1.47.22.14 D3D12
AMD Ryzen 7 PRO 7840HS 3.8GHz
NVIDIA RTX 2000 Ada Generation Laptop GPU
min:
88.1 fps, P1:
152.3 fps, max:
359 fps
228 231 ~ 214 fps
36%
T600 Laptop GPU:
76.2 fps
100%
NVIDIA RTX 2000 Ada Generation Laptop GPU:
148.4 [X] HP ZBook Power 15 G10 1.47.22.14 D3D12
AMD Ryzen 7 PRO 7840HS 3.8GHz
NVIDIA RTX 2000 Ada Generation Laptop GPU
min:
37.9 fps, P1:
110.3 fps, max:
328 fps
182.5 184.2 ~ 172 fps
35%
T600 Laptop GPU:
60.7 fps
100%
NVIDIA RTX 2000 Ada Generation Laptop GPU:
132.5 [X] HP ZBook Power 15 G10 1.47.22.14 D3D12
AMD Ryzen 7 PRO 7840HS 3.8GHz
NVIDIA RTX 2000 Ada Generation Laptop GPU
min:
80.3 fps, P1:
100.2 fps, max:
303 fps
158.2 158.4 ~ 150 fps
35%
T600 Laptop GPU:
52.7 fps
100%
NVIDIA RTX 2000 Ada Generation Laptop GPU:
94.1 [X] HP ZBook Power 15 G10 1.47.22.14 D3D12
AMD Ryzen 7 PRO 7840HS 3.8GHz
NVIDIA RTX 2000 Ada Generation Laptop GPU
min:
60.9 fps, P1:
75.7 fps, max:
170 fps
103.9 107.5 ~ 102 fps
100%
NVIDIA RTX 2000 Ada Generation Laptop GPU:
151 [X] HP ZBook Power 15 G10 AMD Ryzen 7 PRO 7840HS 3.8GHz
NVIDIA RTX 2000 Ada Generation Laptop GPU
min:
105 fps, max:
196 fps
175 ~ 163 fps
64%
T600 Laptop GPU:
105 fps
100%
NVIDIA RTX 2000 Ada Generation Laptop GPU:
110 [X] HP ZBook Power 15 G10 AMD Ryzen 7 PRO 7840HS 3.8GHz
NVIDIA RTX 2000 Ada Generation Laptop GPU
min:
96 fps, max:
127 fps
130 ~ 120 fps
44%
T600 Laptop GPU:
53 fps
100%
NVIDIA RTX 2000 Ada Generation Laptop GPU:
102 [X] HP ZBook Power 15 G10 AMD Ryzen 7 PRO 7840HS 3.8GHz
NVIDIA RTX 2000 Ada Generation Laptop GPU
min:
92 fps, max:
123 fps
120 ~ 111 fps
44%
T600 Laptop GPU:
49 fps
100%
NVIDIA RTX 2000 Ada Generation Laptop GPU:
95 [X] HP ZBook Power 15 G10 AMD Ryzen 7 PRO 7840HS 3.8GHz
NVIDIA RTX 2000 Ada Generation Laptop GPU
min:
86 fps, max:
111 fps
113 ~ 104 fps
43%
T600 Laptop GPU:
45 fps
100%
NVIDIA RTX 2000 Ada Generation Laptop GPU:
63 [X] HP ZBook Power 15 G10 AMD Ryzen 7 PRO 7840HS 3.8GHz
NVIDIA RTX 2000 Ada Generation Laptop GPU
min:
56 fps, max:
76 fps
81 ~ 72 fps
100%
NVIDIA RTX 2000 Ada Generation Laptop GPU:
80.6 149.2 156.5 ~ 129 fps
84%
T600 Laptop GPU:
107.9 fps
100%
NVIDIA RTX 2000 Ada Generation Laptop GPU:
73 131.6 133.5 ~ 113 fps
82%
T600 Laptop GPU:
92.4 fps
100%
NVIDIA RTX 2000 Ada Generation Laptop GPU:
52.5 103.4 108.9 ~ 88 fps
88%
T600 Laptop GPU:
77 fps
100%
NVIDIA RTX 2000 Ada Generation Laptop GPU:
173.3 199.2 ~ 186 fps
46%
T600 Laptop GPU:
86 fps
100%
NVIDIA RTX 2000 Ada Generation Laptop GPU:
93.5 111.2 120.3 ~ 108 fps
41%
T600 Laptop GPU:
43.9 fps
100%
NVIDIA RTX 2000 Ada Generation Laptop GPU:
67.7 83.5 84.2 ~ 78 fps
40%
T600 Laptop GPU:
31 fps
100%
NVIDIA RTX 2000 Ada Generation Laptop GPU:
50.3 61.3 63.7 ~ 58 fps
100%
NVIDIA RTX 2000 Ada Generation Laptop GPU:
155 [X] HP ZBook Power 15 G10 AMD Ryzen 7 PRO 7840HS 3.8GHz
NVIDIA RTX 2000 Ada Generation Laptop GPU
min:
138.6 fps, max:
-1 fps
178.4 188.2 ~ 174 fps
86%
T600 Laptop GPU:
149.4 fps
100%
NVIDIA RTX 2000 Ada Generation Laptop GPU:
140.8 [X] HP ZBook Power 15 G10 AMD Ryzen 7 PRO 7840HS 3.8GHz
NVIDIA RTX 2000 Ada Generation Laptop GPU
min:
125.7 fps, max:
-1 fps
153.1 168.7 ~ 154 fps
83%
T600 Laptop GPU:
127.6 fps
100%
NVIDIA RTX 2000 Ada Generation Laptop GPU:
136.9 [X] HP ZBook Power 15 G10 AMD Ryzen 7 PRO 7840HS 3.8GHz
NVIDIA RTX 2000 Ada Generation Laptop GPU
min:
120 fps, max:
-1 fps
143.9 160.7 ~ 147 fps
79%
T600 Laptop GPU:
115.8 fps
100%
NVIDIA RTX 2000 Ada Generation Laptop GPU:
132 [X] HP ZBook Power 15 G10 AMD Ryzen 7 PRO 7840HS 3.8GHz
NVIDIA RTX 2000 Ada Generation Laptop GPU
min:
115.8 fps, max:
-1 fps
133.4 150.2 ~ 139 fps
77%
T600 Laptop GPU:
107.1 fps
100%
NVIDIA RTX 2000 Ada Generation Laptop GPU:
336.4 [X] HP ZBook Power 15 G10 AMD Ryzen 7 PRO 7840HS 3.8GHz
NVIDIA RTX 2000 Ada Generation Laptop GPU
min:
296 fps, max:
364 fps
390 424 ~ 383 fps
41%
T600 Laptop GPU:
158.6 fps
100%
NVIDIA RTX 2000 Ada Generation Laptop GPU:
219 [X] HP ZBook Power 15 G10 AMD Ryzen 7 PRO 7840HS 3.8GHz
NVIDIA RTX 2000 Ada Generation Laptop GPU
min:
202 fps, max:
234 fps
261 291 ~ 257 fps
36%
T600 Laptop GPU:
92.7 fps
100%
NVIDIA RTX 2000 Ada Generation Laptop GPU:
127.9 [X] HP ZBook Power 15 G10 AMD Ryzen 7 PRO 7840HS 3.8GHz
NVIDIA RTX 2000 Ada Generation Laptop GPU
min:
111 fps, max:
139 fps
164 184.5 ~ 159 fps
33%
T600 Laptop GPU:
52.2 fps
100%
NVIDIA RTX 2000 Ada Generation Laptop GPU:
65.5 [X] HP ZBook Power 15 G10 AMD Ryzen 7 PRO 7840HS 3.8GHz
NVIDIA RTX 2000 Ada Generation Laptop GPU
min:
61 fps, max:
72 fps
79.6 95.6 ~ 80 fps
35%
T600 Laptop GPU:
27.6 fps
100%
NVIDIA RTX 2000 Ada Generation Laptop GPU:
65 fps
100%
NVIDIA RTX 2000 Ada Generation Laptop GPU:
176.3 178.1 [X] HP ZBook Power 15 G10 AMD Ryzen 7 PRO 7840HS 3.8GHz
NVIDIA RTX 2000 Ada Generation Laptop GPU
min:
3.76 fps, P1:
125 fps, max:
365 fps
185.2 ~ 180 fps
79%
T600 Laptop GPU:
142.6 fps
100%
NVIDIA RTX 2000 Ada Generation Laptop GPU:
170.6 [X] HP ZBook Power 15 G10 AMD Ryzen 7 PRO 7840HS 3.8GHz
NVIDIA RTX 2000 Ada Generation Laptop GPU
min:
3.86 fps, P1:
111.1 fps, max:
347 fps
173.4 181.3 ~ 175 fps
79%
T600 Laptop GPU:
137.6 fps
100%
NVIDIA RTX 2000 Ada Generation Laptop GPU:
157.7 [X] HP ZBook Power 15 G10 AMD Ryzen 7 PRO 7840HS 3.8GHz
NVIDIA RTX 2000 Ada Generation Laptop GPU
min:
4.55 fps, P1:
111.1 fps, max:
325 fps
163.6 171.9 173 ~ 167 fps
49%
T600 Laptop GPU:
82.3 fps
100%
NVIDIA RTX 2000 Ada Generation Laptop GPU:
86.2 [X] HP ZBook Power 15 G10 AMD Ryzen 7 PRO 7840HS 3.8GHz
NVIDIA RTX 2000 Ada Generation Laptop GPU
min:
7.39 fps, P1:
55.6 fps, max:
153.8 fps
98 101.6 ~ 95 fps
46%
T600 Laptop GPU:
44.1 fps
100%
NVIDIA RTX 2000 Ada Generation Laptop GPU:
60.6 [X] HP ZBook Power 15 G10 AMD Ryzen 7 PRO 7840HS 3.8GHz
NVIDIA RTX 2000 Ada Generation Laptop GPU
min:
9.07 fps, P1:
41.7 fps, max:
122.1 fps
69 74.6 76.8 ~ 70 fps
Average Gaming NVIDIA RTX 2000 Ada Generation Laptop GPU → 100% Average Gaming 30-70 fps → 100%
Average Gaming NVIDIA T600 Laptop GPU → 55% Average Gaming 30-70 fps → 42%
 Deutsch
 English
 Español
 Français
 Italiano
 Nederlands
 Polski
 Português
 Русский
 Türkçe
 Svenska
 Chinese
 Magyar