NVIDIA GeForce RTX 4070 SUPER vs NVIDIA RTX 3000 Ada Generation Laptop GPU
NVIDIA GeForce RTX 4070 SUPER ► remove from comparison
The Nvidia GeForce RTX 4070 SUPER is a high-end desktop graphics card based on the Ada Lovelace architecture. It uses the AD104 chip and offers 7,168 cores and 12 GB GDDR6X graphics memory (192-bit bus with 21 Gbits).
The performance of the RTX 4070S lies between the older RTX 4070 and RTX 4070 Ti in the top class of high-end GPUs in 2024. Compared to AMD GPUs, the 4070 Super is similar fast as the AMD Radeon RX 7800 XT . This makes the GPU best suited for QHD and maximum details of demanding games (such as Avatar Frontiers of Pandora, Allan Wake 2, Cyberpunk 2033 or F1 23). Less demanding games can also be played smoothly in 4K (AC Mirage, Cod MW 3, ...).
The AD104 chip is produced at TSMC in 5 nm (4N with EUV) and is specified with a TGP (Total Graphics Power) of 200 watts.
NVIDIA RTX 3000 Ada Generation Laptop GPU ► remove from comparison
The Nvidia RTX 3000 Ada Generation , not to be confused with the A3000 , P3000 or RTX 3000 Turing Generation , is a higher-end professional graphics card for use in laptops that sports 4,608 CUDA cores and 8 GB of ECC GDDR6 VRAM (error correction can be turned off if desired). It would be fair to say that this is a GeForce RTX 4070 Laptop in disguise; consequently, the graphics card is fast enough for many games at 1440p with quality set to High. Brought into existence in 2023, the RTX 3000 leverages TSMC's 5 nm process and Nvidia's Ada Lovelace architecture to achieve very decent performance combined with moderate power consumption. The Nvidia-recommended TGP range for the card is very wide at 35 W to 140 W leading to bizarre performance differences between different systems powered by what is supposed to be the same product.
Quadro series graphics cards ship with much different BIOS and drivers than GeForce cards and are targeted at professional use rather than gaming. Commercial product design, large-scale calculations, simulation, data mining, 24 x 7 operation, certified drivers - if any of this sounds familiar, then a Quadro card will make you happy.
Architecture and Features
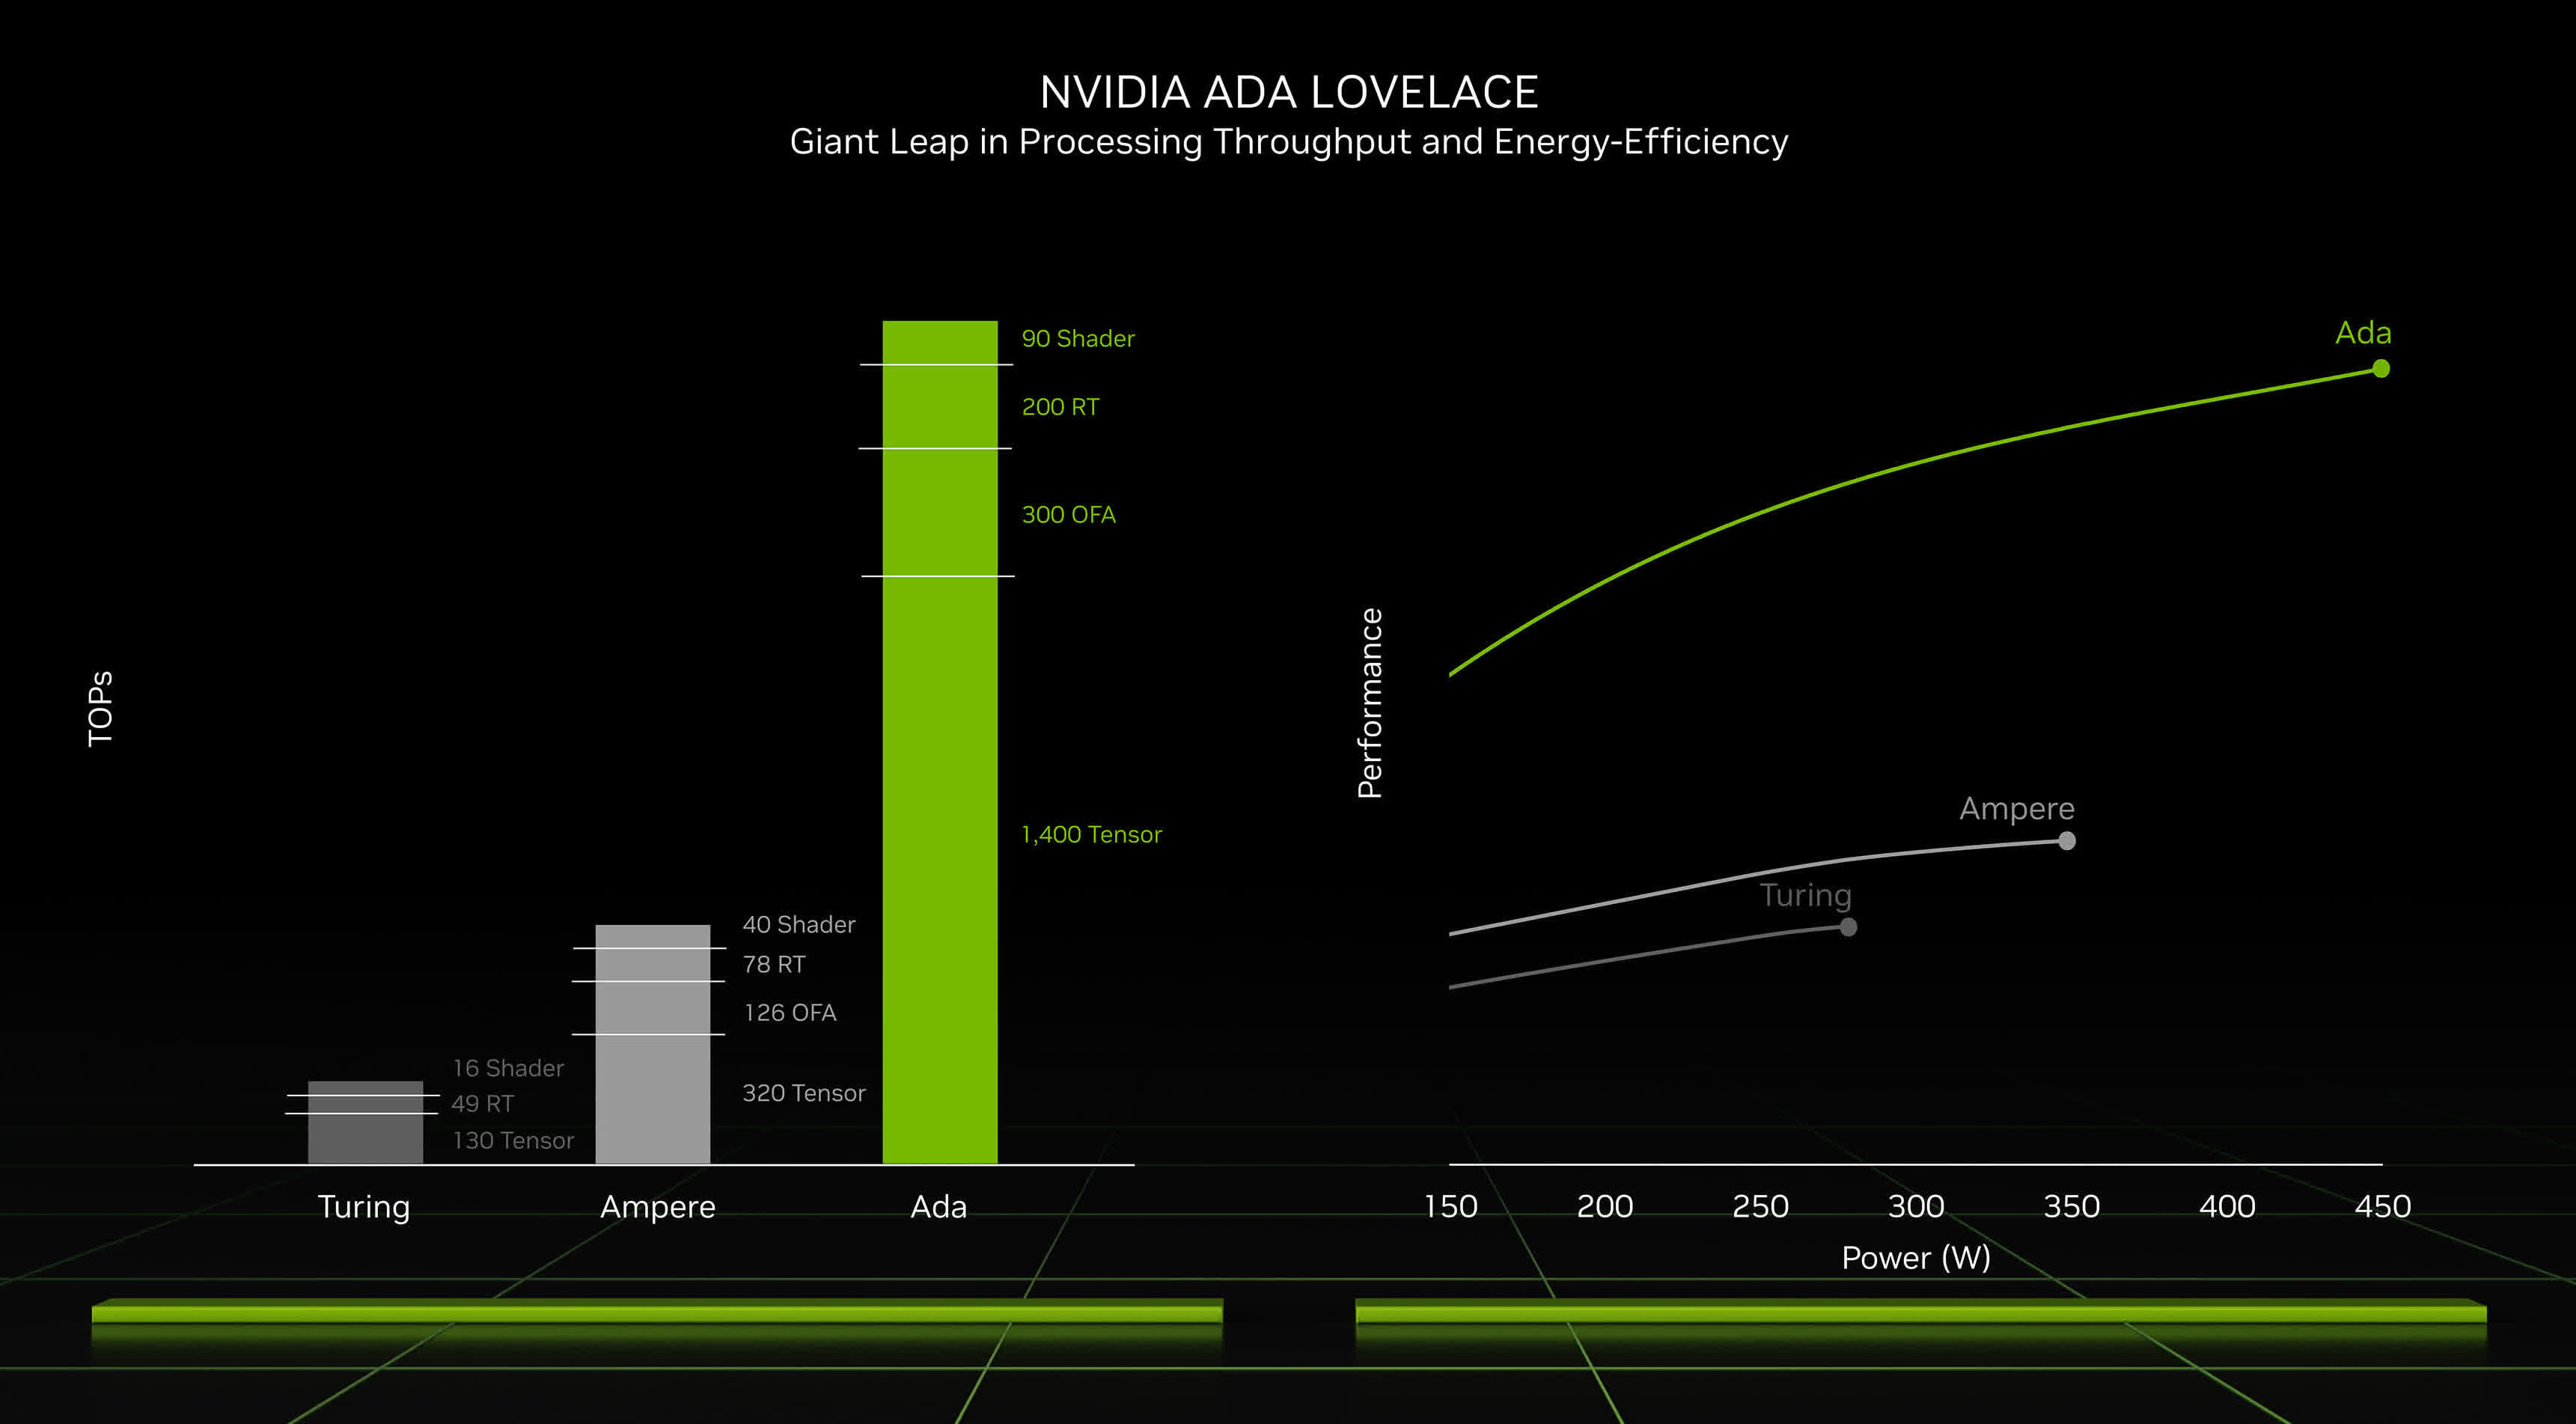
Ada Lovelace brings a range of improvements over older graphics cards utilizing the outgoing Ampere architecture. It's not just a better manufacturing process and a higher number of CUDA cores that we have here (up to 16,384 versus 10,752); under-the-hood refinements are plentiful, including an immensely larger L2 cache, an optimized ray tracing routine (a smarter technique is used to determine what is transparent and what isn't), and other changes. Naturally, these graphics cards can both encode and decode some of the most widely used video codecs, AVC, HEVC and AV1 included; they also support a host of Nvidia technologies, including Optimus and DLSS 3, and they can certainly be used for various AI tasks.
The RTX 3000 Ada features 36 RT cores of the 3rd generation, 144 Tensor cores of the 4th generation and 4,608 CUDA cores, making it ~11% inferior to the RTX 3500 Ada Generation as long as we disregard clock speed differences. (The 3500 also has more VRAM). The RTX 3000 comes with 8 GB of 128-bit wide ECC GDDR6 memory for throughput of ~256 GB/s. The fact that error correction is present here proves that the graphics adapter is indeed targeted at professional users, and it can be disabled if desired.
Just like Ampere-based cards, the RTX 3000 makes use of the PCI-Express 4 protocol. 8K SUHD monitors are supported, however, DP 1.4a video outputs can potentially prove to be a bottleneck down the line.
Performance
Having reviewed the Dell Precision 5480 and its 50 W RTX 3000 Ada in September 2023, we can firmly say the graphics card is in the same league as the RTX 4060 Laptop and the RTX 4050 Laptop , despite sharing most of its specifications with the RTX 4070 Laptop . 48 seconds in the Blender 3.3 Classroom CUDA test and a 3DMark 11 Performance GPU score of less than 30,000 points are nothing to write home about. The GPU's gaming talents are not mind-blowing, either, although it is certainly capable enough for 1080p gaming.
Nvidia's marketing materials mention "up to 20 TFLOPS" of performance, a very noticeable improvement over 14.5 TFLOPS delivered by the RTX 2000 Ada Generation. Your mileage may vary depending on how competent the cooling solution of your laptop is and how high the TGP power target of the graphics card is. A 100 W RTX 3000 Ada might be able to come close to the average RTX 4070 Laptop.
One other thing worth mentioning is that enabling error correction appears to reduce the amount of video memory that is available to applications and games by up to a gigabyte.
Power consumption
Nvidia no longer divides its laptop graphics cards into Max-Q and non-max-Q models. Instead, laptop makers are free to set the TGP according to their needs, and the range can sometimes be shockingly wide. This is especially the case for the RTX 3000, as the lowest value recommended for it sits at just 35 W while the highest is 300% higher at 140 W (this most likely includes Dynamic Boost). This is the kind of delta that we've be seeing on consumer-grade laptops featuring the latest GeForce RTX cards.
Last but not the least, the improved 5 nm process (TSMC 4N) the RTX 3000 Ada is built with makes for very decent energy efficiency, as of mid 2023.
NVIDIA GeForce RTX 4070 SUPER NVIDIA RTX 3000 Ada Generation Laptop GPU RTX Ada Generation Laptop GPU Series Codename AD104 Architecture Ada Lovelace Ada Lovelace Pipelines 7168 - unified 4608 - unified TMUs 224 144 ROPs 80 48 Raytracing Cores 56 36 Tensor / AI Cores 224 144 Core Speed 1980 - 2475 (Boost) MHz Theoretical Performance 35.5 TFLOPS FP16, 35.5 TFLOPS FP32, 0.55 TFLOPS FP64 Cache L2: 48 MB L2: 32 MB Memory Speed 21000 effective = 1313 MHz 16000 effective = 2000 MHz Memory Bus Width 192 Bit 128 Bit Memory Type GDDR6X GDDR6 Max. Amount of Memory 12 GB 8 GB Shared Memory no no Memory Bandwidth 504.2 GB/s 256 GB/s API DirectX 12 Ultimate, Shader 6.7, OpenGL 4.6, OpenCL 3.0, Vulkan 1.3 DirectX 12 Ultimate, Shader 6.7, OpenGL 4.6, OpenCL 3.0, Vulkan 1.3 Power Consumption 220 Watt 115 Watt (35 - 115 Watt TGP) Transistors 35.8 Billion Die Size 295 mm² technology 5 nm 5 nm PCIe 4.0 x16 4.0 x16 Displays 4 Displays (max.), HDMI 2.1, DisplayPort 1.4a 4 Displays (max.), HDMI 2.1, DisplayPort 1.4a Date of Announcement 17.01.2024 21.03.2023 Predecessor NVIDIA GeForce RTX 4070 Quadro RTX 3000 (Laptop) Notebook Size large Link to Manufacturer Page images.nvidia.com
Benchmarks Performance Rating - 3DMark 11 + Fire Strike + Time Spy - NVIDIA GeForce RTX 4070 SUPER
22.3 pt (67%)
...
NVIDIA GeForce RTX 4070 SUPER
...
3DMark - 3DMark Time Spy Score
min: 21080 avg: 21186 median: 21186 (61%) max: 21292 Points
min: 8254 avg: 8533 median: 8532.5 (25%) max: 8811 Points
GPU TDP ? TDP 50 W 100% 52%
3DMark - 3DMark Time Spy Graphics
min: 20867 avg: 20992 median: 20992 (56%) max: 21117 Points
min: 7959 avg: 8155 median: 8155 (22%) max: 8351 Points
GPU TDP ? TDP 50 W 100% 50%
3DMark - 3DMark Ice Storm Unlimited Graphics
min: 763636 avg: 766679 median: 766678 (87%) max: 769721 Points
3DMark - 3DMark Ice Storm Extreme Graphics
min: 515758 avg: 517177 median: 517176 (66%) max: 518595 Points
3DMark - 3DMark Cloud Gate Score
min: 81504 avg: 81898 median: 81897.5 (88%) max: 82291 Points
45774 Points (49%)
3DMark - 3DMark Cloud Gate Graphics
min: 170014 avg: 171098 median: 171098 (45%) max: 172182 Points
82612 Points (22%)
3DMark - 3DMark Fire Strike Standard Score
min: 39061 avg: 40120 median: 40119.5 (71%) max: 41178 Points
min: 18368 avg: 18608 median: 18607.5 (33%) max: 18847 Points
GPU TDP ? TDP 50 W 100% 57%
3DMark - 3DMark Fire Strike Standard Graphics
min: 48043 avg: 48876 median: 48876 (55%) max: 49709 Points
min: 20233 avg: 20571 median: 20570.5 (23%) max: 20908 Points
GPU TDP ? TDP 50 W 100% 53%
3DMark - 3DMark Ice Storm Graphics
min: 559629 avg: 564567 median: 564567 (68%) max: 569505 Points
3DMark - 3DMark Wild Life Unlimited
min: 134699 avg: 135490 median: 135490 (68%) max: 136280 Points
3DMark - 3DMark Wild Life Extreme Unlimited
min: 41082 avg: 41368 median: 41368 (48%) max: 41654 Points
3DMark - 3DMark Night Raid
min: 89236 avg: 89795 median: 89795 (85%) max: 90354 Points
3DMark - 3DMark Night Raid Graphics Score
min: 195290 avg: 198557 median: 198556 (76%) max: 201823 Points
3DMark 11 - 3DM11 Performance Score
min: 51107 avg: 51340 median: 51339.5 (71%) max: 51572 Points
min: 25317 avg: 26200 median: 26200 (36%) max: 27083 Points
GPU TDP ? TDP 50 W 100% 63%
3DMark 11 - 3DM11 Performance GPU
min: 67852 avg: 68373 median: 68373 (59%) max: 68894 Points
min: 28283 avg: 28847 median: 28847 (25%) max: 29411 Points
GPU TDP ? TDP 50 W 100% 53%
Unigine Valley 1.0 - Unigine Valley 1.0 DX
min: 213.8 avg: 214.6 median: 214.6 (70%) max: 215.3 fps
Blender - Blender 3.3 Classroom CUDA *
19 Seconds (3%)
min: 44 avg: 46 median: 46 (7%) max: 48 Seconds
GPU TDP ? TDP 50 W 103% 100%
Blender - Blender 3.3 Classroom OPTIX *
11 Seconds (4%)
min: 27 avg: 27.5 median: 27.5 (10%) max: 28 Seconds
GPU TDP ? TDP 50 W 105% 100%
SPECviewperf 12 + NVIDIA RTX 3000 Ada Generation Laptop GPU SPECviewperf 12 - specvp12 sw-03
min: 159.9 avg: 171.9 median: 171.9 (43%) max: 183.9 fps
GPU TDP ? TDP 50 W 87% 100%
specvp12 snx-02 + NVIDIA RTX 3000 Ada Generation Laptop GPU SPECviewperf 12 - specvp12 snx-02
min: 163.39 avg: 169.1 median: 169.1 (25%) max: 174.85 fps
GPU TDP ? TDP 50 W 100% 93%
specvp12 showcase-01 + NVIDIA RTX 3000 Ada Generation Laptop GPU SPECviewperf 12 - specvp12 showcase-01
min: 88.34 avg: 90.2 median: 90.2 (20%) max: 91.96 fps
GPU TDP ? TDP 50 W 100% 96%
specvp12 maya-04 + NVIDIA RTX 3000 Ada Generation Laptop GPU SPECviewperf 12 - specvp12 maya-04
min: 133.1 avg: 138 median: 138 (38%) max: 142.99 fps
GPU TDP ? TDP 50 W 93% 100%
specvp12 creo-01 + NVIDIA RTX 3000 Ada Generation Laptop GPU SPECviewperf 12 - specvp12 creo-01
min: 123.21 avg: 136.8 median: 136.8 (55%) max: 150.32 fps
GPU TDP ? TDP 50 W 82% 100%
specvp12 catia-04 + NVIDIA RTX 3000 Ada Generation Laptop GPU SPECviewperf 12 - specvp12 catia-04
min: 174.33 avg: 186.4 median: 186.4 (31%) max: 198.45 fps
GPU TDP ? TDP 50 W 88% 100%
SPECviewperf 13 specvp13 sw-04 + NVIDIA RTX 3000 Ada Generation Laptop GPU SPECviewperf 13 - specvp13 sw-04
min: 162.23 avg: 170.7 median: 170.7 (46%) max: 179.23 fps
GPU TDP ? TDP 50 W 91% 100%
specvp13 snx-03 + NVIDIA RTX 3000 Ada Generation Laptop GPU SPECviewperf 13 - specvp13 snx-03
min: 296.88 avg: 304.5 median: 304.5 (34%) max: 312.07 fps
GPU TDP ? TDP 50 W 100% 95%
specvp13 showcase-02 + NVIDIA RTX 3000 Ada Generation Laptop GPU SPECviewperf 13 - specvp13 showcase-02
min: 88.94 avg: 89.8 median: 89.8 (20%) max: 90.72 fps
GPU TDP ? TDP 50 W 98% 100%
specvp13 medical-02 + NVIDIA RTX 3000 Ada Generation Laptop GPU SPECviewperf 13 - specvp13 medical-02
min: 111.4 avg: 139.9 median: 139.9 (29%) max: 168.45 fps
GPU TDP ? TDP 50 W 100% 66%
specvp13 maya-05 + NVIDIA RTX 3000 Ada Generation Laptop GPU SPECviewperf 13 - specvp13 maya-05
min: 260.1 avg: 267.3 median: 267.3 (30%) max: 274.54 fps
GPU TDP ? TDP 50 W 95% 100%
specvp13 energy-02 + NVIDIA RTX 3000 Ada Generation Laptop GPU SPECviewperf 13 - specvp13 energy-02
min: 56.97 avg: 57.7 median: 57.7 (19%) max: 58.34 fps
GPU TDP ? TDP 50 W 98% 100%
specvp13 creo-02 + NVIDIA RTX 3000 Ada Generation Laptop GPU SPECviewperf 13 - specvp13 creo-02
min: 245.25 avg: 250.2 median: 250.2 (37%) max: 255.24 fps
GPU TDP ? TDP 50 W 96% 100%
specvp13 catia-05 + NVIDIA RTX 3000 Ada Generation Laptop GPU SPECviewperf 13 - specvp13 catia-05
min: 273.29 avg: 292 median: 292 (32%) max: 310.7 fps
GPU TDP ? TDP 50 W 88% 100%
specvp13 3dsmax-06 + NVIDIA RTX 3000 Ada Generation Laptop GPU SPECviewperf 13 - specvp13 3dsmax-06
min: 189.32 avg: 190.5 median: 190.5 (33%) max: 191.68 fps
GPU TDP ? TDP 50 W 99% 100%
SPECviewperf 2020 specvp2020 solidworks-07 4k + NVIDIA RTX 3000 Ada Generation Laptop GPU SPECviewperf 2020 - specvp2020 solidworks-07 4k
77.9 fps (23%)
specvp2020 solidworks-07 1080p + NVIDIA RTX 3000 Ada Generation Laptop GPU SPECviewperf 2020 - specvp2020 solidworks-07 1080p
193.6 fps (52%)
specvp2020 solidworks-05 1080p + NVIDIA RTX 3000 Ada Generation Laptop GPU SPECviewperf 2020 - specvp2020 solidworks-05 1080p
196.5 fps (38%)
specvp2020 snx-04 1080p + NVIDIA RTX 3000 Ada Generation Laptop GPU SPECviewperf 2020 - specvp2020 snx-04 1080p
min: 290.6 avg: 302.5 median: 302.5 (49%) max: 314.39 fps
GPU TDP ? TDP 50 W 100% 92%
specvp2020 medical-03 1080p + NVIDIA RTX 3000 Ada Generation Laptop GPU SPECviewperf 2020 - specvp2020 medical-03 1080p
min: 55.19 avg: 76.1 median: 76.1 (54%) max: 96.95 fps
GPU TDP ? TDP 50 W 100% 57%
specvp2020 maya-06 1080p + NVIDIA RTX 3000 Ada Generation Laptop GPU SPECviewperf 2020 - specvp2020 maya-06 1080p
min: 310.86 avg: 312.6 median: 312.6 (46%) max: 314.35 fps
GPU TDP ? TDP 50 W 99% 100%
specvp2020 energy-03 1080p + NVIDIA RTX 3000 Ada Generation Laptop GPU SPECviewperf 2020 - specvp2020 energy-03 1080p
min: 57.2 avg: 57.5 median: 57.5 (46%) max: 57.85 fps
GPU TDP ? TDP 50 W 99% 100%
specvp2020 creo-03 1080p + NVIDIA RTX 3000 Ada Generation Laptop GPU SPECviewperf 2020 - specvp2020 creo-03 1080p
min: 113.79 avg: 125.2 median: 125.2 (62%) max: 136.69 fps
GPU TDP ? TDP 50 W 83% 100%
specvp2020 catia-06 1080p + NVIDIA RTX 3000 Ada Generation Laptop GPU SPECviewperf 2020 - specvp2020 catia-06 1080p
min: 78.93 avg: 81.4 median: 81.4 (52%) max: 83.77 fps
GPU TDP ? TDP 50 W 94% 100%
specvp2020 3dsmax-07 1080p + NVIDIA RTX 3000 Ada Generation Laptop GPU SPECviewperf 2020 - specvp2020 3dsmax-07 1080p
min: 80.93 avg: 83.6 median: 83.6 (38%) max: 86.19 fps
GPU TDP ? TDP 50 W 94% 100%
specvp2020 solidworks-05 4k + NVIDIA RTX 3000 Ada Generation Laptop GPU SPECviewperf 2020 - specvp2020 solidworks-05 4k
77.2 fps (23%)
specvp2020 snx-04 4k + NVIDIA RTX 3000 Ada Generation Laptop GPU SPECviewperf 2020 - specvp2020 snx-04 4k
min: 189.79 avg: 190.6 median: 190.6 (20%) max: 191.49 fps
GPU TDP ? TDP 50 W 100% 99%
specvp2020 medical-03 4k + NVIDIA RTX 3000 Ada Generation Laptop GPU SPECviewperf 2020 - specvp2020 medical-03 4k
min: 19.91 avg: 28.2 median: 28.2 (27%) max: 36.49 fps
GPU TDP ? TDP 50 W 100% 55%
specvp2020 maya-06 4k + NVIDIA RTX 3000 Ada Generation Laptop GPU SPECviewperf 2020 - specvp2020 maya-06 4k
min: 138.82 avg: 139.8 median: 139.8 (23%) max: 140.78 fps
GPU TDP ? TDP 50 W 99% 100%
specvp2020 energy-03 4k + NVIDIA RTX 3000 Ada Generation Laptop GPU SPECviewperf 2020 - specvp2020 energy-03 4k
min: 20 avg: 30.6 median: 30.6 (7%) max: 41.16 fps
GPU TDP ? TDP 50 W 49% 100%
specvp2020 creo-03 4k + NVIDIA RTX 3000 Ada Generation Laptop GPU SPECviewperf 2020 - specvp2020 creo-03 4k
min: 51.74 avg: 63.3 median: 63.3 (30%) max: 74.79 fps
GPU TDP ? TDP 50 W 100% 69%
specvp2020 catia-06 4k + NVIDIA RTX 3000 Ada Generation Laptop GPU SPECviewperf 2020 - specvp2020 catia-06 4k
min: 44.93 avg: 45.1 median: 45.1 (29%) max: 45.26 fps
GPU TDP ? TDP 50 W 100% 99%
specvp2020 3dsmax-07 4k + NVIDIA RTX 3000 Ada Generation Laptop GPU SPECviewperf 2020 - specvp2020 3dsmax-07 4k
min: 51.62 avg: 52.3 median: 52.3 (22%) max: 53 fps
GPU TDP ? TDP 50 W 100% 97%
Cinebench R15 + NVIDIA RTX 3000 Ada Generation Laptop GPU Cinebench R15 - Cinebench R15 OpenGL 64 Bit
min: 235 avg: 261.5 median: 261.5 (15%) max: 288 fps
GPU TDP ? TDP 50 W 82% 100%
Cinebench R15 OpenGL Ref. Match 64 Bit + NVIDIA RTX 3000 Ada Generation Laptop GPU Cinebench R15 - Cinebench R15 OpenGL Ref. Match 64 Bit
99.6 % (100%)
GPU TDP ? TDP 50 W 100% 100%
Basemark GPU 1.2 - Basemark GPU 1.2 Vulkan Official Medium Offscreen 1080
min: 900 avg: 903 median: 902.5 (6%) max: 905 fps
GPU TDP ? TDP 50 W 100% 99%
Basemark GPU 1.2 - Basemark GPU 1.2 Vulkan Official High Offscreen 2160
3.6 fps (1%)
GPU TDP ? TDP 50 W 100% 100%
Geekbench 6.2 - Geekbench 6.2 GPU OpenCL
min: 91678 avg: 92046 median: 92045.5 (27%) max: 92413 Points
GPU TDP ? TDP 50 W 100% 99%
Geekbench 6.2 - Geekbench 6.2 GPU Vulkan
min: 88420 avg: 90522 median: 90521.5 (30%) max: 92623 Points
GPU TDP ? TDP 50 W 100% 95%
LuxMark v2.0 64Bit - LuxMark v2.0 Room GPU
min: 8257 avg: 8260 median: 8259.5 (37%) max: 8262 Samples/s
LuxMark v2.0 64Bit - LuxMark v2.0 Sala GPU
min: 19072 avg: 19102 median: 19101.5 (33%) max: 19131 Samples/s
ComputeMark v2.1 - ComputeMark v2.1 Result
min: 47808 avg: 47986 median: 47985.5 (52%) max: 48163 Points
Power Consumption - Furmark Stress Test Power Consumption - external Monitor *
min: 333 avg: 359 median: 345 (49%) max: 413 Watt
79.8 Watt (11%)
GPU TDP ? TDP 50 W 100% 181%
Power Consumption - The Witcher 3 Power Consumption - external Monitor *
min: 372 avg: 381.3 median: 382.5 (53%) max: 388 Watt
86.5 Watt (12%)
GPU TDP ? TDP 50 W 100% 188%
Power Consumption - Witcher 3 Power Consumption *
min: 90.4 avg: 91.8 median: 91.8 (20%) max: 93.1 Watt
GPU TDP ? TDP 50 W 100% 101%
Power Consumption - Witcher 3 ultra Power Efficiency
min: 0.854 avg: 0.9 median: 0.9 (78%) max: 0.871 fps per Watt
GPU TDP ? TDP 50 W 98% 100%
Power Consumption - Witcher 3 ultra Power Efficiency - external Monitor
min: 0.509 avg: 0.5 median: 0.5 (43%) max: 0.541 fps per Watt
0.9 fps per Watt (75%)
GPU TDP ? TDP 50 W 58% 100%
Emissions Witcher 3 Fan Noise + NVIDIA RTX 3000 Ada Generation Laptop GPU Emissions - Witcher 3 Fan Noise
min: 49.9 avg: 50 median: 50 (80%) max: 50.1 dB(A)
GPU TDP ? TDP 50 W 100% 100%
Average Benchmarks NVIDIA GeForce RTX 4070 SUPER → 100% n=10 Average Benchmarks NVIDIA RTX 3000 Ada Generation Laptop GPU → 55% n=10
- Range of benchmark values for this graphics card
- Average benchmark values for this graphics card
* Smaller numbers mean a higher performance
1 This benchmark is not used for the average calculation
Game Benchmarks The following benchmarks stem from our benchmarks of review laptops. The performance depends on the used graphics memory, clock rate, processor, system settings, drivers, and operating systems. So the results don't have to be representative for all laptops with this GPU. For detailed information on the benchmark results, click on the fps number.
100%
NVIDIA GeForce RTX 4070 SUPER:
137.4 fps
100%
NVIDIA GeForce RTX 4070 SUPER:
122.1 129.9 ~ 126 fps
100%
NVIDIA GeForce RTX 4070 SUPER:
96.2 101.2 ~ 99 fps
100%
NVIDIA GeForce RTX 4070 SUPER:
61.5 67.6 ~ 65 fps
100%
NVIDIA GeForce RTX 4070 SUPER:
33.9 34.6 ~ 34 fps
100%
NVIDIA GeForce RTX 4070 SUPER:
56.6 60.5 ~ 59 fps
100%
NVIDIA GeForce RTX 4070 SUPER:
226 fps
100%
NVIDIA GeForce RTX 4070 SUPER:
179 184 ~ 182 fps
100%
NVIDIA GeForce RTX 4070 SUPER:
165 166 ~ 166 fps
100%
NVIDIA GeForce RTX 4070 SUPER:
118 120 ~ 119 fps
100%
NVIDIA GeForce RTX 4070 SUPER:
70 71 ~ 71 fps
100%
NVIDIA GeForce RTX 4070 SUPER:
99 100 ~ 100 fps
100%
NVIDIA GeForce RTX 4070 SUPER:
112.8 fps
100%
NVIDIA GeForce RTX 4070 SUPER:
105.1 114.1 ~ 110 fps
100%
NVIDIA GeForce RTX 4070 SUPER:
73.8 79.7 ~ 77 fps
100%
NVIDIA GeForce RTX 4070 SUPER:
40 42.7 ~ 41 fps
100%
NVIDIA GeForce RTX 4070 SUPER:
28.9 44.2 ~ 37 fps
100%
NVIDIA GeForce RTX 4070 SUPER:
205 fps
100%
NVIDIA GeForce RTX 4070 SUPER:
193 204 ~ 199 fps
100%
NVIDIA GeForce RTX 4070 SUPER:
157 169 ~ 163 fps
100%
NVIDIA GeForce RTX 4070 SUPER:
121 130 ~ 126 fps
100%
NVIDIA GeForce RTX 4070 SUPER:
72 77 ~ 75 fps
100%
NVIDIA GeForce RTX 4070 SUPER:
99 106 ~ 103 fps
100%
NVIDIA GeForce RTX 4070 SUPER:
186 fps
47%
NVIDIA RTX 3000 Ada Generation Laptop GPU:
87.2 fps
100%
NVIDIA GeForce RTX 4070 SUPER:
181.8 fps
40%
NVIDIA RTX 3000 Ada Generation Laptop GPU:
72.7 fps
100%
NVIDIA GeForce RTX 4070 SUPER:
156.3 162.1 ~ 159 fps
38%
NVIDIA RTX 3000 Ada Generation Laptop GPU:
60.7 fps
100%
NVIDIA GeForce RTX 4070 SUPER:
136.2 141.9 ~ 139 fps
37%
NVIDIA RTX 3000 Ada Generation Laptop GPU:
52.1 fps
100%
NVIDIA GeForce RTX 4070 SUPER:
83.8 89.6 ~ 87 fps
100%
NVIDIA GeForce RTX 4070 SUPER:
38.4 38.9 ~ 39 fps
NVIDIA RTX 3000 Ada Generation Laptop GPU:
92 fps
100%
NVIDIA GeForce RTX 4070 SUPER:
228 fps
35%
NVIDIA RTX 3000 Ada Generation Laptop GPU:
78.8 fps
100%
NVIDIA GeForce RTX 4070 SUPER:
198.8 203 ~ 201 fps
35%
NVIDIA RTX 3000 Ada Generation Laptop GPU:
70.1 fps
100%
NVIDIA GeForce RTX 4070 SUPER:
194.3 203 ~ 199 fps
35%
NVIDIA RTX 3000 Ada Generation Laptop GPU:
68.8 fps
100%
NVIDIA GeForce RTX 4070 SUPER:
140.3 142.7 ~ 142 fps
100%
NVIDIA GeForce RTX 4070 SUPER:
71.6 71.7 ~ 72 fps
100%
NVIDIA GeForce RTX 4070 SUPER:
115.4 119.7 ~ 118 fps
100%
NVIDIA GeForce RTX 4070 SUPER:
380 381 ~ 381 fps
100%
NVIDIA GeForce RTX 4070 SUPER:
398 406 ~ 402 fps
100%
NVIDIA GeForce RTX 4070 SUPER:
344 357 ~ 351 fps
100%
NVIDIA GeForce RTX 4070 SUPER:
122.4 125.9 ~ 124 fps
100%
NVIDIA GeForce RTX 4070 SUPER:
78 81.2 ~ 80 fps
100%
NVIDIA GeForce RTX 4070 SUPER:
39 40.7 ~ 40 fps
100%
NVIDIA GeForce RTX 4070 SUPER:
66.8 69.7 ~ 68 fps
100%
NVIDIA GeForce RTX 4070 SUPER:
208 fps
100%
NVIDIA GeForce RTX 4070 SUPER:
201.7 216.1 ~ 209 fps
100%
NVIDIA GeForce RTX 4070 SUPER:
149.6 155.7 ~ 153 fps
100%
NVIDIA GeForce RTX 4070 SUPER:
118 123.8 ~ 121 fps
100%
NVIDIA GeForce RTX 4070 SUPER:
73.6 78 ~ 76 fps
100%
NVIDIA GeForce RTX 4070 SUPER:
363 381 ~ 372 fps
47%
NVIDIA RTX 3000 Ada Generation Laptop GPU:
162.7 [X] Dell Precision 5480 959964
Intel Core i9-13900H 1.9GHz
NVIDIA RTX 3000 Ada Generation Laptop GPU
min:
127 fps, P1:
86 fps, max:
188 fps
183.6 [X] Dell Precision 5000 5490 959964
Intel Core Ultra 9 185H 3.8GHz
NVIDIA RTX 3000 Ada Generation Laptop GPU
min:
149 fps, P1:
100 fps, max:
226 fps
~ 173 fps
100%
NVIDIA GeForce RTX 4070 SUPER:
386 403 ~ 395 fps
42%
NVIDIA RTX 3000 Ada Generation Laptop GPU:
159.6 [X] Dell Precision 5480 959964
Intel Core i9-13900H 1.9GHz
NVIDIA RTX 3000 Ada Generation Laptop GPU
min:
124 fps, P1:
86 fps, max:
186 fps
168 [X] Dell Precision 5000 5490 959964
Intel Core Ultra 9 185H 3.8GHz
NVIDIA RTX 3000 Ada Generation Laptop GPU
min:
145 fps, P1:
96 fps, max:
198 fps
~ 164 fps
100%
NVIDIA GeForce RTX 4070 SUPER:
321 340 ~ 331 fps
39%
NVIDIA RTX 3000 Ada Generation Laptop GPU:
127.5 [X] Dell Precision 5000 5490 959964
Intel Core Ultra 9 185H 3.8GHz
NVIDIA RTX 3000 Ada Generation Laptop GPU
min:
113 fps, P1:
80 fps, max:
139 fps
133.4 [X] Dell Precision 5480 959964
Intel Core i9-13900H 1.9GHz
NVIDIA RTX 3000 Ada Generation Laptop GPU
min:
115 fps, P1:
73 fps, max:
163 fps
~ 130 fps
100%
NVIDIA GeForce RTX 4070 SUPER:
128.7 136.3 ~ 133 fps
38%
NVIDIA RTX 3000 Ada Generation Laptop GPU:
50.4 [X] Dell Precision 5000 5490 959964
Intel Core Ultra 9 185H 3.8GHz
NVIDIA RTX 3000 Ada Generation Laptop GPU
min:
43 fps, P1:
40 fps, max:
58 fps
51.1 [X] Dell Precision 5480 959964
Intel Core i9-13900H 1.9GHz
NVIDIA RTX 3000 Ada Generation Laptop GPU
min:
41 fps, P1:
36 fps, max:
60 fps
~ 51 fps
100%
NVIDIA GeForce RTX 4070 SUPER:
83.1 88.8 ~ 86 fps
100%
NVIDIA GeForce RTX 4070 SUPER:
41.9 44.6 ~ 43 fps
100%
NVIDIA GeForce RTX 4070 SUPER:
285 fps
100%
NVIDIA GeForce RTX 4070 SUPER:
279 284 ~ 282 fps
100%
NVIDIA GeForce RTX 4070 SUPER:
278 291 ~ 285 fps
100%
NVIDIA GeForce RTX 4070 SUPER:
189.6 194.8 ~ 192 fps
100%
NVIDIA GeForce RTX 4070 SUPER:
87.5 92.7 ~ 90 fps
NVIDIA RTX 3000 Ada Generation Laptop GPU:
153.9 156 ~ 155 fps
NVIDIA RTX 3000 Ada Generation Laptop GPU:
125.4 131.4 ~ 128 fps
NVIDIA RTX 3000 Ada Generation Laptop GPU:
88 88.5 ~ 88 fps
NVIDIA RTX 3000 Ada Generation Laptop GPU:
69 70.2 ~ 70 fps
100%
NVIDIA GeForce RTX 4070 SUPER:
195.7 fps
47%
NVIDIA RTX 3000 Ada Generation Laptop GPU:
92.3 [X] Dell Precision 5480 Intel Core i9-13900H 1.9GHz
NVIDIA RTX 3000 Ada Generation Laptop GPU
min:
44.1 fps, max:
141.3 fps
fps
100%
NVIDIA GeForce RTX 4070 SUPER:
184.1 fps
39%
NVIDIA RTX 3000 Ada Generation Laptop GPU:
72.4 [X] Dell Precision 5480 Intel Core i9-13900H 1.9GHz
NVIDIA RTX 3000 Ada Generation Laptop GPU
min:
37.4 fps, max:
99.7 fps
fps
100%
NVIDIA GeForce RTX 4070 SUPER:
156.5 161.8 ~ 159 fps
38%
NVIDIA RTX 3000 Ada Generation Laptop GPU:
61.2 [X] Dell Precision 5480 Intel Core i9-13900H 1.9GHz
NVIDIA RTX 3000 Ada Generation Laptop GPU
min:
45 fps, max:
98.6 fps
fps
100%
NVIDIA GeForce RTX 4070 SUPER:
141 146 ~ 144 fps
39%
NVIDIA RTX 3000 Ada Generation Laptop GPU:
56.2 [X] Dell Precision 5480 Intel Core i9-13900H 1.9GHz
NVIDIA RTX 3000 Ada Generation Laptop GPU
min:
42.1 fps, max:
80.3 fps
fps
100%
NVIDIA GeForce RTX 4070 SUPER:
91.3 92.8 ~ 92 fps
100%
NVIDIA GeForce RTX 4070 SUPER:
43.5 44.9 ~ 44 fps
100%
NVIDIA GeForce RTX 4070 SUPER:
201 fps
100%
NVIDIA GeForce RTX 4070 SUPER:
150.5 157 ~ 154 fps
100%
NVIDIA GeForce RTX 4070 SUPER:
108 109.7 ~ 109 fps
100%
NVIDIA GeForce RTX 4070 SUPER:
52.8 54.5 ~ 54 fps
100%
NVIDIA GeForce RTX 4070 SUPER:
206 fps
100%
NVIDIA GeForce RTX 4070 SUPER:
181.8 193.7 ~ 188 fps
100%
NVIDIA GeForce RTX 4070 SUPER:
139.4 145.9 ~ 143 fps
100%
NVIDIA GeForce RTX 4070 SUPER:
79 82.7 ~ 81 fps
100%
NVIDIA GeForce RTX 4070 SUPER:
169.2 fps
100%
NVIDIA GeForce RTX 4070 SUPER:
159.1 fps
100%
NVIDIA GeForce RTX 4070 SUPER:
135.5 142.3 ~ 139 fps
100%
NVIDIA GeForce RTX 4070 SUPER:
106 109.2 ~ 108 fps
100%
NVIDIA GeForce RTX 4070 SUPER:
61.4 63.4 ~ 62 fps
100%
NVIDIA GeForce RTX 4070 SUPER:
233 fps
100%
NVIDIA GeForce RTX 4070 SUPER:
216 226 ~ 221 fps
100%
NVIDIA GeForce RTX 4070 SUPER:
156.8 161.5 ~ 159 fps
100%
NVIDIA GeForce RTX 4070 SUPER:
80.5 83.2 ~ 82 fps
100%
NVIDIA GeForce RTX 4070 SUPER:
193.6 fps
100%
NVIDIA GeForce RTX 4070 SUPER:
179.3 184.2 ~ 182 fps
100%
NVIDIA GeForce RTX 4070 SUPER:
163.4 166.6 ~ 165 fps
100%
NVIDIA GeForce RTX 4070 SUPER:
125.4 131.2 ~ 128 fps
100%
NVIDIA GeForce RTX 4070 SUPER:
66.2 68.9 ~ 68 fps
100%
NVIDIA GeForce RTX 4070 SUPER:
224 fps
100%
NVIDIA GeForce RTX 4070 SUPER:
172.7 180.1 ~ 176 fps
100%
NVIDIA GeForce RTX 4070 SUPER:
112.6 115.5 ~ 114 fps
100%
NVIDIA GeForce RTX 4070 SUPER:
57.4 58.2 ~ 58 fps
100%
NVIDIA GeForce RTX 4070 SUPER:
67.1 69 ~ 68 fps
100%
NVIDIA GeForce RTX 4070 SUPER:
267 fps
100%
NVIDIA GeForce RTX 4070 SUPER:
224 fps
100%
NVIDIA GeForce RTX 4070 SUPER:
178.8 186.1 ~ 182 fps
100%
NVIDIA GeForce RTX 4070 SUPER:
144.8 150.6 ~ 148 fps
100%
NVIDIA GeForce RTX 4070 SUPER:
116.1 120.8 ~ 118 fps
100%
NVIDIA GeForce RTX 4070 SUPER:
72.8 76.1 ~ 74 fps
100%
NVIDIA GeForce RTX 4070 SUPER:
265 fps
100%
NVIDIA GeForce RTX 4070 SUPER:
257 260 ~ 259 fps
100%
NVIDIA GeForce RTX 4070 SUPER:
244 255 ~ 250 fps
100%
NVIDIA GeForce RTX 4070 SUPER:
165.3 188 ~ 177 fps
100%
NVIDIA GeForce RTX 4070 SUPER:
91.5 96.7 ~ 94 fps
100%
NVIDIA GeForce RTX 4070 SUPER:
570 601 ~ 586 fps
58%
NVIDIA RTX 3000 Ada Generation Laptop GPU:
282 [X] Dell Precision 5000 5490 1.47.22.14 D3D12
Intel Core Ultra 9 185H 3.8GHz
NVIDIA RTX 3000 Ada Generation Laptop GPU
min:
84.5 fps, P1:
161.1 fps, max:
480 fps
400 [X] Dell Precision 5480 1.47.22.14 D3D12
Intel Core i9-13900H 1.9GHz
NVIDIA RTX 3000 Ada Generation Laptop GPU
min:
111.2 fps, P1:
268 fps, max:
618 fps
~ 341 fps
100%
NVIDIA GeForce RTX 4070 SUPER:
398 469 ~ 434 fps
43%
NVIDIA RTX 3000 Ada Generation Laptop GPU:
182.4 [X] Dell Precision 5000 5490 1.47.22.14 D3D12
Intel Core Ultra 9 185H 3.8GHz
NVIDIA RTX 3000 Ada Generation Laptop GPU
min:
41.6 fps, P1:
133.4 fps, max:
278 fps
191.3 [X] Dell Precision 5480 1.47.22.14 D3D12
Intel Core i9-13900H 1.9GHz
NVIDIA RTX 3000 Ada Generation Laptop GPU
min:
47.2 fps, P1:
146.8 fps, max:
291 fps
~ 187 fps
100%
NVIDIA GeForce RTX 4070 SUPER:
418 437 ~ 428 fps
36%
NVIDIA RTX 3000 Ada Generation Laptop GPU:
151.4 [X] Dell Precision 5000 5490 1.47.22.14 D3D12
Intel Core Ultra 9 185H 3.8GHz
NVIDIA RTX 3000 Ada Generation Laptop GPU
min:
78.4 fps, P1:
114.6 fps, max:
249 fps
160.1 [X] Dell Precision 5480 1.47.22.14 D3D12
Intel Core i9-13900H 1.9GHz
NVIDIA RTX 3000 Ada Generation Laptop GPU
min:
49.7 fps, P1:
118.1 fps, max:
262 fps
~ 156 fps
100%
NVIDIA GeForce RTX 4070 SUPER:
376 385 ~ 381 fps
36%
NVIDIA RTX 3000 Ada Generation Laptop GPU:
132.5 [X] Dell Precision 5000 5490 1.47.22.14 D3D12
Intel Core Ultra 9 185H 3.8GHz
NVIDIA RTX 3000 Ada Generation Laptop GPU
min:
69.9 fps, P1:
101.5 fps, max:
222 fps
140.7 [X] Dell Precision 5480 1.47.22.14 D3D12
Intel Core i9-13900H 1.9GHz
NVIDIA RTX 3000 Ada Generation Laptop GPU
min:
56.7 fps, P1:
103.9 fps, max:
225 fps
~ 137 fps
100%
NVIDIA GeForce RTX 4070 SUPER:
260 270 ~ 265 fps
100%
NVIDIA GeForce RTX 4070 SUPER:
130 134.7 ~ 132 fps
NVIDIA RTX 3000 Ada Generation Laptop GPU:
115 155 [X] Dell Precision 5480 Intel Core i9-13900H 1.9GHz
NVIDIA RTX 3000 Ada Generation Laptop GPU
min:
93 fps, max:
197 fps
~ 135 fps
100%
NVIDIA GeForce RTX 4070 SUPER:
203 fps
55%
NVIDIA RTX 3000 Ada Generation Laptop GPU:
105 116 [X] Dell Precision 5480 Intel Core i9-13900H 1.9GHz
NVIDIA RTX 3000 Ada Generation Laptop GPU
min:
101 fps, max:
131 fps
~ 111 fps
100%
NVIDIA GeForce RTX 4070 SUPER:
199 201 ~ 200 fps
53%
NVIDIA RTX 3000 Ada Generation Laptop GPU:
104 106 [X] Dell Precision 5480 Intel Core i9-13900H 1.9GHz
NVIDIA RTX 3000 Ada Generation Laptop GPU
min:
93 fps, max:
125 fps
~ 105 fps
100%
NVIDIA GeForce RTX 4070 SUPER:
188 191 ~ 190 fps
52%
NVIDIA RTX 3000 Ada Generation Laptop GPU:
96 101 [X] Dell Precision 5480 Intel Core i9-13900H 1.9GHz
NVIDIA RTX 3000 Ada Generation Laptop GPU
min:
89 fps, max:
117 fps
~ 99 fps
100%
NVIDIA GeForce RTX 4070 SUPER:
181 185 ~ 183 fps
100%
NVIDIA GeForce RTX 4070 SUPER:
101 104 ~ 103 fps
100%
NVIDIA GeForce RTX 4070 SUPER:
226 233 ~ 230 fps
57%
NVIDIA RTX 3000 Ada Generation Laptop GPU:
109.9 152 ~ 131 fps
100%
NVIDIA GeForce RTX 4070 SUPER:
196.3 196.4 ~ 196 fps
58%
NVIDIA RTX 3000 Ada Generation Laptop GPU:
102.1 126.8 ~ 114 fps
100%
NVIDIA GeForce RTX 4070 SUPER:
151.9 152.4 ~ 152 fps
59%
NVIDIA RTX 3000 Ada Generation Laptop GPU:
76.7 102 ~ 89 fps
100%
NVIDIA GeForce RTX 4070 SUPER:
129.1 131.7 ~ 130 fps
100%
NVIDIA GeForce RTX 4070 SUPER:
235 244 ~ 240 fps
59%
NVIDIA RTX 3000 Ada Generation Laptop GPU:
128.8 155.1 ~ 142 fps
100%
NVIDIA GeForce RTX 4070 SUPER:
234 235 ~ 235 fps
43%
NVIDIA RTX 3000 Ada Generation Laptop GPU:
91.9 108 ~ 100 fps
100%
NVIDIA GeForce RTX 4070 SUPER:
194 197.1 ~ 196 fps
39%
NVIDIA RTX 3000 Ada Generation Laptop GPU:
72.9 78.9 ~ 76 fps
100%
NVIDIA GeForce RTX 4070 SUPER:
148 150.5 ~ 149 fps
100%
NVIDIA GeForce RTX 4070 SUPER:
84.8 85.2 ~ 85 fps
100%
NVIDIA GeForce RTX 4070 SUPER:
244 250 ~ 247 fps
70%
NVIDIA RTX 3000 Ada Generation Laptop GPU:
168 175.7 [X] Dell Precision 5480 Intel Core i9-13900H 1.9GHz
NVIDIA RTX 3000 Ada Generation Laptop GPU
min:
155.4 fps, max:
-1 fps
~ 172 fps
100%
NVIDIA GeForce RTX 4070 SUPER:
228 229 ~ 229 fps
68%
NVIDIA RTX 3000 Ada Generation Laptop GPU:
151.3 160.8 [X] Dell Precision 5480 Intel Core i9-13900H 1.9GHz
NVIDIA RTX 3000 Ada Generation Laptop GPU
min:
141.3 fps, max:
-1 fps
~ 156 fps
100%
NVIDIA GeForce RTX 4070 SUPER:
221 223 ~ 222 fps
65%
NVIDIA RTX 3000 Ada Generation Laptop GPU:
136 151.5 [X] Dell Precision 5480 Intel Core i9-13900H 1.9GHz
NVIDIA RTX 3000 Ada Generation Laptop GPU
min:
131.9 fps, max:
-1 fps
~ 144 fps
100%
NVIDIA GeForce RTX 4070 SUPER:
208 209 ~ 209 fps
64%
NVIDIA RTX 3000 Ada Generation Laptop GPU:
123.3 142.9 [X] Dell Precision 5480 Intel Core i9-13900H 1.9GHz
NVIDIA RTX 3000 Ada Generation Laptop GPU
min:
124.3 fps, max:
-1 fps
~ 133 fps
100%
NVIDIA GeForce RTX 4070 SUPER:
192.9 202 ~ 197 fps
NVIDIA RTX 3000 Ada Generation Laptop GPU:
344 364.1 [X] Dell Precision 5480 Intel Core i9-13900H 1.9GHz
NVIDIA RTX 3000 Ada Generation Laptop GPU
min:
332 fps, max:
392 fps
~ 354 fps
100%
NVIDIA GeForce RTX 4070 SUPER:
566 fps
43%
NVIDIA RTX 3000 Ada Generation Laptop GPU:
242.5 [X] Dell Precision 5480 Intel Core i9-13900H 1.9GHz
NVIDIA RTX 3000 Ada Generation Laptop GPU
min:
232 fps, max:
256 fps
249.5 ~ 246 fps
100%
NVIDIA GeForce RTX 4070 SUPER:
406 418 ~ 412 fps
36%
NVIDIA RTX 3000 Ada Generation Laptop GPU:
145.8 150.1 [X] Dell Precision 5480 Intel Core i9-13900H 1.9GHz
NVIDIA RTX 3000 Ada Generation Laptop GPU
min:
141 fps, max:
160 fps
~ 148 fps
100%
NVIDIA GeForce RTX 4070 SUPER:
191.9 210 ~ 201 fps
39%
NVIDIA RTX 3000 Ada Generation Laptop GPU:
78.7 [X] Dell Precision 5480 Intel Core i9-13900H 1.9GHz
NVIDIA RTX 3000 Ada Generation Laptop GPU
min:
72 fps, max:
85 fps
79.5 ~ 79 fps
100%
NVIDIA GeForce RTX 4070 SUPER:
148.9 159.1 ~ 154 fps
100%
NVIDIA GeForce RTX 4070 SUPER:
129.4 136.7 ~ 133 fps
100%
NVIDIA GeForce RTX 4070 SUPER:
187.7 188.3 ~ 188 fps
97%
NVIDIA RTX 3000 Ada Generation Laptop GPU:
183.2 [X] Dell Precision 5480 Intel Core i9-13900H 1.9GHz
NVIDIA RTX 3000 Ada Generation Laptop GPU
min:
2.63 fps, P1:
111.1 fps, max:
434 fps
fps
100%
NVIDIA GeForce RTX 4070 SUPER:
187.6 187.9 ~ 188 fps
94%
NVIDIA RTX 3000 Ada Generation Laptop GPU:
177 [X] Dell Precision 5480 Intel Core i9-13900H 1.9GHz
NVIDIA RTX 3000 Ada Generation Laptop GPU
min:
3.22 fps, P1:
100 fps, max:
410 fps
fps
100%
NVIDIA GeForce RTX 4070 SUPER:
186.9 186.9 ~ 187 fps
88%
NVIDIA RTX 3000 Ada Generation Laptop GPU:
164.1 [X] Dell Precision 5480 Intel Core i9-13900H 1.9GHz
NVIDIA RTX 3000 Ada Generation Laptop GPU
min:
3.24 fps, P1:
90.9 fps, max:
309 fps
fps
100%
NVIDIA GeForce RTX 4070 SUPER:
158.8 160 ~ 159 fps
55%
NVIDIA RTX 3000 Ada Generation Laptop GPU:
88.2 [X] Dell Precision 5480 Intel Core i9-13900H 1.9GHz
NVIDIA RTX 3000 Ada Generation Laptop GPU
min:
6.73 fps, P1:
52.6 fps, max:
163.4 fps
fps
100%
NVIDIA GeForce RTX 4070 SUPER:
147.2 148.2 ~ 148 fps
100%
NVIDIA GeForce RTX 4070 SUPER:
164.6 166.6 ~ 166 fps
Average Gaming NVIDIA GeForce RTX 4070 SUPER → 100% Average Gaming 30-70 fps → 100%
Average Gaming NVIDIA RTX 3000 Ada Generation Laptop GPU → 50% Average Gaming 30-70 fps → 38%
 Deutsch
 English
 Español
 Français
 Italiano
 Nederlands
 Polski
 Português
 Русский
 Türkçe
 Svenska
 Chinese
 Magyar