Notebook reviews with NVIDIA GeForce GTX 1650 Mobile graphics card
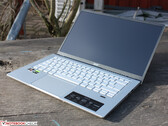
Acer Swift X SFX14 with GTX 1650 in review: Swift Ryzen laptop
Acer's 14-inch notebook has the makings of a mobile gaming ultrabook. While 2020 Turing graphics is not the latest and greatest, it offers moderate gaming power paired with the Ryzen 5000 in the 19mm thick case. The build quality is solid and the display surprisingly good.
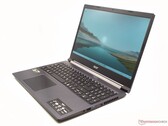
AMD Ryzen 5 5500U, NVIDIA GeForce GTX 1650 Mobile, 14", 1.4 kgAcer Aspire 7 A715-42G multimedia laptop review: All-rounder in disguise with gaming potential
Not only does the 15.6-inch display provide enough power for office and Internet purposes, it also strives for crisp frame rates. The multimedia laptop smoothly transfers many modern games to the screen.
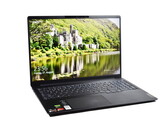
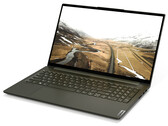
AMD Ryzen 5 5500U, NVIDIA GeForce GTX 1650 Mobile, 15.6", 2.2 kgLenovo IdeaPad 5 Pro 16ACH review: Ryzen 5000 laptop with large 120 Hz LCD
The Lenovo IdeaPad 5 Pro 16ACH might be the result of a combination of the trends towards 16:10 displays and AMD processors. The multimedia laptop stands out with its large, high-resolution 120 Hz LCD in a less wide format and with its fast Ryzen 5000H CPUs.
AMD Ryzen 7 5800H, NVIDIA GeForce GTX 1650 Mobile, 16", 2 kgLenovo Yoga Creator 7 15IMH05 review: Dolby Vision, very good battery life, and a three-year warranty
The slim and compact Lenovo Yoga Creator 7 offers a lot of computing performance and a well-rounded equipment level. This is accompanied by a very good battery life and a three-year warranty.
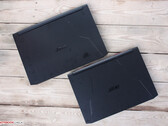
Intel Core i7-10750H, NVIDIA GeForce GTX 1650 Mobile, 15.6", 1.8 kgPreview Acer Nitro 5 in 15- & 17-inch: Ryzen 5000H for gamers
Ryzen 5000H accelerates and overtakes many a gaming machine with an Intel chip. However, the configuration with a responsive display and mass storage options is also appealing. We tested two pre-production models.
AMD Ryzen 5 5600H, NVIDIA GeForce GTX 1650 Mobile, 15.6", 2.3 kgSchenker XMG Core 14: Intel Core i5-1135G7, 14.00", 1.4 kg
Review » Schenker XMG Core 14 (Clevo NV40MB) laptop review: baby gamer
Lenovo Legion 5 17IMH05: Intel Core i5-10300H, 17.30", 2.9 kg
Review » Lenovo Legion 5 17IMH Laptop Review: The battery just won't die
LG Ultra 17U70N: Intel Core i5-10210U, 17.00", 2 kg
Review » Like a Dell XPS 17, But Worse: LG Ultra 17 Laptop Review
HP Pavilion Gaming 15-ec1206ng: AMD Ryzen 5 4600H, 15.60", 2.1 kg
Review » HP Pavilion Gaming 15 in review: Budget gaming laptop offers long battery life
Nexoc GH5 515IG: Intel Core i5-10300H, 15.60", 2.1 kg
Review » Nexoc GH5 515IG (Clevo NH50DB): Entry-level gaming laptop offers room for three storage drives
Lenovo IdeaPad Gaming 3i 15IMH05: Intel Core i5-10300H, 15.60", 2.2 kg
Review » Lenovo IdeaPad Gaming 3i 15IMH05 in review: Core i5 at full throttle
MSI GF75 Thin 10SCXR: Intel Core i5-10300H, 17.30", 2.2 kg
Review » 10th gen Core i5 Comet Lake-H Debut: MSI GF75 Thin 10SCXR Laptop Review
Lenovo ThinkPad X1 Extreme 2019 20QV000WGE: Intel Core i7-9750H, 15.60", 1.7 kg
Review » Lenovo ThinkPad X1 Extreme 2019 Laptop Review: The second generation of Lenovo's premier multimedia laptop has gotten worse
Dell G5 15 5590-PCNJJ: Intel Core i5-9300H, 15.60", 2.7 kg
Review » Dell G5 15 5590 Laptop Review: Price/Performance King and Problem Child
Dell G3 3590: Intel Core i5-9300H, 15.60", 2.5 kg
Review » Dell G3 15 3590 Laptop Review: Inexpensive with Easy Upgrades
Lenovo IdeaPad L340-15IRH 81LK00BMGE: Intel Core i5-9300H, 15.60", 2.1 kg
Review » Lenovo IdeaPad L340 Gaming laptop review: Stiff ClickPad impacts gaming fun
Acer Aspire 7 A715-74G-50U5: Intel Core i5-9300H, 15.60", 2.4 kg
Review » Aspire 7 A715 Laptop Review: Acer's upgrade giant with gaming potential and long battery life
Lenovo Ideapad L340-17IRH 81LL001YGE: Intel Core i5-9300H, 17.30", 2.5 kg
Review » Lenovo IdeaPad L340-17IRH Review: The well-rounded mid-range gaming notebook is unable to reach its full performance potential
Dell XPS 15 7590 9980HK GTX 1650: Intel Core i9-9980HK, 15.60", 2 kg
Review » Power Overwhelming: Dell XPS 15 7590 Core i9 and GeForce GTX 1650 OLED Laptop Review
HP Omen 15-dc1020ng: Intel Core i5-9300H, 15.60", 2.3 kg
Review » HP Omen 15 Review: affordable entry-level gamer with decent battery life
MSI GF75 Thin 9SC: Intel Core i7-9750H, 17.30", 2.3 kg
Review » Thin is in: MSI GF75 Thin 9SC Laptop Review
Asus TUF FX505DT-EB73: AMD Ryzen 7 3750H, 15.60", 2.2 kg
Review » No Intel Required: Asus TUF FX505DT Laptop Review with Ryzen 7 and GeForce GTX 1650
Asus TUF FX705DT-AU068T: AMD Ryzen 5 3550H, 17.30", 2.7 kg
Review » Asus TUF Gaming FX705DT (Ryzen 5 3550H, GTX 1650, SSD, FHD) Laptop Review
Acer Aspire Nitro 5 AN515-54-53Z2: Intel Core i5-9300H, 15.60", 2.2 kg
Review » Acer Nitro 5 (Core i5-9300H, GeForce GTX 1650) Laptop Review
Acer Nitro 5 AN515-57, GTX 1650: Intel Core i5-11400H, 15.60", 2.3 kg
External Review » Acer Nitro 5 AN515-57, GTX 1650
Lenovo IdeaPad 5 Pro 16ACH6-82L500VKMH: AMD Ryzen 7 5800H, 16.00", 1.9 kg
External Review » Lenovo IdeaPad 5 Pro 16ACH6-82L500VKMH
Acer Aspire 7 A715-76G: Intel Core i5-12450H, 15.60", 2.1 kg
External Review » Acer Aspire 7 A715-76G
HP Victus 15-fa0031dx: Intel Core i5-12450H, 15.60", 2.3 kg
External Review » HP Victus 15-fa0031dx
Asus TUF Gaming F15 FX506LHB-HN324: Intel Core i5-10300H, 15.60", 2.3 kg
External Review » Asus TUF Gaming F15 FX506LHB-HN324
HP Victus 16-d0019ns: Intel Core i5-11400H, 16.10", 2.5 kg
External Review » HP Victus 16-d0019ns
HP Victus 16-e0085ns: AMD Ryzen 5 5600H, 16.10", 2.5 kg
External Review » HP Victus 16-e0085ns
HP Victus 15-fb0152ng: AMD Ryzen 5 5600H, 16.00", 2.3 kg
External Review » HP Victus 15-fb0152ng
MSI GF63 Thin 11SC: Intel Core i5-11400H, 15.60", 1.9 kg
External Review » MSI GF63 Thin 11SC
Lenovo IdeaPad Gaming 3 15IHU6-82K1019DSP: Intel Core i5-11320H, 15.60", 2.3 kg
External Review » Lenovo IdeaPad Gaming 3 15IHU6-82K1019DSP
HP Victus 15-fa0038nf: Intel Core i5-12450H, 15.60", 2.3 kg
External Review » HP Victus 15-fa0038nf
Lenovo IdeaPad Gaming 3 15ACH6-82K201SRSP: AMD Ryzen 5 5600H, 15.60", 2.3 kg
External Review » Lenovo IdeaPad Gaming 3 15ACH6-82K201SRSP
MSI Prestige 14 A12SC-086CA: Intel Core i7-1280P, 14.00", 1.6 kg
External Review » MSI Prestige 14 A12SC-086CA
HP Victus 15t-fa000: Intel Core i5-12450H, 15.60", 2.3 kg
External Review » HP Victus 15t-fa000
Lenovo IdeaPad Gaming 3 15ACH6-82K201HEMH: AMD Ryzen 5 5600H, 15.60", 2.3 kg
External Review » Lenovo IdeaPad Gaming 3 15ACH6-82K201HEMH
Asus TUF Gaming F15 FX506LH-AS51: Intel Core i5-10300H, 15.60", 2.3 kg
External Review » Asus TUF Gaming F15 FX506LH-AS51
Acer Nitro 5 AN515-55-72P7: Intel Core i7-10750H, 15.60", 2.5 kg
External Review » Acer Nitro 5 AN515-55-72P7
Lenovo IdeaPad 5 Pro 16ACH: AMD Ryzen 7 5800H, 16.00", 2 kg
External Review » Lenovo IdeaPad 5 Pro 16ACH
Acer Nitro 5 AN515-56-54DF: Intel Core i5-11300H, 15.60", 2.3 kg
External Review » Acer Nitro 5 AN515-56-54DF
Acer Nitro 5 AN515-56-51V8: Intel Core i5-11300H, 15.60", 2.3 kg
External Review » Acer Nitro 5 AN515-56-51V8
HP Victus 16-e0040ns: AMD Ryzen 5 5600H, 16.10", 2.5 kg
External Review » HP Victus 16-e0040ns
Lenovo IdeaPad Gaming 3 15ACH6-82K201DHMH: AMD Ryzen 5 5600H, 15.60", 2.3 kg
External Review » Lenovo IdeaPad Gaming 3 15ACH6-82K201DHMH
Lenovo ThinkBook 15p G2 ITH-21B1001LUS: Intel Core i7-11800H, 15.60", 1.9 kg
External Review » Lenovo ThinkBook 15p G2 ITH-21B1001LUS
HP Victus 16-e0010ns: AMD Ryzen 5 5600H, 16.10", 2.5 kg
External Review » HP Victus 16-e0010ns
Lenovo IdeaPad Gaming 3 15ACH6-82K200UTUS: AMD Ryzen 5 5600H, 15.60", 2.3 kg
External Review » Lenovo IdeaPad Gaming 3 15ACH6-82K200UTUS
Dell G15 5510-8R03T: Intel Core i5-10200H, 15.60", 2.7 kg
External Review » Dell G15 5510-8R03T
Asus Vivobook Pro 14 K3400, i5-11300H GTX 1650: Intel Core i5-11300H, 14.00", 1.4 kg
External Review » Asus Vivobook Pro 14 K3400, i5-11300H GTX 1650
HP Pavilion Gaming 15-ec2004ns: AMD Ryzen 7 5800H, 15.60", 2 kg
External Review » HP Pavilion Gaming 15-ec2004ns
HP Pavilion Gaming 15-ec2047AX: AMD Ryzen 5 5600H, 15.60", 2 kg
External Review » HP Pavilion Gaming 15-ec2047AX
HP Pavilion Gaming 15-ec2005ns: AMD Ryzen 5 5600H, 15.60", 2 kg
External Review » HP Pavilion Gaming 15-ec2005ns
Asus ROG Strix G513IC-HN004: AMD Ryzen 7 4800H, 15.60", 2.3 kg
External Review » Asus ROG Strix G513IC-HN004
MSI GF75 Thin 10SCXR: Intel Core i5-10300H, 17.30", 2.2 kg
External Review » MSI GF75 Thin 10SCXR
HP Pavilion Gaming 15-ec2002ns: AMD Ryzen 5 5600H, 15.60", 2 kg
External Review » HP Pavilion Gaming 15-ec2002ns
Acer Aspire 7 A715-42G-R1DD: AMD Ryzen 5 5500U, 15.60", 2.2 kg
External Review » Acer Aspire 7 A715-42G-R1DD
Lenovo IdeaPad Gaming 3 15ACH6-82K20015US: AMD Ryzen 5 5600H, 15.60", 2.3 kg
External Review » Lenovo IdeaPad Gaming 3 15ACH6-82K20015US
HP Pavilion Gaming 15-ec2009ns: AMD Ryzen 5 5600H, 15.60", 2 kg
External Review » HP Pavilion Gaming 15-ec2009ns
Acer Swift X SFX14-41G-R9KC: AMD Ryzen 5 5500U, 14.00", 1.5 kg
External Review » Acer Swift X SFX14-41G-R9KC
Lenovo IdeaPad Gaming 3 15IMH05-81Y400YFSP: Intel Core i7-10750H, 15.60", 2.2 kg
External Review » Lenovo IdeaPad Gaming 3 15IMH05-81Y400YFSP
HP Victus 16-e0004ns: AMD Ryzen 5 5600H, 16.10", 2.5 kg
External Review » HP Victus 16-e0004ns
HP Pavilion Gaming 15-ec2007ns: AMD Ryzen 5 5600H, 15.60", 2 kg
External Review » HP Pavilion Gaming 15-ec2007ns
Acer Nitro 5 AN515-55-56F5: Intel Core i5-10300H, 15.60", 2.3 kg
External Review » Acer Nitro 5 AN515-55-56F5
Acer Nitro 5 AN515-55-72GW: Intel Core i7-10750H, 15.60", 2.3 kg
External Review » Acer Nitro 5 AN515-55-72GW
HP Pavilion Gaming 15-ec2008ns: AMD Ryzen 5 5600H, 15.60", 2 kg
External Review » HP Pavilion Gaming 15-ec2008ns
Lenovo IdeaPad Gaming 3 15ARH05-82EY00RDSP: AMD Ryzen 5 4600H, 15.60", 2.2 kg
External Review » Lenovo IdeaPad Gaming 3 15ARH05-82EY00RDSP
Asus TUF Gaming F15 FX506LH-HN129: Intel Core i7-10875H, 15.60", 2.3 kg
External Review » Asus TUF Gaming F15 FX506LH-HN129
HP Pavilion Gaming 15z-ec200: AMD Ryzen 5 5600H, 15.60", 2.3 kg
External Review » HP Pavilion Gaming 15z-ec200
HP Pavilion Gaming 15-ec2025ns: AMD Ryzen 7 5800H, 15.60", 2.3 kg
External Review » HP Pavilion Gaming 15-ec2025ns
Asus ROG Strix G15 G513IH-HN008: AMD Ryzen 7 4800H, 15.60", 2.1 kg
External Review » Asus ROG Strix G15 G513IH-HN008
Lenovo Legion 5 17ACH6-82K0000RMH: AMD Ryzen 5 5600H, 17.30", 3 kg
External Review » Lenovo Legion 5 17ACH6-82K0000RMH
Lenovo IdeaPad Gaming 3 15ARH05-82EY00RESP: AMD Ryzen 7 4800H, 15.60", 2.2 kg
External Review » Lenovo IdeaPad Gaming 3 15ARH05-82EY00RESP
Asus TUF Gaming F15 FX506LH-HN042T: Intel Core i5-10300H, 15.60", 2.3 kg
External Review » Asus TUF Gaming F15 FX506LH-HN042T
Acer Swift X SFX14-41G-R2DS: AMD Ryzen 7 5700U, 14.00", 1.5 kg
External Review » Acer Swift X SFX14-41G-R2DS
Lenovo Ideapad L340-17IRH 81LL001YGE: Intel Core i5-9300H, 17.30", 2.5 kg
External Review » Lenovo Ideapad L340-17IRH 81LL001YGE
Lenovo Ideapad L340 17IRH-81LL003BMH: Intel Core i7-9750H, 17.30", 2.8 kg
External Review » Lenovo Ideapad L340 17IRH-81LL003BMH
HP Pavilion Gaming 15-ec2253ng: AMD Ryzen 5 5600H, 15.60", 2.3 kg
External Review » HP Pavilion Gaming 15-ec2253ng
Acer Aspire 7 A715-42G-R9LH: AMD Ryzen 7 5700U, 15.60", 2.2 kg
External Review » Acer Aspire 7 A715-42G-R9LH
HP Pavilion Gaming 15-ec1073dx: AMD Ryzen 5 4600H, 15.60", 2 kg
External Review » HP Pavilion Gaming 15-ec1073dx
Dell Vostro 15 7500-0323: Intel Core i7-10750H, 15.60", 1.9 kg
External Review » Dell Vostro 15 7500-0323
Medion Erazer Crawler E10: Intel Core i5-10300H, 15.60", 2.2 kg
External Review » Medion Erazer Crawler E10
Acer Nitro 5 AN515-56-75HR: Intel Core i7-11370H, 15.60", 2.3 kg
External Review » Acer Nitro 5 AN515-56-75HR
Asus ROG Flow X13 GV301QH-K5228T: AMD Ryzen 9 5980HS, 13.40", 1.3 kg
External Review » Asus ROG Flow X13 GV301QH-K5228T
Acer Nitro 5 AN515-56-58CQ: Intel Core i5-11300H, 15.60", 2.3 kg
External Review » Acer Nitro 5 AN515-56-58CQ
Asus TUF FX505DT-HN540: AMD Ryzen 7 3750H, 15.60", 2.2 kg
External Review » Asus TUF FX505DT-HN540
Asus ROG Flow X13 GV301QH-K5232T: AMD Ryzen 9 5980HS, 13.40", 1.3 kg
External Review » Asus ROG Flow X13 GV301QH-K5232T
Lenovo IdeaPad Gaming 3 15ARH05-82EY00CQSP: AMD Ryzen 7 4800H, 15.60", 2.2 kg
External Review » Lenovo IdeaPad Gaming 3 15ARH05-82EY00CQSP
Acer Nitro 5 AN515-43-R6BW: AMD Ryzen 5 3550H, 15.60", 2.3 kg
External Review » Acer Nitro 5 AN515-43-R6BW
Acer Aspire 7 A715-42G-R0XB: AMD Ryzen 5 5500U, 15.60", 2.2 kg
External Review » Acer Aspire 7 A715-42G-R0XB
Lenovo IdeaPad 3 15IMH05-81Y400DWMH: Intel Core i5-10300H, 15.60", 2.2 kg
External Review » Lenovo IdeaPad 3 15IMH05-81Y400DWMH
Acer Aspire Nitro 5 AN517-53-51FQ: Intel Core i5-11300H, 17.30", 2.7 kg
External Review » Acer Aspire Nitro 5 AN517-53-51FQ
LG Ultra 17U70N-J.AA78B: Intel Core i7-10510U, 17.30"
External Review » LG Ultra 17U70N-J.AA78B
Lenovo IdeaPad 3 15ARH05-82EY00CNSP: AMD Ryzen 7 4800H, 15.60", 2.2 kg
External Review » Lenovo IdeaPad 3 15ARH05-82EY00CNSP
HP Pavilion 15-ec1155nd: AMD Ryzen 5 4600H, 15.60", 2 kg
External Review » HP Pavilion 15-ec1155nd
Acer Nitro 5 AN515-44-R8QT: AMD Ryzen 5 4600H, 15.60", 2.4 kg
External Review » Acer Nitro 5 AN515-44-R8QT
Asus TUF Gaming F15 FX506LH-BQ116: Intel Core i7-10870H, 15.60", 2.3 kg
External Review » Asus TUF Gaming F15 FX506LH-BQ116
HP Gaming Pavilion 15-ec1005ns: AMD Ryzen 5 4600H, 15.60", 2 kg
External Review » HP Gaming Pavilion 15-ec1005ns
Lenovo IdeaPad 3 15ARH05-82EY00BSMH: AMD Ryzen 7 4800H, 15.60", 2.2 kg
External Review » Lenovo IdeaPad 3 15ARH05-82EY00BSMH
Lenovo Yoga Creator 7 15IMH05 82DS000VGE: Intel Core i7-10750H, 15.60", 1.8 kg
External Review » Lenovo Yoga Creator 7 15IMH05-82DS000VGE
Asus TUF Gaming A15 FA506IH-AS53: AMD Ryzen 5 4600H, 15.60", 2.3 kg
External Review » Asus TUF Gaming A15 FA506IH-AS53
Acer ConceptD 3 CN314-72G-744X: Intel Core i7-10750H, 14.00", 1.5 kg
External Review » Acer ConceptD 3 CN314-72G-744X
Lenovo Ideapad Creator 5 15IMH05-82D4003UCK: Intel Core i5-10300H, 15.60", 2.2 kg
External Review » Lenovo Ideapad Creator 5 15IMH05-82D4003UCK
HP Pavilion Gaming 16-a0031ns: Intel Core i5-10300H, 16.10", 2.4 kg
External Review » HP Pavilion Gaming 16-a0031ns
Acer Aspire Nitro 5 AN515-44-R329: AMD Ryzen 5 4600H, 15.60", 2.4 kg
External Review » Acer Aspire Nitro 5 AN515-44-R329
Acer Aspire 7 A715-75G-59MG: Intel Core i5-10300H, 15.60", 2.2 kg
External Review » Acer Aspire 7 A715-75G-59MG
Lenovo Legion 5 17IMH05: Intel Core i5-10300H, 17.30", 2.9 kg
External Review » Lenovo Legion 5 17IMH05
Asus TUF Gaming A15 FA506IH-BQ027T: AMD Ryzen 7 4800H, 15.60", 2.3 kg
External Review » Asus TUF Gaming A15 FA506IH-BQ027T
Acer Nitro 5 AN515-44-R99Q: AMD Ryzen 5 4600H, 15.60", 2.4 kg
External Review » Acer Nitro 5 AN515-44-R99Q
Lenovo Yoga Slim 7 15IMH05-82AB003CUK: Intel Core i7-10750H, 15.60", 1.8 kg
External Review » Lenovo Yoga Slim 7 15IMH05-82AB003CUK
LG Ultra 17U70N-R.AAS8U1: Intel Core i7-10510U, 17.00", 2 kg
External Review » LG Ultra 17U70N-R.AAS8U1
HP Pavilion Gaming 15-dk1041tx: Intel Core i7-10750H, 15.60", 2.3 kg
External Review » HP Pavilion Gaming 15-dk1041tx
HP Pavilion Gaming 16-a0006ns: Intel Core i5-10300H, 15.60", 2.4 kg
External Review » HP Pavilion Gaming 16-a0006ns
Lenovo Legion 5 15IMH05-82AU00B1SP: Intel Core i7-10750H, 15.60", 2.3 kg
External Review » Lenovo Legion 5 15IMH05-82AU00B1SP
Asus TUF Gaming F15 FX506LH-BQ030: Intel Core i7-10750H, 15.60", 2.3 kg
External Review » Asus TUF FX506LH-BQ030
Asus TUF Gaming F15 FX506LH-BQ034: Intel Core i5-10300H, 15.60", 2.3 kg
External Review » Asus TUF FX506LH-BQ034
Lenovo Legion Y7000SE: Intel Core i5-9300HF, 15.60"
External Review » Lenovo Legion Y7000SE
HP Pavilion Gaming 16-a0022ns: Intel Core i5-10300H, 16.10", 2.4 kg
External Review » HP Pavilion Gaming 16-a0022ns
Asus TUF FX505DT-BQ613T: AMD Ryzen 7 3750H, 15.60", 2.2 kg
External Review » Asus TUF FX505DT-BQ613T
Lenovo Yoga Slim 7 15IMH05-82AB002WMH: Intel Core i5-10300H, 15.60", 1.8 kg
External Review » Lenovo Yoga Slim 7 15IMH05-82AB002WMH
Acer Nitro 5 AN515-44-R4P7: AMD Ryzen 7 4800H, 15.60", 2.4 kg
External Review » Acer Nitro 5 AN515-44-R4P7
MSI GF63 Thin 10SCXR-042XES: Intel Core i7-10750H, 15.60", 1.9 kg
External Review » MSI GF63 Thin 10SCXR-042XES
Lenovo Legion 5 15ARH05-82B500D3SP: AMD Ryzen 7 4800H, 15.60", 2.3 kg
External Review » Lenovo Legion 5 15ARH05-82B500D3SP
Asus TUF FX505GT-BQ108: Intel Core i5-9300H, 15.60", 2.2 kg
External Review » Asus TUF FX505GT-BQ108
HP Pavilion Gaming 16-a0000ns: Intel Core i5-10300H, 16.10", 2.4 kg
External Review » HP Pavilion Gaming 16-a0000ns
HP Pavilion Gaming 15-ec1009ns: AMD Ryzen 5 4600H, 15.60", 2 kg
External Review » HP Pavilion Gaming 15-ec1009ns
Asus F571GT-AL311T: Intel Core i7-9750H, 15.60", 1.8 kg
External Review » Asus F571GT-AL311T
Acer Nitro 5 AN515-44-R55M: AMD Ryzen 5 4600H, 15.60", 2.4 kg
External Review » Acer Nitro 5 AN515-44-R55M
Lenovo IdeaPad S540-15IWL-81SW002AGE: Intel Core i7-8565U, 15.60", 1.8 kg
External Review » Lenovo IdeaPad S540-15IWL-81SW002AGE
HP Gaming Pavilion 15-dk0025ns: Intel Core i5-9300H, 15.60", 2.2 kg
External Review » HP Gaming Pavilion 15-dk0025ns
Acer Nitro 5 AN515-55-598S: Intel Core i5-10300H, 15.60", 2.3 kg
External Review » Acer Nitro 5 AN515-55-598S
MSI GF63 Thin 10SCXR-405XES: Intel Core i7-10750H, 15.60", 1.9 kg
External Review » MSI GF63 Thin 10SCXR-405XES
Dell G3 15 3500-3KJ99: Intel Core i5-10300H, 15.60", 2.6 kg
External Review » Dell G3 15 3500-3KJ99
Lenovo IdeaPad Gaming 3i 15IMH05: Intel Core i5-10300H, 15.60", 2.2 kg
External Review » Lenovo IdeaPad Gaming 3i 15IMH05
Acer Nitro 5 AN515-55-7075: Intel Core i7-10750H, 15.60", 2.3 kg
External Review » Acer Nitro 5 AN515-55-7075
Acer Aspire 7 A715-41G-R8MJ: AMD Ryzen 5 3550H, 15.60", 2.2 kg
External Review » Acer Aspire 7 A715-41G-R8MJ
HP Omen 15-dc1049ns: Intel Core i5-9300H, 15.60", 2.3 kg
External Review » HP Omen 15-dc1049ns
Lenovo Legion Y540-15IRH-PG0: Intel Core i7-9750H, 15.60", 1.3 kg
External Review » Lenovo Legion Y540-15IRH-PG0
Lenovo Legion 5 15IMH05-82AU004YVN: Intel Core i7-10750H, 15.60", 2.4 kg
External Review » Lenovo Legion 5 15IMH05-82AU004YVN
Acer Nitro 5 AN517-52-7995: Intel Core i7-10750H, 17.30", 2.2 kg
External Review » Acer Nitro 5 AN517-52-7995
Lenovo IdeaPad Gaming 3i 15-81Y400NESB: Intel Core i7-10750H, 15.60", 2.2 kg
External Review » Lenovo IdeaPad Gaming 3i 15-81Y400NESB
Acer Aspire 7 A715-41G-R5LR: AMD Ryzen 5 3550H, 15.60", 2.4 kg
External Review » Acer Aspire 7 A715-41G-R5LR
HP Pavilion Gaming 15-ec1011ns: AMD Ryzen 5 4600H, 15.60", 2 kg
External Review » HP Pavilion Gaming 15-ec1011ns
Asus TUF FX505DT-BQ600: AMD Ryzen 7 3750H, 15.60", 2.2 kg
External Review » Asus TUF FX505DT-BQ600
HP Gaming Pavilion 15-dk0031ns: Intel Core i7-9750H, 15.60", 2.3 kg
External Review » HP Gaming Pavilion 15-dk0031ns
Asus X571GT-BQ597: Intel Core i5-8300H, 15.60", 2 kg
External Review » Asus X571GT-BQ597
Lenovo Legion 5 15ARH05-82B500CFGE: AMD Ryzen 7 4800H, 15.60", 2.3 kg
External Review » Lenovo Legion 5 15ARH05-82B500CFGE
Asus TUF FX505DT-BQ208: AMD Ryzen 7 3750H, 15.60", 2.2 kg
External Review » Asus TUF FX505DT-BQ208
Acer Nitro 5 AN515-55-53YW: Intel Core i5-10300H, 15.60", 2.3 kg
External Review » Acer Nitro 5 AN515-55-53YW
Acer Aspire 7 A715-41G-R3J5: AMD Ryzen 7 3750H, 15.60", 2.4 kg
External Review » Acer Aspire 7 A715-41G-R3J5
Acer Aspire 7 A715-74G-77AW: Intel Core i7-9750H, 15.60", 2.4 kg
External Review » Acer Aspire 7 A715-74G-77AW
Asus ROG Strix G531GT-BQ165: Intel Core i7-9750H, 15.60", 2.4 kg
External Review » Asus ROG Strix G531GT-BQ165
MSI Prestige 14 A10SC-067XES: Intel Core i7-10710U, 14.00", 1.3 kg
External Review » MSI Prestige 14 A10SC-067XES
Acer ConceptD 3 CN315-71-76MR: Intel Core i7-9750H, 15.60", 2.4 kg
External Review » Acer ConceptD 3 CN315-71-76MR
Asus TUF FX505DT-BQ051: AMD Ryzen 5 3550H, 15.60", 2.2 kg
External Review » Asus TUF FX505DT-BQ051
HP Gaming Pavilion 15-dk0026ns: Intel Core i7-9750H, 15.60", 2.2 kg
External Review » HP Gaming Pavilion 15-dk0026ns
Acer Nitro 5 AN515-43-R84P: AMD Ryzen 5 3550H, 15.60"
External Review » Acer Nitro 5 AN515-43-R84P
HP Pavilion Gaming 15-ec0014nl: AMD Ryzen 7 3750H, 15.60", 2.3 kg
External Review » HP Pavilion Gaming 15-ec0014nl
Asus TUF FX505GT-BQ025: Intel Core i5-9300H, 15.60", 2.2 kg
External Review » Asus TUF FX505GT-BQ025
MSI Prestige 14 A10SC-096NE: Intel Core i7-10710U, 14.00", 1.3 kg
External Review » MSI Prestige 14 A10SC-096NE
Acer Nitro 5 AN517-51-55ML: Intel Core i5-9300H, 17.30", 2.7 kg
External Review » Acer Nitro 5 AN517-51-55ML
Lenovo Ideapad L340-15IRH-81LK00CDSP: Intel Core i7-9750H, 15.60", 2.2 kg
External Review » Lenovo Ideapad L340-15IRH-81LK00CDSP
Acer Aspire Nitro 5 AN515-54-7793: Intel Core i7-9750H, 15.60", 2.5 kg
External Review » Acer Aspire Nitro 5 AN515-54-7793
HP Pavilion Gaming 15-dk0002ns: Intel Core i5-9300H, 15.60", 2.3 kg
External Review » HP Pavilion Gaming 15-dk0002ns
Asus TUF FX505GT-BQ028: Intel Core i7-9750H, 15.60", 2.2 kg
External Review » Asus TUF FX505GT-BQ028
MSI Prestige 15 A10SC-007ES: Intel Core i7-10710U, 15.60", 1.7 kg
External Review » MSI Prestige 15 A10SC-007ES
Asus TUF FX505DT-BQ121: AMD Ryzen 7 3750H, 15.60", 2.2 kg
External Review » Asus TUF FX505DT-BQ121
MSI GF75 Thin 9SC-277XES: Intel Core i7-9750H, 17.30", 2.2 kg
External Review » MSI GF75 Thin 9SC-277XES
HP Pavilion Gaming 15-ec0003ns: AMD Ryzen 7 3750H, 15.60", 2.3 kg
External Review » HP Pavilion Gaming 15-ec0003ns
MSI Prestige 14 A10SC-012ES: Intel Core i7-10710U, 14.00", 1.3 kg
External Review » MSI Prestige 14 A10SC-012ES
HP Omen 15-dc1010nr: Intel Core i7-9750H, 15.60", 2.6 kg
External Review » HP Omen 15-dc1010nr
Acer Aspire Nitro 5 AN517-51-76MG: Intel Core i7-9750H, 15.60", 2.5 kg
External Review » Acer Aspire Nitro 5 AN517-51-76MG
Samsung Odyssey 2 NP850XBD-XG1BR: Intel Core i5-9300H, 15.60", 2.4 kg
External Review » Samsung Odyssey 2 NP850XBD-XG1BR
HP Pavilion 15-BC520NS: Intel Core i7-9750H, 15.60", 2.2 kg
External Review » HP Pavilion 15-BC520NS
Acer Aspire Nitro 7 AN715-51-76XG: Intel Core i7-8750H, 15.60", 2.5 kg
External Review » Acer Aspire Nitro 7 AN715-51-76XG
Acer Predator Triton 300 PT315-51-58BG: Intel Core i5-9300H, 15.60", 2.5 kg
External Review » Acer Predator Triton 300 PT315-51-58BG
Lenovo Legion Y540-15IRH-81SY00A2SP: Intel Core i5-9300H, 15.60", 2.3 kg
External Review » Lenovo Legion Y540-15IRH-81SY00A2SP
Asus TUF FX505GT-BQ024: Intel Core i7-9750H, 15.60", 2.2 kg
External Review » Asus TUF FX505GT-BQ024
HP Pavilion 15-bc521ns: Intel Core i5-9300H, 15.60", 2.1 kg
External Review » HP Pavilion 15-bc521ns
Dell G3 15 3590-GN3R591AU: Intel Core i7-9750H, 15.60", 2.7 kg
External Review » Dell G3 15 3590-GN3R591AU
Acer Nitro 5 AN515-54-749V: Intel Core i7-9750H, 15.60", 2.5 kg
External Review » Acer Nitro 5 AN515-54-749V
Dell G3 3590: Intel Core i5-9300H, 15.60", 2.5 kg
External Review » Dell G3 3590
Acer Predator Triton 300 PT315-51-7815: Intel Core i7-9750H, 15.60", 2.3 kg
External Review » Acer Predator Triton 300 PT315-51-7815
HP Gaming Pavilion 15-dk0046nr: Intel Core i7-9750H, 15.60", 2.3 kg
External Review » HP Gaming Pavilion 15-dk0046nr
MSI GL65 9SC-004: Intel Core i5-9300H, 15.60", 2.3 kg
External Review » MSI GL65 9SC-004
MSI GF63 9SC-621: Intel Core i5-9300H, 15.60", 1.9 kg
External Review » MSI GF63 9SC-621
Lenovo IdeaPad L340-15IRH 81LK00BMGE: Intel Core i5-9300H, 15.60", 2.1 kg
External Review » Lenovo IdeaPad L340-15IRH 81LK00BMGE
Acer Aspire 7 A715-74G-743J: Intel Core i7-9750H, 15.60", 2.4 kg
External Review » Acer Aspire 7 A715-74G-743J
MSI GF75 Thin 9SC-061XES: Intel Core i7-9750H, 17.30", 2.2 kg
External Review » MSI GF75 Thin 9SC-061XES
Acer Nitro 5 AN517-51-77B8: Intel Core i7-9750H, 17.30", 2.7 kg
External Review » Acer Nitro 5 AN517-51-77B8
HP Gaming Pavilion 17-cd0222ng: Intel Core i5-9300H, 17.30", 2.8 kg
External Review » HP Gaming Pavilion 17-cd0222ng
Asus ROG Strix G531GT-BQ012 : Intel Core i7-9750H, 15.60", 2.4 kg
External Review » Asus ROG Strix G531GT-BQ012
Acer Aspire 7 A715-74G-53YM: Intel Core i5-9300H, 15.60", 2.4 kg
External Review » Acer Aspire 7 A715-74G-53YM
Asus Strix G G531GT-BI7N6: Intel Core i7-9750H, 15.60", 2.4 kg
External Review » Asus Strix G G531GT-BI7N6
Acer Nitro 5 AN517-51-56YW: Intel Core i5-9300H, 17.30", 2.7 kg
External Review » Acer Nitro 5 AN517-51-56YW
Acer Predator Triton 300-15: Intel Core i7-9750H, 15.60", 2.3 kg
External Review » Acer Predator Triton 300-15
Lenovo Legion Y540-15IRH-81SY00A6SP: Intel Core i7-9750H, 15.60", 2.3 kg
External Review » Lenovo Legion Y540-15IRH-81SY00A6SP
Dell XPS 15 7590-K6XWV: Intel Core i7-9750H, 15.60", 2 kg
External Review » Dell XPS 15 7590-K6XWV
Acer Nitro 5 AN517-51-70U7: Intel Core i7-9750H, 17.30", 2.7 kg
External Review » Acer Nitro 5 AN517-51-70U7
Lenovo Ideapad L340-15IRH-81LK0093MB: Intel Core i7-9750H, 15.60", 2.2 kg
External Review » Lenovo Ideapad L340-15IRH-81LK0093MB
Dell G3 15 3590-cn35917: Intel Core i5-9300H, 15.60", 2.4 kg
External Review » Dell G3 15 3590-cn35917
HP Pavilion 15-dk0042tx: Intel Core i7-9750H, 15.60", 2.3 kg
External Review » HP Pavilion 15-dk0042tx
Lenovo Legion Y545-15-81T20005US: Intel Core i7-9750H, 15.60", 2.3 kg
External Review » Lenovo Legion Y545-15-81T20005US
Asus ROG Strix G531GT-BQ020: Intel Core i7-9750H, 15.60", 2.4 kg
External Review » Asus ROG Strix G531GT-BQ020
Acer Nitro 7 AN715-51-752B: Intel Core i7-9750H, 15.60", 2.7 kg
External Review » Acer Nitro 7 AN715-51-752B
Lenovo Legion Y540 15-IRH-81SY001KSB: Intel Core i7-9750H, 15.60", 2.3 kg
External Review » Lenovo Legion Y540 15-IRH-81SY001KSB
Acer Nitro 5 AN515-54-73KT: Intel Core i7-9750H, 15.60", 2.7 kg
External Review » Acer Nitro 5 AN515-54-73KT
Asus ROG Strix G531GT-BQ005: Intel Core i5-9300H, 15.60", 2.4 kg
External Review » Asus ROG Strix G531GT-BQ005
MSI PS63 Modern 8SC-054ES: Intel Core i7-8565U, 15.60", 1.6 kg
External Review » MSI PS63 Modern 8SC-054ES
Asus Strix G531GT-BI7N6: Intel Core i7-9750H, 15.60", 2.4 kg
External Review » Asus Strix G531GT-BI7N6
Asus TUF FX705DT-AU028T: AMD Ryzen 7 3750H, 17.30", 2.6 kg
External Review » Asus TUF FX705DT-AU028T
Dell G5 15 5590-PCNJJ: Intel Core i5-9300H, 15.60", 2.7 kg
External Review » Dell G5 15 5590-PCNJJ
Dell XPS 15 7590 9980HK GTX 1650: Intel Core i9-9980HK, 15.60", 2 kg
External Review » Dell XPS 15 7590 9980HK GTX 1650
Asus TUF FX505DT-EB73: AMD Ryzen 7 3750H, 15.60", 2.2 kg
External Review » Asus TUF FX505DT-EB73
Dell XPS 15 7590: Intel Core i9-9980HK, 15.60", 2 kg
External Review » Dell XPS 15 7590
Acer Aspire Nitro 5 AN515-54-72J1: Intel Core i7-9750H, 15.60", 2.3 kg
External Review » Acer Aspire Nitro 5 AN515-54-72J1
MSI GF63 Thin 9SC-047XES: Intel Core i7-9750H, 15.60", 1.9 kg
External Review » MSI GF63 Thin 9SC-047XES
Lenovo Ideapad L340-17IRH-81LL001YGE: Intel Core i5-9300H, 17.30", 2.5 kg
External Review » Lenovo Ideapad L340-17IRH-81LL001YGE
Lenovo Ideapad L340-15IRH-81LK0001UK: Intel Core i5-9300H, 15.60", 2.2 kg
External Review » Lenovo Ideapad L340-15IRH-81LK0001UK
Acer Aspire Nitro 5 AN515-54-53Z2: Intel Core i5-9300H, 15.60", 2.2 kg
External Review » Acer Aspire Nitro 5 AN515-54-53Z2
Acer Aspire Nitro 7 AN715-51: Intel Core i7-8750H, 15.60", 2.2 kg
External Review » Acer Aspire Nitro 7 AN715-51
Lenovo IdeaPad 5 Pro 16ACH: AMD Ryzen 7 5800H, 16.00", 2 kg
» Lenovo IdeaPad 5 Pro 16ACH with Ryzen 5000: Mid-range laptop almost reaches high-end level
Lenovo Yoga Creator 7 15IMH05 82DS000VGE: Intel Core i7-10750H, 15.60", 1.8 kg
» Lenovo Yoga Creator 7 15IHM05: Lightweight multimedia allrounder with a good battery life
Lenovo Legion 5 17IMH05: Intel Core i5-10300H, 17.30", 2.9 kg
» Processor and graphics core of the Lenovo Legion 5 17IMH05 are able to run at constant full power
HP Pavilion Gaming 15-ec1206ng: AMD Ryzen 5 4600H, 15.60", 2.1 kg
» Designed to look like a gaming device but actually an all-rounder: The HP Pavilion Gaming 15-ec1206ng
Nexoc GH5 515IG: Intel Core i5-10300H, 15.60", 2.1 kg
» The Nexoc GH5 515IG gaming laptop can be individually customized to your own needs
Lenovo IdeaPad Gaming 3i 15IMH05: Intel Core i5-10300H, 15.60", 2.2 kg
» The Lenovo IdeaPad Gaming 3i 15IMH05 fully exploits its CPU and GPU
MSI GF75 Thin 10SCXR: Intel Core i5-10300H, 17.30", 2.2 kg
» The MSI GF75 has a 'Silent mode'. The problem? It's not actually silent
» Intel Core i5-10300H vs. AMD Ryzen 7 3750H: Another sideways step for Intel
Lenovo ThinkPad X1 Extreme 2019 20QV000WGE: Intel Core i7-9750H, 15.60", 1.7 kg
» Lenovo ThinkPad X1 Extreme Gen 2: A multimedia laptop that succeeds in being worse than its predecessor
» ThinkPad X1 Extreme 2019: 4K panel costs almost 50% battery life
Lenovo IdeaPad L340-15IRH 81LK00BMGE: Intel Core i5-9300H, 15.60", 2.1 kg
» Gaming doesn't have to be expensive: Low-priced entry with Lenovo's IdeaPad L340 and GeForce GTX graphics