 Deutsch
 English
 Español
 Français
 Italiano
 Nederlands
 Polski
 Português
 Русский
 Türkçe
 Svenska
 Chinese
 Magyar
Intel Processor N50 vs Apple M3
Intel Processor N50
► remove from comparison
The Intel Processor N50 is an entry-level mobile CPU for thin and light laptops from the Alder Lake-N series. It was announced in early 2023 and offers no performance cores and 2 of the 8 efficient cores (E-cores, Gracemont architecture). The chip does not support HyperThreading and clocks with up to 3.4 GHz. The performance of the E-cores should be similar to old Skylake cores (compare to the Core i7-6700HQ). All cores can use up to 6 MB L3-cache.
Performance
The performance is clearly lower than the Processor N100 (4 cores, 3.4 GHz) due to the reduced core count. The single thread performance however, should be similar. Compared to older processors, the N50 should be comparable to dual core Skylake based CPUs like the Intel Core m3-8100Y (2x 3.4 GHz, 5W).Features
The Alder Lake-N chips only support single channel memory with up to DDR5-4800, DDR4-3200 or LPDDR5-4800. The chip also supports Quick Sync and AV1 decoding (most likely same engine as in Alder Lake). Furthermore, Wi-Fi 6E and Bluetooth 5.2 are partly integrated (but no Thunderbolt). External chips can be connected via PCIe Gen3 x9 (via the PCH).
The integrated graphics adapter is based on the Xe-architecture and offers only 16 of the 32 EUs (Execution Units) operating at only up to 750 MHz. Due to the single channel memory, low clock speeds, and low shader count, the gaming performance of the iGPU is very limited.
Power consumption
The N50 has a base power consumption of only 6 W and is therefore suited for fanless cooling. The CPU is built with a further improved 10nm SuperFin process at Intel (called Intel 7).
Apple M3
► remove from comparison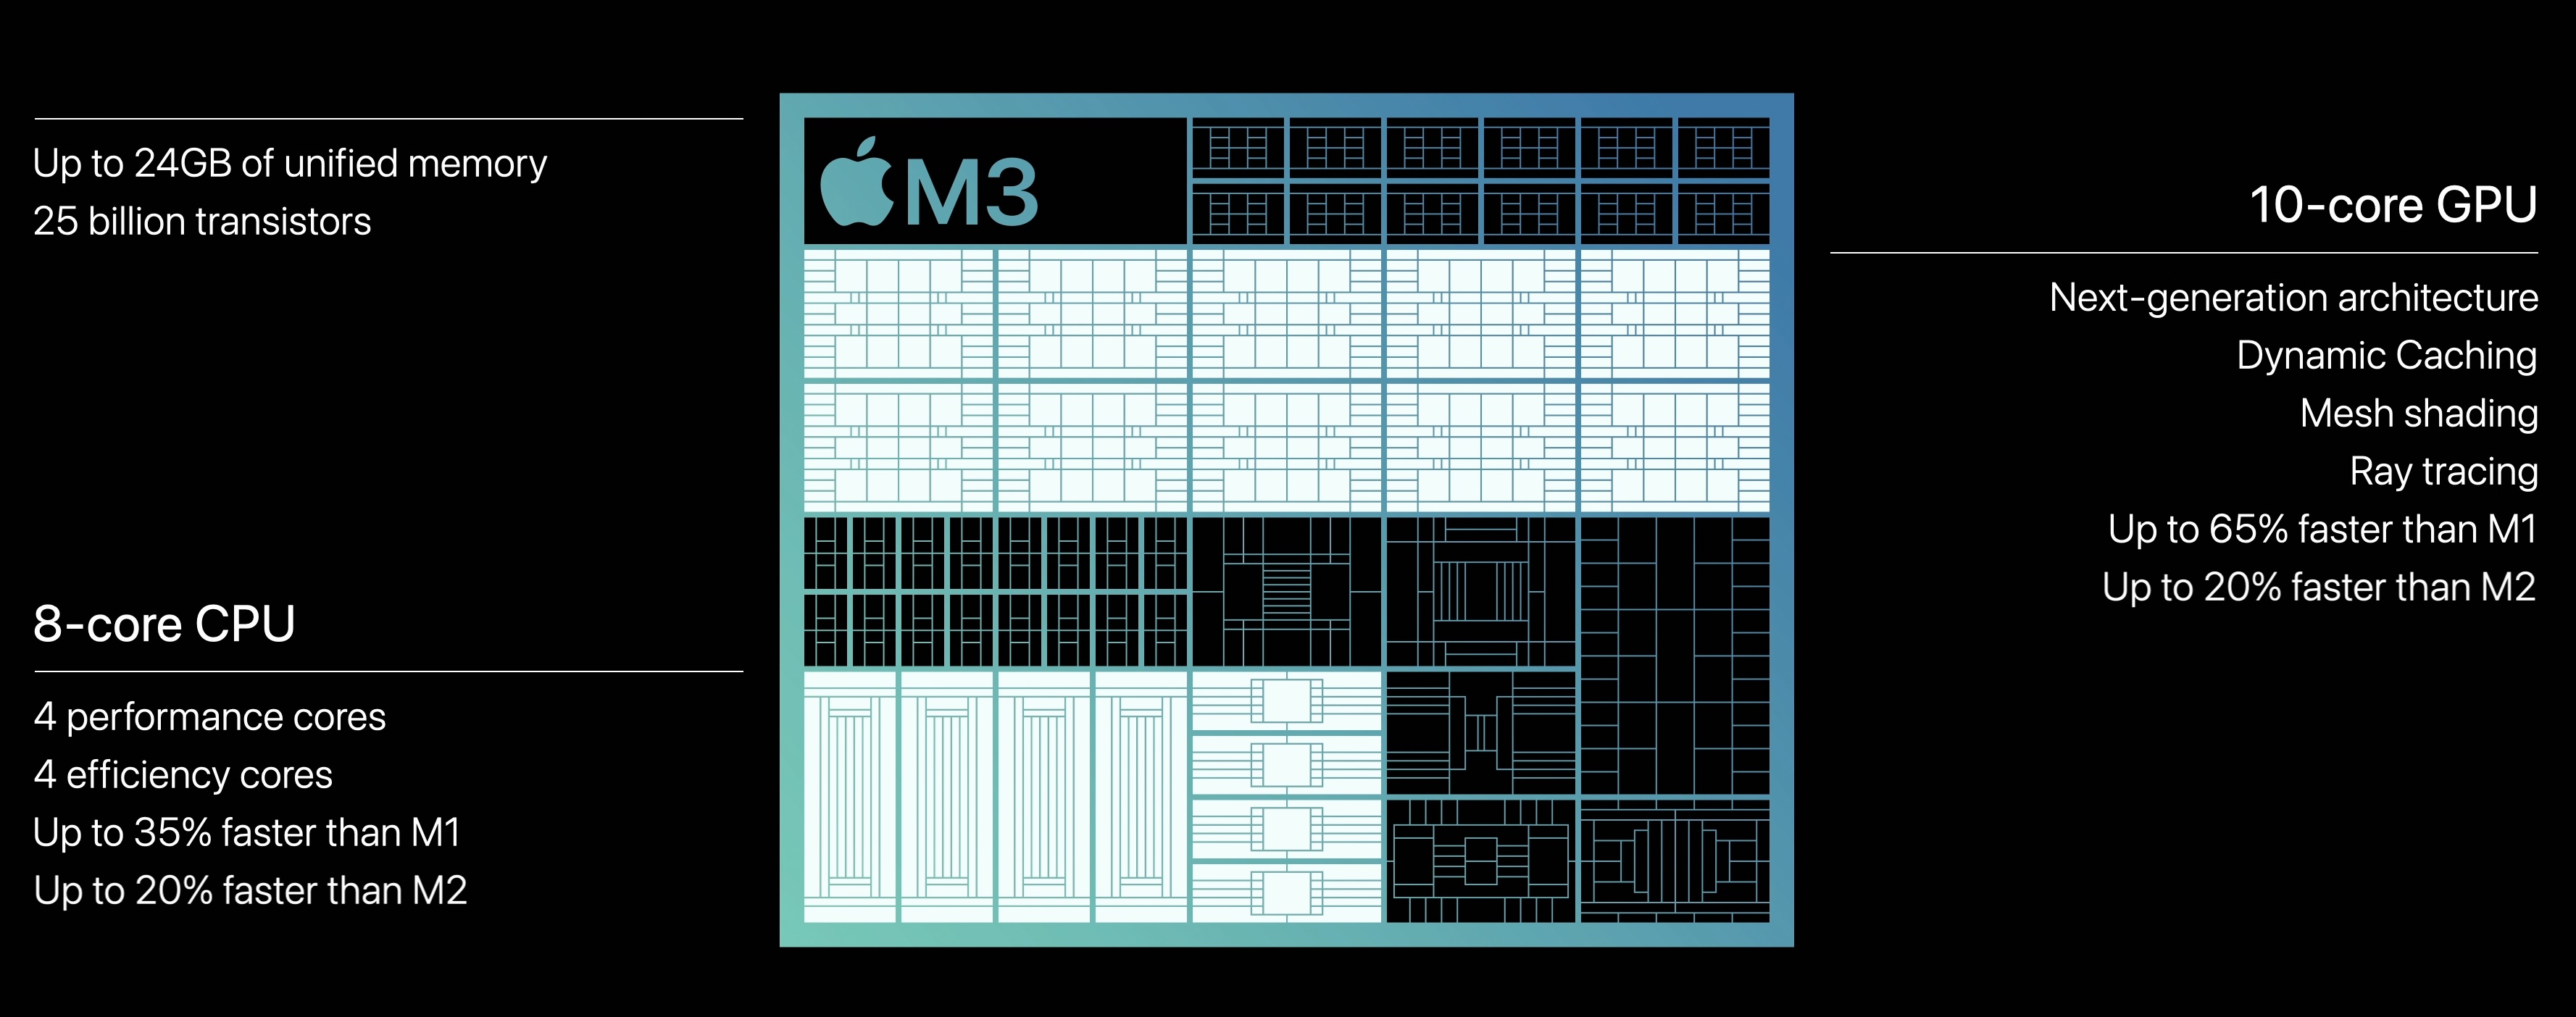
The Apple M3 is a system on a chip (SoC) from Apple for notebooks that was introduced in late 2023. It integrates a new 8-core CPU with 4 performance cores with up to 4.06 GHz and 4 efficiency cores running at up to 2.75 GHz. Apple claims that the CPU is up to 20% faster than in the old Apple M2 (3.5 GHz).
Due to the higher clock speeds and architecture improvements, the processor performance is also significantly better than the M2 in benchmarks (see e.g. Geekbench below) and can keep up with the fastest CPUs in short single-core tests (like the Raptor Lake i9-13950HX).
The M3 also integrates a new graphics adapter with dynamic caching, mesh shading and ray tracing acceleration. According to Apple, it is 20% faster than the GPU in the M2. The chip integrates again 10 GPU cores, but the cheaper variant only offers 8 cores (e.g. in the entry iMac). Furthermore, the GPU only supports 2 displays (an additional 6K60 display to the internal one).
Both GPU and CPU can access the unified memory on the package together. It is still available in 8, 16 and 24 GB variants and offers the same 100 GB/s maximum bandwidth (unlike the Pro models that feature a reduced memory bandwidth).
The integrated 16-core Neural Engine has also been revised and now offers 18 TOPS peak performance (versus 15.8 TOPS in the M2 but 35 TOPS in the new A17 Pro). The video engine now supports AV1 decoding in hardware. H.264, HEVC and ProRes (RAW) can still be decoded and encoded.
Unfortunately, the integrated wireless network module only supports Wi-Fi 6E (no Wi-Fi 7) and due to the support of only a single external monitor, the chip also has to make do with no Thunderbolt 4 (Thunderbolt 3 / USB 4 support only for up to 40 Gbit/s).
The chip is manufactured on the current 3nm TSMC process (N3B most likely) and contains 25 billion transistors (+25% vs. Apple M2). The 3nm process should also contribute to the excellent efficiency of the chip. Under load, the M3 CPU consumes approximately 20 Watt.
| Model | Intel Processor N50 | Apple M3 | ||||||||||||||||||||||||||||||||||||||||||||||||
| Series | Intel Alder Lake-N | Apple Apple M3 | ||||||||||||||||||||||||||||||||||||||||||||||||
| Codename | Alder Lake-N | |||||||||||||||||||||||||||||||||||||||||||||||||
| Series: Apple M3 |
|
| ||||||||||||||||||||||||||||||||||||||||||||||||
| Clock | 1000 - 3400 MHz | 2748 - 4056 MHz | ||||||||||||||||||||||||||||||||||||||||||||||||
| L3 Cache | 6 MB | |||||||||||||||||||||||||||||||||||||||||||||||||
| Cores / Threads | 2 / 2 2 x 3.4 GHz Intel Gracemont E-Core | 8 / 8 4 x 4.1 GHz Apple M3 P-Core 4 x 2.7 GHz Apple M3 E-Core | ||||||||||||||||||||||||||||||||||||||||||||||||
| TDP | 6 Watt | |||||||||||||||||||||||||||||||||||||||||||||||||
| Technology | 10 nm | 3 nm | ||||||||||||||||||||||||||||||||||||||||||||||||
| max. Temp. | 105 °C | |||||||||||||||||||||||||||||||||||||||||||||||||
| iGPU | Intel UHD Graphics Xe 16EUs (Tiger Lake-H) ( - 750 MHz) | Apple M3 10-Core GPU | ||||||||||||||||||||||||||||||||||||||||||||||||
| Architecture | x86 | ARM | ||||||||||||||||||||||||||||||||||||||||||||||||
| Announced | ||||||||||||||||||||||||||||||||||||||||||||||||||
| Manufacturer | ark.intel.com | www.apple.com | ||||||||||||||||||||||||||||||||||||||||||||||||
| L2 Cache | 4 MB | |||||||||||||||||||||||||||||||||||||||||||||||||
| Transistors | 25000 Million | |||||||||||||||||||||||||||||||||||||||||||||||||
| Features | ARMv8 Instruction Set |

