Intel Processor N100 vs Intel Core i7-11700K vs Intel Core i9-11900K
Intel Processor N100 ► remove from comparison
The Intel Processor N100 is an entry-level mobile CPU for thin and light laptops from the Alder Lake-N series. It was announced in early 2023 and offers no performance cores and 4 of the 8 efficient cores (E-cores, Gracemont architecture). The chip does not support HyperThreading and clocks with 1 to 3.4 GHz. The performance of the E-cores should be similar to old Skylake cores (compare to the Core i7-6700HQ ). All cores can use up to 6 MB L3-cache.
Performance
The average N100 in our database delivers unimpressive multi-thread benchmark scores that are most similar to those of the Core i3-1115G4 . The chip is fast enough for many day-to-day tasks, but not much more than that; the other thing to keep in mind is that of the two N100-toting systems tested by us as of October 2023, both have rather high CPU power limits. The chip will be noticeably slower if limited to just six or seven Watts.
Features
The Alder Lake-N chips only support single channel memory with up to DDR5-4800, DDR4-3200 or LPDDR5-4800. The chip also supports Quick Sync and AV1 decoding (most likely same engine as in Alder Lake). Furthermore, Wi-Fi 6E and Bluetooth 5.2 are partly integrated (but no Thunderbolt). External chips can be connected via PCIe Gen3 x9 (via the PCH).
The integrated graphics adapter is based on the Xe-architecture and offers only 24 of the 32 EUs (Execution Units) operating at only 450 - 750 MHz. Due to the single channel memory, low clock speeds, and low shader count, the gaming performance of the iGPU is very limited.
Power consumption
The N100 has a base power consumption of only 6 W and is therefore suited for fanless cooling. The CPU is built with a further improved 10nm SuperFin process at Intel (called Intel 7).
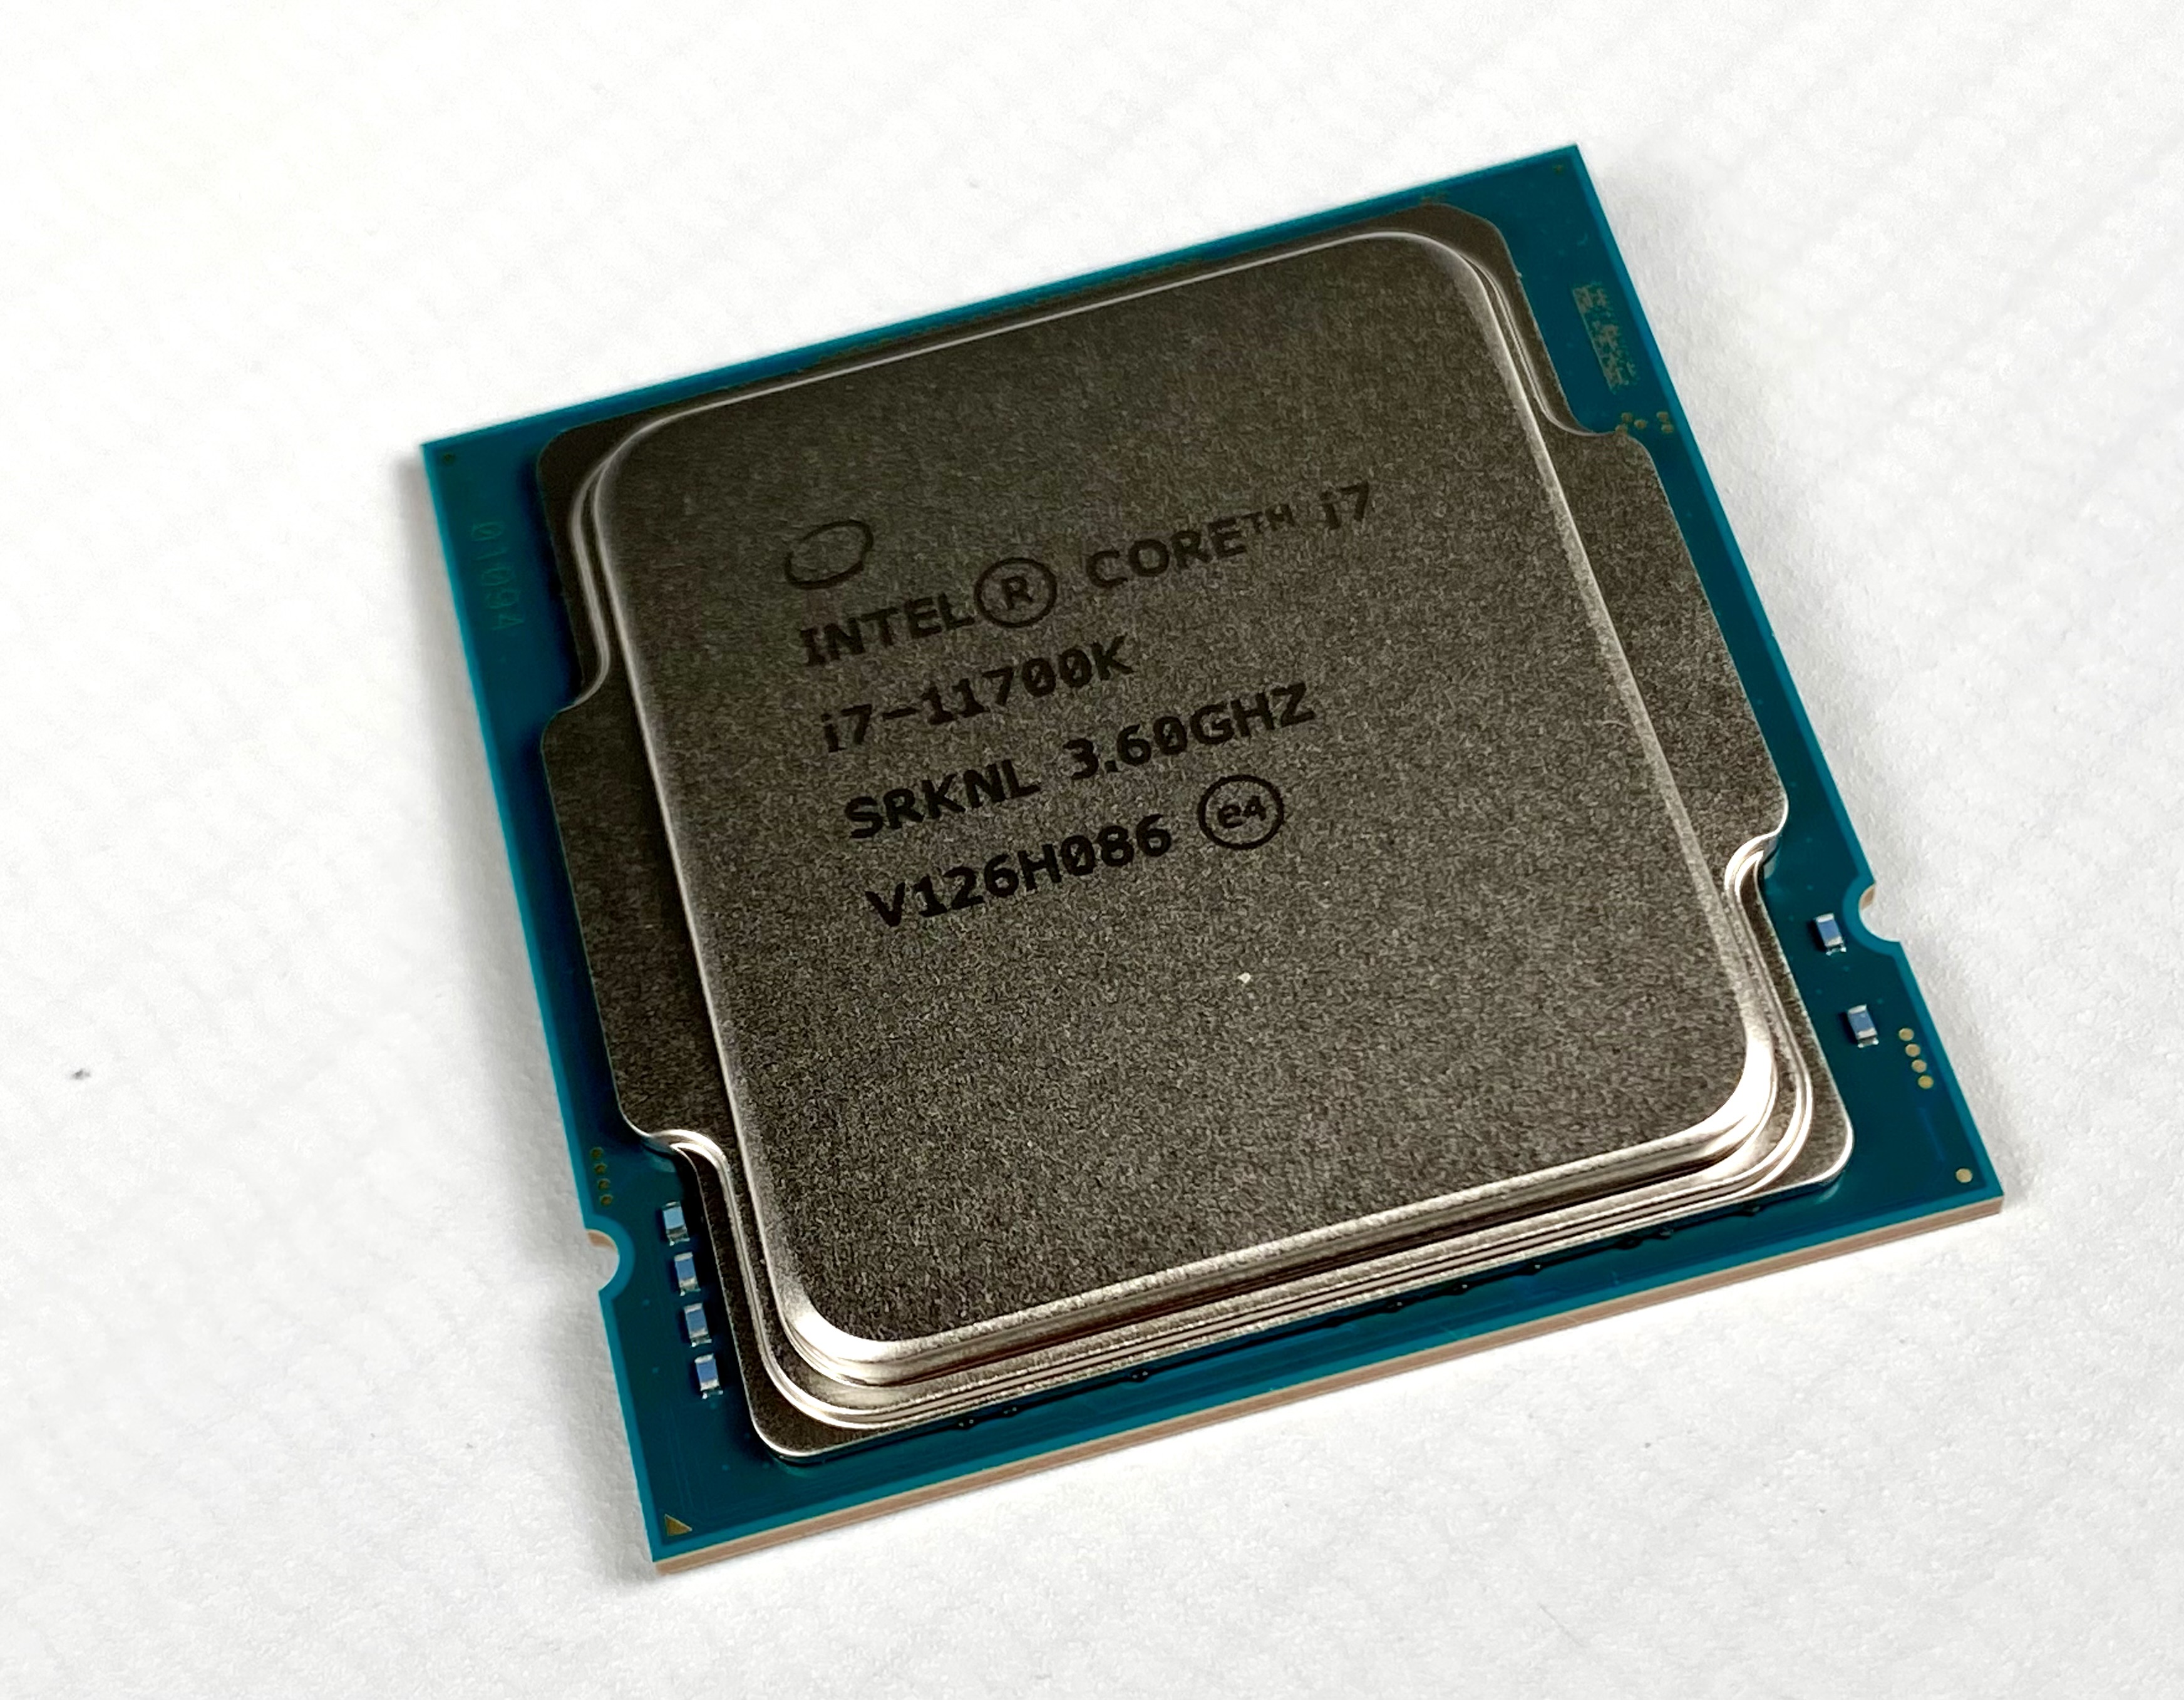
Intel Core i7-11700K ► remove from comparison
The Intel Core i7-11700K is a high-end desktop CPU based on the Rocket Lake architecture. The CPU offers 8 cores and 16 threads clocked at 3.6 - 4.9 GHz. The TDP is rated at 125 Watt (PL1, power limit sustained load) but the PL2 is set to around 250 Watt for short term boosts (up to 56 seconds).
The Sunny Cove processor cores (known from the Ice Lake mobile CPUs) offer larger caches and an improved IPC (up to 19%). Furthermore, the chip also includes (partly) integrated WiFi 6E and Thunderbolt 4. The platform supports PCIe 4.0 and Intel DL Boost for AI acceleration.
The faster Rocket Lake-S CPUs also integrate a new Intel UHD Graphics 750 that is based on the current Intel Xe architecture (e.g. mobile Tiger Lake).
The CPU is manufactured on an old 14 nm process like the Comet Lake predecessors.
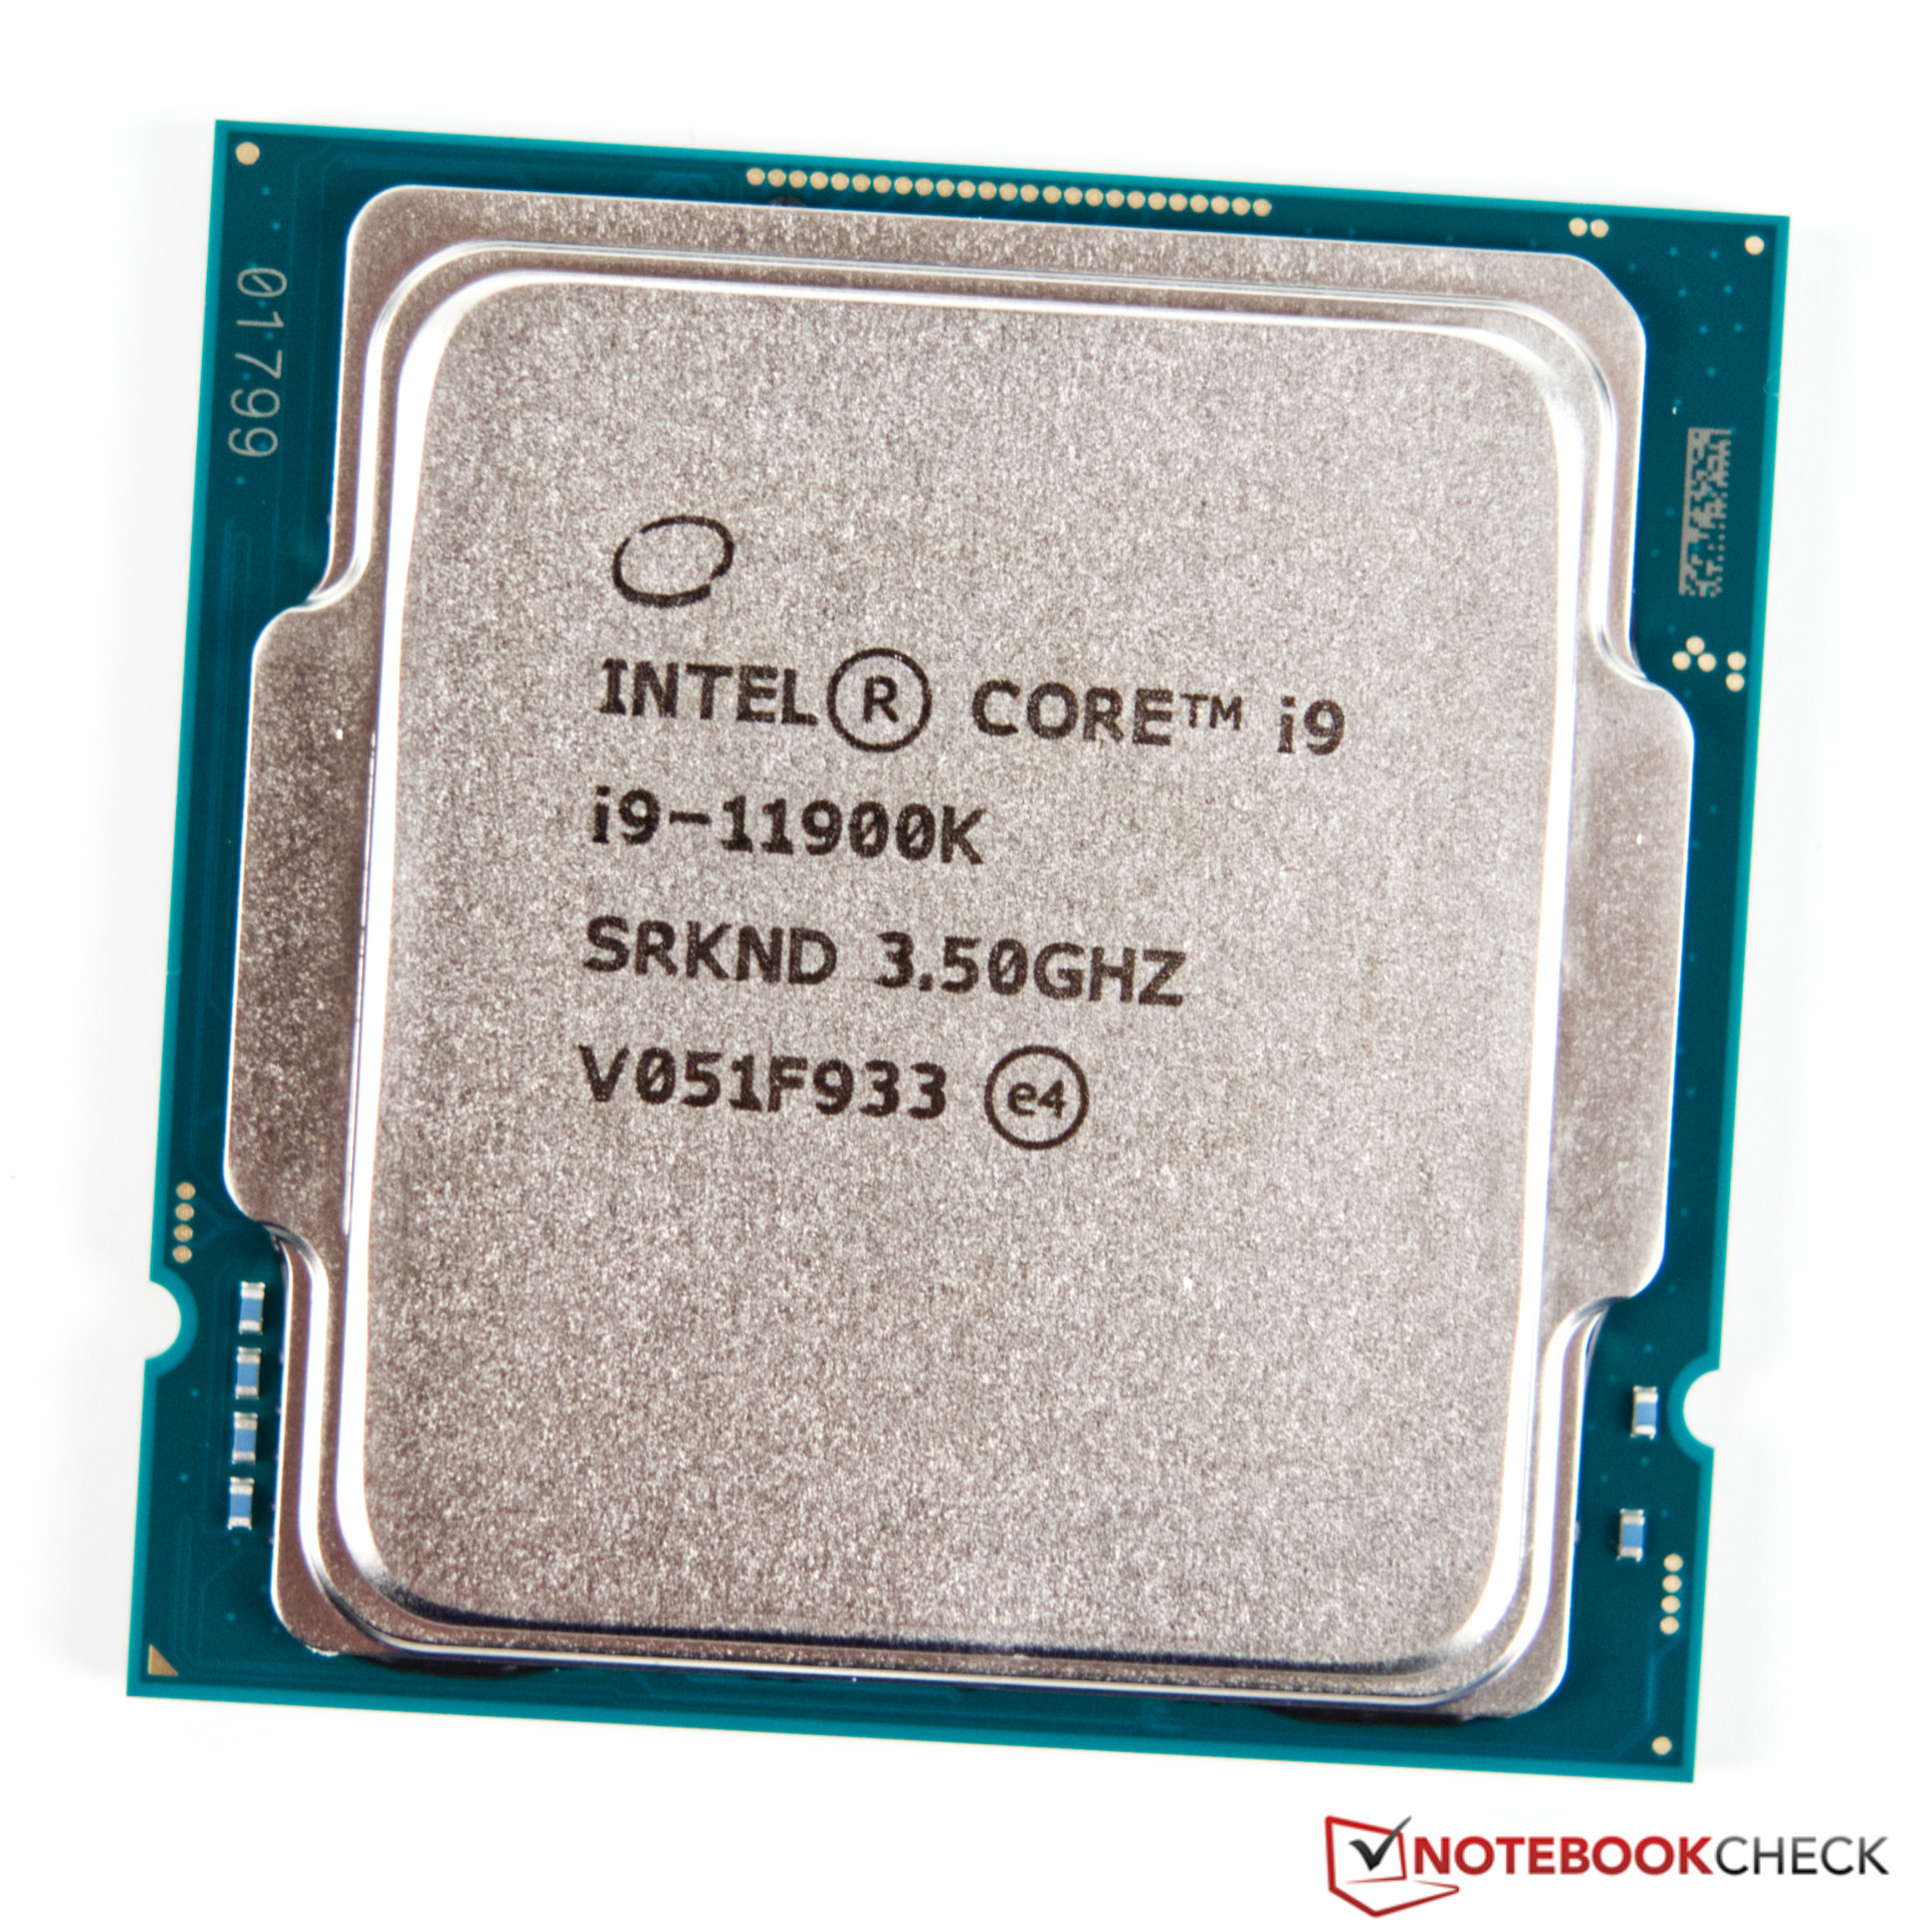
Intel Core i9-11900K ► remove from comparison
The Intel Core i9-11900K is a high-end desktop CPU based on the Rocket Lake architecture. The CPU offers 8 cores and 16 threads clocked at 3.5 - 5.3 GHz (Turbo Boost 3.0 / TVB). With Turbo Boost 2.0, 5.1 GHz can be reached with a single thread. Using all cores, the CPU can clock up to 4.8 GHz. Adaptive Boost enables even higher multi-core frequencies (5.1 GHz all core Turbo) but uses a lot more power.
The TDP is rated at 125 Watt (PL1, power limit sustained load) but the PL2 is set to around 250 Watt for short term boosts (up to 56 seconds).
The Sunny Cove processor cores (known from the Ice Lake mobile CPUs) offer larger caches and an improved IPC (up to 19%). Furthermore, the chip also includes (partly) integrated WiFi 6E and Thunderbolt 4. The platform supports PCIe 4.0 and Intel DL Boost for AI acceleration.
The faster Rocket Lake-S CPUs also integrate a new Intel UHD Graphics 750 that is based on the current Intel Xe architecture (e.g. mobile Tiger Lake) and offers 32 EUs. In the 11900K, the GPU is clocked from 350 - 1300 MHz.
Performance
The average 11900K in our database is in the same league as the Ryzen 7 5800X3D , as far as multi-thread benchmark scores are concerned. Which is an impressive result, as of mid 2022, and good enough for any task imaginable including content creation and professional gaming.
Power consumption
This Core i9 has a 125 W TDP, also known as the long-term power limit. Intel lets PC manufacturers reduce that value somewhat if required, 95 W being the lower limit, which would result in lower clock speeds and lower performance. The reality is, an 11900K can be much more power hungry than either of the two numbers imply simply because of its sheer might but also because it is manufactured on an old 14 nm Intel process that makes for lower-than-average, as of mid-2022, energy efficiency.
Model Intel Processor N100 Intel Core i7-11700K Intel Core i9-11900K Series Intel Alder Lake-N Intel Rocket Lake Intel Rocket Lake Codename Alder Lake-N Rocket Lake Rocket Lake Series: Rocket Lake Rocket Lake Clock 1000 - 3400 MHz 3600 - 5000 MHz 3500 - 5300 MHz L3 Cache 6 MB 16 MB 16 MB Cores / Threads 4 / 4 8 / 16 8 / 16 TDP 6 Watt 125 Watt 125 Watt Technology 10 nm 14 nm 14 nm max. Temp. 105 °C 100 °C 100 °C Socket BGA1264 LGA1200 LGA1200 Features DDR4-3200/DDR5-4800/LPDDR5-4800 RAM (sin. chan.), PCIe 3, GNA, MMX, SSE, SSE2, SSE3, SSSE3, SSE4.1, SSE4.2, AVX, AVX2, BMI2, ABM, FMA, ADX, VMX, SMEP, SMAP, EIST, TM1, TM2, Turbo, SST, AES-NI, RDRAND, RDSEED, SHA DDR4-3200 RAM, PCIe 4, 8 GT/s bus, DL Boost, GNA, vPro, MMX, SSE, SSE2, SSE3, SSSE3, SSE4.1, SSE4.2, AVX, AVX2, AVX-512, BMI2, ABM, FMA, ADX, VMX, SMX, SMEP, SMAP, MPX, EIST, TM1, TM2, HT, Turbo, SST, AES-NI, RDRAND, RDSEED, SHA DDR4-3200 RAM, PCIe 4, 8 GT/s bus, DL Boost, GNA, vPro, MMX, SSE, SSE2, SSE3, SSSE3, SSE4.1, SSE4.2, AES, AVX, AVX2, AVX512F, FMA3, SHA iGPU Intel UHD Graphics 24EUs (Alder Lake-N) ( - 750 MHz)Intel UHD Graphics Xe 750 32EUs (Rocket Lake) (350 - 1300 MHz)Intel UHD Graphics Xe 750 32EUs (Rocket Lake) (350 - 1300 MHz)Architecture x86 x86 x86 $128 U.S. Announced Manufacturer ark.intel.com ark.intel.com ark.intel.com L1 Cache 640 KB 640 KB L2 Cache 4 MB 4 MB
Benchmarks Performance Rating - CB R15 + R20 + 7-Zip + X265 + Blender + 3DM11 CPU - N100
25.2 pt (35%)
...
...
max:
Performance Rating - CB R15 + R20 + 7-Zip + X265 + Blender + 3DM11 CPU - i7-11700K
41.2 pt (57%)
...
...
max:
Performance Rating - CB R15 + R20 + 7-Zip + X265 + Blender + 3DM11 CPU - i9-11900K
42.7 pt (59%)
...
...
max:
Cinebench 2024 - Cinebench 2024 CPU Single Core
min: 60 avg: 60.5 median: 60.5 (42%) max: 61 Points
CPU TDP 15 W TDP 20 W 98% 100%
98 Points (68%)
CPU TDP ? TDP 15 W TDP 20 W 100% 61% 62%
Cinebench 2024 - Cinebench 2024 CPU Multi Core
min: 194 avg: 195 median: 195 (4%) max: 196 Points
CPU TDP 15 W TDP 20 W 100% 99%
698 Points (13%)
CPU TDP ? TDP 15 W TDP 20 W 100% 28% 28%
Cinebench R23 - Cinebench R23 Multi Core
min: 1577 avg: 2378 median: 2203 (2%) max: 2983 Points
CPU TDP ? TDP 7 W TDP 9 W TDP 10 W TDP 15 W TDP 20 W 53% 68% 74% 65% 100% 99%
14281 Points (13%)
CPU TDP ? TDP 7 W TDP 9 W TDP 10 W TDP 15 W TDP 20 W 100% 26% 28% 25% 38% 37%
min: 13825 avg: 14669 median: 14747 (14%) max: 15519 Points
CPU TDP ? TDP 7 W TDP 9 W TDP 10 W TDP 15 W TDP 20 W TDP 125 W TDP 130 W 72% 13% 14% 13% 19% 19% 100% 92%
Cinebench R23 - Cinebench R23 Single Core
min: 747 avg: 881 median: 907 (39%) max: 942 Points
CPU TDP ? TDP 7 W TDP 9 W TDP 10 W TDP 15 W TDP 20 W 80% 93% 97% 90% 99% 100%
1558 Points (66%)
CPU TDP ? TDP 7 W TDP 9 W TDP 10 W TDP 15 W TDP 20 W 100% 75% 79% 73% 81% 81%
min: 1604 avg: 1640 median: 1636 (70%) max: 1693 Points
CPU TDP ? TDP 7 W TDP 9 W TDP 10 W TDP 15 W TDP 20 W TDP 125 W TDP 130 W 83% 52% 54% 51% 56% 56% 100% 97%
Cinebench R20 - Cinebench R20 CPU (Single Core)
min: 285 avg: 336.6 median: 346 (38%) max: 358 Points
CPU TDP ? TDP 7 W TDP 9 W TDP 10 W TDP 15 W TDP 20 W 80% 93% 97% 91% 99% 100%
min: 580 avg: 588 median: 588 (65%) max: 596 Points
CPU TDP ? TDP 7 W TDP 9 W TDP 10 W TDP 15 W TDP 20 W 100% 68% 71% 67% 72% 73%
min: 619 avg: 633 median: 633 (70%) max: 647 Points
CPU TDP ? TDP 7 W TDP 9 W TDP 10 W TDP 15 W TDP 20 W TDP 125 W TDP 130 W 81% 52% 54% 51% 55% 56% 100% 99%
Cinebench R20 - Cinebench R20 CPU (Multi Core)
min: 590 avg: 907 median: 842 (2%) max: 1139 Points
CPU TDP ? TDP 7 W TDP 9 W TDP 10 W TDP 15 W TDP 20 W 52% 68% 74% 66% 100% 99%
min: 5082 avg: 5361 median: 5361 (13%) max: 5640 Points
CPU TDP ? TDP 7 W TDP 9 W TDP 10 W TDP 15 W TDP 20 W 100% 21% 22% 20% 30% 30%
min: 5055 avg: 5499 median: 5306 (13%) max: 5997 Points
CPU TDP ? TDP 7 W TDP 9 W TDP 10 W TDP 15 W TDP 20 W TDP 125 W TDP 130 W 74% 13% 14% 13% 19% 19% 100% 85%
Cinebench R15 - Cinebench R15 CPU Multi 64 Bit
min: 246 avg: 371.3 median: 336 (2%) max: 479 Points
CPU TDP ? TDP 7 W TDP 9 W TDP 10 W TDP 15 W TDP 20 W 51% 62% 70% 62% 100% 99%
min: 2265 avg: 2299 median: 2299 (15%) max: 2333 Points
CPU TDP ? TDP 7 W TDP 9 W TDP 10 W TDP 15 W TDP 20 W 100% 18% 21% 18% 30% 29%
min: 2238 avg: 2358 median: 2379 (15%) max: 2436 Points
CPU TDP ? TDP 7 W TDP 9 W TDP 10 W TDP 15 W TDP 20 W TDP 125 W TDP 130 W 73% 12% 14% 12% 20% 20% 100% 98%
Cinebench R15 - Cinebench R15 CPU Single 64 Bit
min: 118.8 avg: 143 median: 146 (44%) max: 155 Points
CPU TDP ? TDP 7 W TDP 9 W TDP 10 W TDP 15 W TDP 20 W 77% 89% 95% 89% 98% 100%
240 Points (72%)
CPU TDP ? TDP 7 W TDP 9 W TDP 10 W TDP 15 W TDP 20 W 100% 69% 73% 69% 76% 77%
min: 254 avg: 256.5 median: 255 (77%) max: 262 Points
CPU TDP ? TDP 7 W TDP 9 W TDP 10 W TDP 15 W TDP 20 W TDP 125 W TDP 130 W 82% 53% 56% 53% 59% 60% 100% 98%
Cinebench R11.5 - Cinebench R11.5 CPU Multi 64 Bit
min: 3.84 avg: 4.6 median: 4.2 (6%) max: 5.99 Points
CPU TDP 7 W TDP 9 W TDP 10 W TDP 15 W TDP 20 W 65% 71% 64% 86% 100%
25.6 Points (33%)
CPU TDP ? TDP 7 W TDP 9 W TDP 10 W TDP 15 W TDP 20 W 100% 15% 17% 15% 20% 23%
26.8 Points (35%)
CPU TDP ? TDP 7 W TDP 9 W TDP 10 W TDP 15 W TDP 20 W TDP 125 W 95% 15% 16% 14% 19% 22% 100%
Cinebench R11.5 - Cinebench R11.5 CPU Single 64 Bit
min: 1.55 avg: 1.7 median: 1.8 (44%) max: 1.87 Points
CPU TDP 7 W TDP 9 W TDP 10 W TDP 15 W TDP 20 W 83% 94% 89% 98% 100%
2.9 Points (71%)
CPU TDP ? TDP 7 W TDP 9 W TDP 10 W TDP 15 W TDP 20 W 100% 54% 61% 58% 64% 65%
3.1 Points (77%)
CPU TDP ? TDP 7 W TDP 9 W TDP 10 W TDP 15 W TDP 20 W TDP 125 W 93% 50% 57% 54% 59% 60% 100%
Cinebench R10 - Cinebench R10 Rend. Single (32bit)
min: 4604 avg: 4896 median: 4869 (29%) max: 5179 Points
CPU TDP 7 W TDP 9 W TDP 10 W TDP 15 W TDP 20 W 89% 98% 92% 100% 94%
9621 Points (58%)
CPU TDP ? TDP 7 W TDP 9 W TDP 10 W TDP 15 W TDP 20 W 100% 48% 53% 50% 54% 51%
10545 Points (64%)
CPU TDP ? TDP 7 W TDP 9 W TDP 10 W TDP 15 W TDP 20 W TDP 125 W 91% 44% 48% 45% 49% 46% 100%
Cinebench R10 - Cinebench R10 Rend. Multi (32bit)
min: 9608 avg: 12281 median: 11207 (8%) max: 15336 Points
CPU TDP 7 W TDP 9 W TDP 10 W TDP 15 W TDP 20 W 63% 73% 66% 99% 100%
58342 Points (42%)
CPU TDP ? TDP 7 W TDP 9 W TDP 10 W TDP 15 W TDP 20 W 100% 16% 19% 17% 26% 26%
62024 Points (45%)
CPU TDP ? TDP 7 W TDP 9 W TDP 10 W TDP 15 W TDP 20 W TDP 125 W 94% 15% 18% 16% 25% 25% 100%
Cinebench R10 - Cinebench R10 Rend. Multi (64bit)
min: 14514 avg: 18829 median: 16948 (12%) max: 24225 Points
CPU TDP 7 W TDP 9 W TDP 10 W TDP 15 W TDP 20 W 60% 70% 60% 99% 100%
80613 Points (56%)
CPU TDP 7 W TDP 9 W TDP 10 W TDP 15 W TDP 20 W TDP 125 W 18% 21% 18% 30% 30% 100%
Cinebench R10 - Cinebench R10 Rend. Single (64bit)
min: 7171 avg: 7699 median: 7750 (9%) max: 8227 Points
CPU TDP 7 W TDP 9 W TDP 10 W TDP 15 W TDP 20 W 87% 94% 88% 98% 100%
14149 Points (17%)
CPU TDP 7 W TDP 9 W TDP 10 W TDP 15 W TDP 20 W TDP 125 W 51% 55% 51% 57% 58% 100%
wPrime 2.10 - wPrime 2.0 1024m *
min: 481.652 avg: 569 median: 588.3 (7%) max: 645.884 s
CPU TDP 7 W TDP 9 W TDP 10 W TDP 15 W TDP 20 W 100% 101% 100% 102% 102%
77.9 s (1%)
CPU TDP 7 W TDP 9 W TDP 10 W TDP 15 W TDP 20 W TDP 125 W 100% 101% 100% 102% 102% 107%
wPrime 2.10 - wPrime 2.0 32m *
min: 15.795 avg: 16.5 median: 16.2 (3%) max: 17.7 s
CPU TDP 7 W TDP 9 W TDP 10 W TDP 15 W TDP 20 W 100% 100% 100% 100% 100%
4.8 s (1%)
CPU TDP ? TDP 7 W TDP 9 W TDP 10 W TDP 15 W TDP 20 W 103% 100% 100% 100% 100% 100%
4 s (1%)
CPU TDP ? TDP 7 W TDP 9 W TDP 10 W TDP 15 W TDP 20 W TDP 125 W 103% 100% 100% 100% 100% 100% 103%
min: 2187 avg: 2343 median: 2372 (4%) max: 2501 Points
CPU TDP 7 W TDP 9 W TDP 10 W TDP 15 W TDP 20 W 87% 100% 89% 95% 97%
9030 Points (14%)
CPU TDP 7 W TDP 9 W TDP 10 W TDP 15 W TDP 20 W TDP 125 W 24% 28% 25% 26% 27% 100%
7-Zip 18.03 - 7-Zip 18.03 Multli Thread 4 runs
min: 7532 avg: 10800 median: 10350 (6%) max: 13291 MIPS
CPU TDP ? TDP 7 W TDP 9 W TDP 10 W TDP 15 W TDP 20 W 57% 70% 78% 66% 99% 100%
57129 MIPS (33%)
CPU TDP ? TDP 7 W TDP 9 W TDP 10 W TDP 15 W TDP 20 W 100% 29% 32% 27% 41% 41%
min: 54125 avg: 59047 median: 59658.5 (34%) max: 62746 MIPS
CPU TDP ? TDP 7 W TDP 9 W TDP 10 W TDP 15 W TDP 20 W TDP 125 W TDP 130 W 64% 15% 17% 14% 21% 21% 100% 93%
7-Zip 18.03 - 7-Zip 18.03 Single Thread 4 runs
min: 3046 avg: 3623 median: 3635 (43%) max: 3958 MIPS
CPU TDP ? TDP 7 W TDP 9 W TDP 10 W TDP 15 W TDP 20 W 77% 88% 96% 91% 92% 100%
6157 MIPS (74%)
CPU TDP ? TDP 7 W TDP 9 W TDP 10 W TDP 15 W TDP 20 W 100% 75% 82% 78% 79% 85%
min: 6174 avg: 6380 median: 6347 (76%) max: 6652 MIPS
CPU TDP ? TDP 7 W TDP 9 W TDP 10 W TDP 15 W TDP 20 W TDP 125 W TDP 130 W 80% 53% 58% 55% 56% 61% 100% 95%
X264 HD Benchmark 4.0 - x264 Pass 2
min: 20.85 avg: 27.1 median: 24.1 (8%) max: 34.7 fps
CPU TDP 7 W TDP 9 W TDP 10 W TDP 15 W TDP 20 W 63% 69% 60% 100% 98%
128 fps (45%)
CPU TDP ? TDP 7 W TDP 9 W TDP 10 W TDP 15 W TDP 20 W 100% 17% 19% 16% 27% 26%
137 fps (48%)
CPU TDP ? TDP 7 W TDP 9 W TDP 10 W TDP 15 W TDP 20 W TDP 125 W 93% 16% 18% 15% 25% 25% 100%
X264 HD Benchmark 4.0 - x264 Pass 1
min: 101.8 avg: 134.8 median: 121.2 (28%) max: 173 fps
CPU TDP 7 W TDP 9 W TDP 10 W TDP 15 W TDP 20 W 61% 70% 59% 100% 100%
292.5 fps (67%)
CPU TDP ? TDP 7 W TDP 9 W TDP 10 W TDP 15 W TDP 20 W 100% 36% 41% 35% 59% 59%
309.5 fps (71%)
CPU TDP ? TDP 7 W TDP 9 W TDP 10 W TDP 15 W TDP 20 W TDP 125 W 95% 34% 39% 33% 56% 56% 100%
HWBOT x265 Benchmark v2.2 - HWBOT x265 4k Preset
min: 1.72 avg: 2.7 median: 2.5 (4%) max: 3.49 fps
CPU TDP ? TDP 7 W TDP 9 W TDP 10 W TDP 15 W TDP 20 W 50% 57% 72% 61% 100% 99%
16.3 fps (29%)
CPU TDP ? TDP 7 W TDP 9 W TDP 10 W TDP 15 W TDP 20 W 100% 22% 28% 24% 39% 38%
min: 16.6 avg: 18.2 median: 18.2 (32%) max: 19.8 fps
CPU TDP ? TDP 7 W TDP 9 W TDP 10 W TDP 15 W TDP 20 W TDP 125 W TDP 130 W 59% 10% 13% 11% 18% 18% 100% 87%
TrueCrypt - TrueCrypt Serpent
min: 0.257 avg: 0.3 median: 0.3 (0%) max: 0.263 GB/s
CPU TDP 7 W TDP 9 W TDP 10 W TDP 15 W TDP 20 W 98% 100% 98% 99% 100%
1.2 GB/s (0%)
CPU TDP ? TDP 7 W TDP 9 W TDP 10 W TDP 15 W TDP 20 W 100% 21% 22% 21% 22% 22%
1.2 GB/s (0%)
CPU TDP ? TDP 7 W TDP 9 W TDP 10 W TDP 15 W TDP 20 W TDP 125 W 100% 21% 22% 21% 22% 22% 100%
TrueCrypt - TrueCrypt Twofish
min: 0.529 avg: 0.5 median: 0.5 (9%) max: 0.538 GB/s
CPU TDP 7 W TDP 9 W TDP 10 W TDP 15 W TDP 20 W 99% 100% 98% 99% 100%
1.9 GB/s (33%)
CPU TDP ? TDP 7 W TDP 9 W TDP 10 W TDP 15 W TDP 20 W 100% 28% 28% 28% 28% 28%
1.9 GB/s (33%)
CPU TDP ? TDP 7 W TDP 9 W TDP 10 W TDP 15 W TDP 20 W TDP 125 W 100% 28% 28% 28% 28% 28% 100%
TrueCrypt - TrueCrypt AES
min: 2.8 avg: 2.9 median: 2.9 (8%) max: 2.9 GB/s
CPU TDP 7 W TDP 9 W TDP 10 W TDP 15 W TDP 20 W 97% 100% 100% 100% 100%
12.7 GB/s (33%)
CPU TDP ? TDP 7 W TDP 9 W TDP 10 W TDP 15 W TDP 20 W 100% 22% 23% 23% 23% 23%
13 GB/s (34%)
CPU TDP ? TDP 7 W TDP 9 W TDP 10 W TDP 15 W TDP 20 W TDP 125 W 98% 22% 22% 22% 22% 22% 100%
Blender - Blender 3.3 Classroom CPU *
min: 1992 avg: 2624 median: 2373 (30%) max: 3964 Seconds
CPU TDP ? TDP 9 W TDP 10 W TDP 15 W TDP 20 W 100% 133% 124% 150% 150%
428 Seconds (5%)
CPU TDP ? TDP 9 W TDP 10 W TDP 15 W TDP 20 W 117% 107% 100% 120% 121%
Blender - Blender 2.79 BMW27 CPU *
min: 1017 avg: 1360 median: 1346 (9%) max: 1956 Seconds
CPU TDP ? TDP 7 W TDP 9 W TDP 10 W TDP 15 W TDP 20 W 100% 103% 105% 104% 107% 108%
221 Seconds (2%)
CPU TDP ? TDP 7 W TDP 9 W TDP 10 W TDP 15 W TDP 20 W 104% 100% 102% 101% 104% 104%
min: 190.3 avg: 210.8 median: 211.9 (1%) max: 229 Seconds
CPU TDP ? TDP 7 W TDP 9 W TDP 10 W TDP 15 W TDP 20 W TDP 125 W TDP 130 W 106% 100% 102% 101% 104% 104% 111% 111%
R Benchmark 2.5 - R Benchmark 2.5 *
min: 0.822 avg: 0.9 median: 0.9 (19%) max: 1.06 sec
CPU TDP ? TDP 7 W TDP 9 W TDP 10 W TDP 15 W TDP 20 W 100% 101% 105% 102% 106% 107%
0.5 sec (11%)
CPU TDP ? TDP 7 W TDP 9 W TDP 10 W TDP 15 W TDP 20 W 107% 100% 104% 102% 106% 106%
min: 0.4733 avg: 0.5 median: 0.5 (11%) max: 0.4981 sec
CPU TDP ? TDP 7 W TDP 9 W TDP 10 W TDP 15 W TDP 20 W TDP 125 W TDP 130 W 110% 100% 104% 102% 106% 106% 116% 115%
3DMark 06 - CPU - 3DMark 06 - CPU
min: 4091 avg: 5232 median: 4838 (10%) max: 6441 Points
CPU TDP 7 W TDP 9 W TDP 10 W TDP 15 W TDP 20 W 64% 75% 68% 100% 100%
16388 Points (35%)
CPU TDP ? TDP 7 W TDP 9 W TDP 10 W TDP 15 W TDP 20 W 100% 25% 30% 27% 39% 39%
Super Pi mod 1.5 XS 1M - Super Pi mod 1.5 XS 1M *
min: 19.264 avg: 19.4 median: 19.4 (4%) max: 19.531 s
CPU TDP 7 W TDP 9 W TDP 10 W TDP 15 W TDP 20 W 100% 100% 100% 100% 100%
20.2 s (4%)
CPU TDP ? TDP 7 W TDP 9 W TDP 10 W TDP 15 W TDP 20 W 100% 100% 100% 100% 100% 100%
6.3 s (1%)
CPU TDP ? TDP 7 W TDP 9 W TDP 10 W TDP 15 W TDP 20 W TDP 125 W 100% 100% 100% 100% 100% 100% 103%
Super Pi mod 1.5 XS 2M - Super Pi mod 1.5 XS 2M *
min: 40.302 avg: 40.5 median: 40.4 (2%) max: 40.679 s
CPU TDP 7 W TDP 9 W TDP 10 W TDP 15 W TDP 20 W 100% 100% 100% 100% 100%
13.7 s (1%)
CPU TDP 7 W TDP 9 W TDP 10 W TDP 15 W TDP 20 W TDP 125 W 100% 100% 100% 100% 100% 101%
Super Pi Mod 1.5 XS 32M - Super Pi mod 1.5 XS 32M *
min: 816.966 avg: 836 median: 818.8 (4%) max: 863.891 s
CPU TDP 7 W TDP 9 W TDP 10 W TDP 15 W TDP 20 W 100% 100% 100% 100% 100%
685 s (3%)
CPU TDP ? TDP 7 W TDP 9 W TDP 10 W TDP 15 W TDP 20 W 101% 100% 100% 100% 100% 100%
331.4 s (1%)
CPU TDP ? TDP 7 W TDP 9 W TDP 10 W TDP 15 W TDP 20 W TDP 125 W 101% 100% 100% 100% 100% 100% 102%
3DMark Vantage - 3DM Vant. Perf. CPU no Physx
min: 9434 avg: 12661 median: 11998 (11%) max: 15625 Points
CPU TDP 7 W TDP 9 W TDP 10 W TDP 15 W TDP 20 W 60% 77% 69% 100% 99%
3DMark 11 - 3DM11 Performance Physics
min: 3723 avg: 5202 median: 5818 (16%) max: 6486 Points
CPU TDP ? TDP 7 W TDP 9 W TDP 10 W TDP 15 W TDP 20 W 92% 60% 69% 59% 96% 100%
17324 Points (47%)
CPU TDP ? TDP 7 W TDP 9 W TDP 10 W TDP 15 W TDP 20 W 100% 33% 38% 32% 52% 55%
min: 20149 avg: 20662 median: 20662 (56%) max: 21175 Points
CPU TDP ? TDP 7 W TDP 9 W TDP 10 W TDP 15 W TDP 20 W TDP 125 W TDP 130 W 55% 18% 21% 18% 29% 30% 100% 95%
3DMark - 3DMark Ice Storm Physics
min: 34828 avg: 42619 median: 41217 (33%) max: 51063 Points
CPU TDP 7 W TDP 9 W TDP 10 W TDP 15 W TDP 20 W 68% 81% 71% 97% 100%
70388 Points (57%)
CPU TDP ? TDP 7 W TDP 9 W TDP 10 W TDP 15 W TDP 20 W 100% 49% 59% 52% 70% 73%
min: 74965 avg: 79326 median: 79325.5 (64%) max: 83686 Points
CPU TDP ? TDP 7 W TDP 9 W TDP 10 W TDP 15 W TDP 20 W TDP 125 W 89% 44% 52% 46% 63% 64% 100%
3DMark - 3DMark Ice Storm Extreme Physics
min: 34083 avg: 42751 median: 41809 (34%) max: 51420 Points
CPU TDP 7 W TDP 9 W TDP 10 W TDP 15 W TDP 20 W 66% 81% 72% 96% 100%
75316 Points (61%)
CPU TDP 7 W TDP 9 W TDP 10 W TDP 15 W TDP 20 W TDP 125 W 45% 56% 49% 66% 68% 100%
3DMark - 3DMark Ice Storm Unlimited Physics
min: 50867 avg: 52297 median: 52338 (44%) max: 53373 Points
CPU TDP 7 W TDP 9 W TDP 10 W TDP 15 W TDP 20 W 95% 99% 98% 98% 100%
85348 Points (72%)
CPU TDP 7 W TDP 9 W TDP 10 W TDP 15 W TDP 20 W TDP 130 W 60% 62% 61% 61% 63% 100%
3DMark - 3DMark Cloud Gate Physics
min: 3133 avg: 3873 median: 3565 (9%) max: 4693 Points
CPU TDP ? TDP 7 W TDP 9 W TDP 10 W TDP 15 W TDP 20 W 67% 68% 76% 70% 97% 100%
18593 Points (47%)
CPU TDP ? TDP 7 W TDP 9 W TDP 10 W TDP 15 W TDP 20 W 100% 29% 33% 30% 42% 43%
min: 18242 avg: 19567 median: 20094 (51%) max: 20364 Points
CPU TDP ? TDP 7 W TDP 9 W TDP 10 W TDP 15 W TDP 20 W TDP 125 W TDP 130 W 54% 16% 18% 16% 23% 23% 96% 100%
3DMark - 3DMark Fire Strike Standard Physics
min: 4589 avg: 5712 median: 5889 (10%) max: 6602 Points
CPU TDP 7 W TDP 9 W TDP 10 W TDP 15 W TDP 20 W 70% 80% 73% 99% 100%
25557 Points (46%)
CPU TDP ? TDP 7 W TDP 9 W TDP 10 W TDP 15 W TDP 20 W 100% 18% 21% 19% 26% 26%
min: 26699 avg: 27967 median: 28121 (50%) max: 28927 Points
CPU TDP ? TDP 7 W TDP 9 W TDP 10 W TDP 15 W TDP 20 W TDP 125 W TDP 130 W 91% 16% 19% 17% 23% 23% 99% 100%
3DMark - 3DMark Time Spy CPU
min: 1407 avg: 1925 median: 1610 (7%) max: 2516 Points
CPU TDP ? TDP 7 W TDP 9 W TDP 10 W TDP 15 W TDP 20 W 58% 56% 64% 59% 100% 100%
min: 11012 avg: 12563 median: 12902.5 (54%) max: 13433 Points
CPU TDP ? TDP 7 W TDP 9 W TDP 10 W TDP 15 W TDP 20 W TDP 125 W TDP 130 W 47% 11% 12% 11% 19% 19% 100% 95%
Geekbench 6.2 - Geekbench 6.2 Single-Core
min: 1070 avg: 1192 median: 1227 (33%) max: 1245 Points
CPU TDP ? TDP 7 W TDP 9 W TDP 10 W TDP 15 W TDP 20 W 91% 86% 99% 98% 99% 100%
Geekbench 6.2 - Geekbench 6.2 Multi-Core
min: 2283 avg: 2892 median: 3133 (12%) max: 3282 Points
CPU TDP ? TDP 7 W TDP 9 W TDP 10 W TDP 15 W TDP 20 W 70% 72% 95% 85% 100% 98%
Geekbench 5.5 - Geekbench 5.1 - 5.4 64 Bit Single-Core
min: 915 avg: 981 median: 991 (42%) max: 1018 Points
CPU TDP ? TDP 7 W TDP 9 W TDP 10 W TDP 15 W TDP 20 W 94% 93% 98% 96% 98% 100%
min: 1721 avg: 1766 median: 1765.5 (74%) max: 1810 Points
CPU TDP ? TDP 7 W TDP 9 W TDP 10 W TDP 15 W TDP 20 W 100% 70% 73% 72% 73% 75%
min: 1748 avg: 1796 median: 1787.5 (75%) max: 1885 Points
CPU TDP ? TDP 7 W TDP 9 W TDP 10 W TDP 15 W TDP 20 W TDP 125 W TDP 130 W 84% 52% 54% 53% 54% 55% 100% 97%
Geekbench 5.5 - Geekbench 5.1 - 5.4 64 Bit Multi-Core
min: 1911 avg: 2567 median: 2812.5 (5%) max: 2896 Points
CPU TDP ? TDP 7 W TDP 9 W TDP 10 W TDP 15 W TDP 20 W 82% 70% 98% 81% 100% 98%
min: 10269 avg: 10787 median: 10786.5 (19%) max: 11304 Points
CPU TDP ? TDP 7 W TDP 9 W TDP 10 W TDP 15 W TDP 20 W 100% 31% 43% 35% 44% 43%
min: 9547 avg: 10328 median: 10483 (19%) max: 11035 Points
CPU TDP ? TDP 7 W TDP 9 W TDP 10 W TDP 15 W TDP 20 W TDP 125 W TDP 130 W 74% 19% 26% 21% 27% 26% 100% 96%
Geekbench 5.0 - Geekbench 5.0 64 Bit Single-Core
min: 968 avg: 990 median: 993 (4%) max: 1008 Points
CPU TDP 7 W TDP 9 W TDP 10 W TDP 15 W TDP 20 W 97% 99% 96% 99% 100%
1863 Points (8%)
CPU TDP 7 W TDP 9 W TDP 10 W TDP 15 W TDP 20 W TDP 125 W 53% 54% 52% 53% 54% 100%
Geekbench 5.0 - Geekbench 5.0 64 Bit Multi-Core
min: 2278 avg: 2624 median: 2753 (9%) max: 2862 Points
CPU TDP 7 W TDP 9 W TDP 10 W TDP 15 W TDP 20 W 85% 98% 80% 100% 96%
11008 Points (35%)
CPU TDP 7 W TDP 9 W TDP 10 W TDP 15 W TDP 20 W TDP 125 W 22% 25% 21% 26% 25% 100%
Geekbench 4.4 - Geekbench 4.1 - 4.4 64 Bit Single-Core
min: 4278 avg: 4440 median: 4467 (45%) max: 4549 Points
CPU TDP 7 W TDP 9 W TDP 10 W TDP 15 W TDP 20 W 97% 100% 94% 98% 99%
7976 Points (80%)
CPU TDP 7 W TDP 9 W TDP 10 W TDP 15 W TDP 20 W TDP 125 W 55% 57% 54% 56% 57% 100%
Geekbench 4.4 - Geekbench 4.1 - 4.4 64 Bit Multi-Core
min: 10361 avg: 11002 median: 11197 (12%) max: 11264 Points
CPU TDP 7 W TDP 9 W TDP 10 W TDP 15 W TDP 20 W 99% 100% 92% 100% 97%
42329 Points (46%)
CPU TDP 7 W TDP 9 W TDP 10 W TDP 15 W TDP 20 W TDP 125 W 26% 27% 24% 27% 26% 100%
Mozilla Kraken 1.1 - Kraken 1.1 Total Score *
min: 1004 avg: 1053 median: 1024 (1%) max: 1122 ms
CPU TDP ? TDP 7 W TDP 9 W TDP 10 W TDP 15 W TDP 20 W 100% 100% 100% 100% 100% 100%
603 ms (1%)
CPU TDP ? TDP 7 W TDP 9 W TDP 10 W TDP 15 W TDP 20 W 100% 100% 100% 100% 100% 100%
min: 544 avg: 566 median: 569.5 (1%) max: 581 ms
CPU TDP ? TDP 7 W TDP 9 W TDP 10 W TDP 15 W TDP 20 W TDP 125 W TDP 130 W 100% 100% 100% 100% 100% 100% 101% 101%
Sunspider - Sunspider 1.0 Total Score *
124.2 ms (1%)
Octane V2 - Octane V2 Total Score
71212 Points (63%)
WebXPRT 4 - WebXPRT 4 Score
min: 128.3 avg: 133.3 median: 133.3 (38%) max: 138.3 Points
CPU TDP ? TDP 9 W TDP 10 W TDP 20 W 93% 100% 94% 98%
min: 244 avg: 247 median: 247 (71%) max: 250 Points
CPU TDP ? TDP 9 W TDP 10 W TDP 20 W 100% 67% 63% 66%
WebXPRT 3 - WebXPRT 3 Score
min: 156.3 avg: 170.3 median: 170.4 (36%) max: 187.4 Points
CPU TDP ? TDP 7 W TDP 9 W TDP 10 W TDP 15 W TDP 20 W 86% 86% 94% 90% 100% 100%
254 Points (53%)
CPU TDP ? TDP 7 W TDP 9 W TDP 10 W TDP 15 W TDP 20 W 100% 77% 83% 80% 88% 89%
min: 217 avg: 268.5 median: 283.5 (59%) max: 290 Points
CPU TDP ? TDP 7 W TDP 9 W TDP 10 W TDP 15 W TDP 20 W TDP 125 W TDP 130 W 80% 54% 59% 56% 63% 63% 87% 100%
CrossMark - CrossMark Overall
min: 706 avg: 774 median: 785 (30%) max: 839 Points
CPU TDP 7 W TDP 9 W TDP 10 W TDP 15 W TDP 20 W 99% 100% 89% 99% 99%
1775 Points (68%)
CPU TDP ? TDP 7 W TDP 9 W TDP 10 W TDP 15 W TDP 20 W 100% 44% 45% 40% 44% 44%
Power Consumption - Prime95 Power Consumption - external Monitor *
min: 12.2 avg: 20.3 median: 16.5 (3%) max: 29.1 Watt
CPU TDP ? TDP 7 W TDP 9 W TDP 10 W TDP 15 W TDP 20 W 103% 103% 102% 102% 100% 100%
210 Watt (36%)
CPU TDP ? TDP 7 W TDP 9 W TDP 10 W TDP 15 W TDP 20 W 100% 121% 121% 120% 118% 118%
min: 197 avg: 235.6 median: 221.5 (38%) max: 302.2 Watt
CPU TDP ? TDP 7 W TDP 9 W TDP 10 W TDP 15 W TDP 20 W TDP 125 W TDP 130 W 152% 204% 203% 203% 198% 199% 100% 124%
Power Consumption - Cinebench R15 Multi Power Consumption - external Monitor *
min: 12.4 avg: 20 median: 20.5 (4%) max: 26.1 Watt
CPU TDP 7 W TDP 9 W TDP 10 W TDP 15 W TDP 20 W 102% 102% 102% 100% 100%
244 Watt (45%)
CPU TDP ? TDP 7 W TDP 9 W TDP 10 W TDP 15 W TDP 20 W 100% 176% 175% 175% 172% 172%
min: 243 avg: 274.3 median: 259.2 (47%) max: 336 Watt
CPU TDP ? TDP 7 W TDP 9 W TDP 10 W TDP 15 W TDP 20 W TDP 125 W TDP 130 W 141% 253% 251% 251% 247% 247% 136% 100%
Power Consumption - Idle Power Consumption - external Monitor *
min: 2.84 avg: 7.5 median: 8.2 (5%) max: 10.3 Watt
CPU TDP ? TDP 7 W TDP 9 W TDP 10 W TDP 15 W TDP 20 W 105% 104% 102% 100% 101% 101%
Power Consumption - Idle Power Consumption 150cd 1min *
3.9 Watt (4%)
Power Consumption - Cinebench R15 Multi Power Efficiency - external Monitor
min: 17.6 avg: 18.3 median: 18.3 (14%) max: 19.1 Points per Watt
CPU TDP 10 W TDP 20 W 94% 100%
9.6 Points per Watt (7%)
CPU TDP ? TDP 10 W TDP 20 W 51% 94% 100%
min: 7.03 avg: 8.4 median: 8.6 (6%) max: 9.39 Points per Watt
CPU TDP ? TDP 10 W TDP 20 W TDP 125 W TDP 130 W 49% 94% 100% 50% 38%
Average Benchmarks Intel Processor N100 → 100% n=31 Average Benchmarks Intel Core i7-11700K → 326% n=31 Average Benchmarks Intel Core i9-11900K → 343% n=31
- Range of benchmark values for this graphics card
- Average benchmark values for this graphics card
* Smaller numbers mean a higher performance
1 This benchmark is not used for the average calculation
v1.28
log 02. 07:35:32
#0 checking url part for id 14932 +0s ... 0s
#1 checking url part for id 12999 +0s ... 0s
#2 checking url part for id 13161 +0s ... 0s
#3 redirected to Ajax server, took 1719898532 +0s ... 0s
#4 did not recreate cache, as it is less than 5 days old! Created at Mon, 01 Jul 2024 05:15:43 +0200 +0s ... 0s
#5 composed specs +0.006s ... 0.006s
#6 did output specs +0s ... 0.006s
#7 getting avg benchmarks for device 14932 +0.004s ... 0.01s
#8 got single benchmarks 14932 +0.01s ... 0.02s
#9 getting avg benchmarks for device 12999 +0.004s ... 0.024s
#10 got single benchmarks 12999 +0.004s ... 0.028s
#11 getting avg benchmarks for device 13161 +0.004s ... 0.032s
#12 got single benchmarks 13161 +0.009s ... 0.04s
#13 got avg benchmarks for devices +0s ... 0.04s
#14 min, max, avg, median took s +0.072s ... 0.112s
#15 return log +0s ... 0.112s
Please share our article, every link counts!
Redaktion, 2017-09- 8 (Update: 2023-07- 1)
 Deutsch
 English
 Español
 Français
 Italiano
 Nederlands
 Polski
 Português
 Русский
 Türkçe
 Svenska
 Chinese
 Magyar