ARM Mali-G68 MP2 vs NVIDIA GeForce RTX 4070 Ti SUPER
ARM Mali-G68 MP2 ► remove from comparison
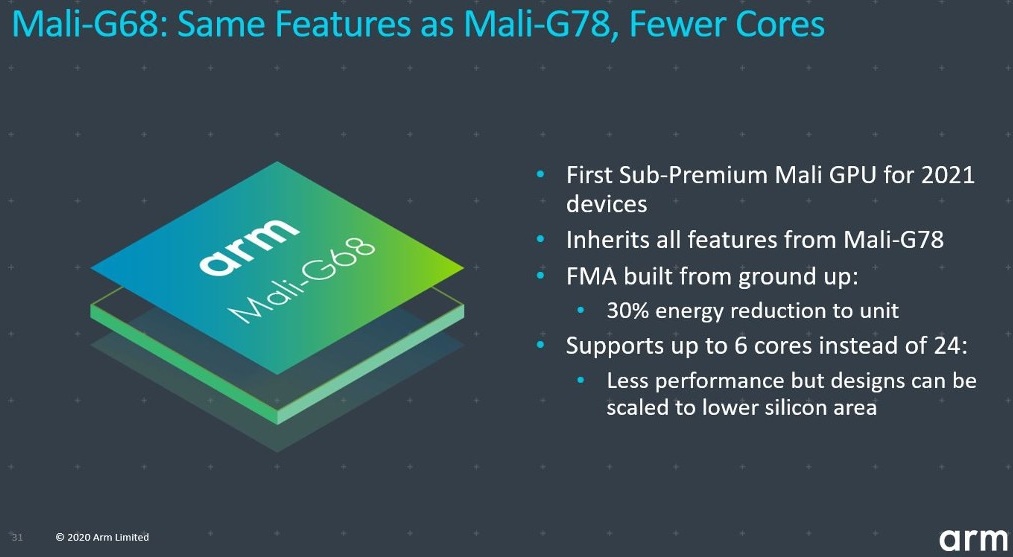
The ARM Mali-G68 MP2 (or G68MC2) is an integrated mid-range graphics card for ARM based SoCs (mostly Android based). The MP2 version uses two of the six possible clusters / cores.
It was introduced mid 2021 in the Samsung Exynos W920 for smartwatches. It is based on the Valhall architecture and is advertised by ARM as a "sub-premium GPU". It offers all features of the Mali-G78 series including improvements for battery runtime and machine learning.
NVIDIA GeForce RTX 4070 Ti SUPER ► remove from comparison
The Nvidia GeForce RTX 4070 Ti SUPER is a high-end desktop graphics card based on the Ada Lovelace architecture. It uses the AD103 chip and offers 8.448 cores and 16 GB GDDR6X graphics memory (256-bit bus with 22.4 Gbits).
The gaming performance is still sufficient for 4k with ultra settings, even in demanding games such as Cyberpunk, but 60 fps is no longer always achieved. With ray tracing, the use of DLSS and possibly reducing the resolution is recommended. In a competitive comparison, the SUPER variant ranks, as expected, between the RTX 4080 and the old 4070 Ti in a competitive comparison.
The AD103 chip is produced at TSMC in 5nm (4N with EUV) and is specified with a TGP (Total Graphics Power) of 285 watts.
ARM Mali-G68 MP2 NVIDIA GeForce RTX 4070 Ti SUPER GeForce RTX 4000 Series Codename Valhall AD103-275 Architecture Valhall Ada Lovelace Pipelines 2 - unified 8448 - unified Shared Memory no no technology 5 nm 5 nm Date of Announcement 14.09.2021 24.01.2024 Link to Manufacturer Page www.arm.com TMUs 264 ROPs 96 Raytracing Cores 66 Tensor / AI Cores 264 Core Speed 2340 - 2610 (Boost) MHz Theoretical Performance 40.1 TFLOPS FP16, 40.1 TFLOPS FP32, 0.63 TFLOPS FP64 Cache L2: 48 MB Memory Speed 21000 effective = 1400 MHz Memory Bus Width 256 Bit Memory Type GDDR6X Max. Amount of Memory 16 GB API DirectX 12 Ultimate, Shader 6.7, OpenGL 4.6, OpenCL 3.0, Vulkan 1.3 Power Consumption 285 Watt Transistors 45.9 Billion Die Size 379 mm² PCIe 4.0 x16 Displays 4 Displays (max.), HDMI 2.1, DisplayPort 1.4a Predecessor NVIDIA GeForce RTX 4070 Ti
Benchmarks Performance Rating - 3DMark 11 + Fire Strike + Time Spy - NVIDIA GeForce RTX 4070 Ti SUPER
24 pt (72%)
NVIDIA GeForce RTX 4070 Ti SUPER
...
max:
3DMark - 3DMark Time Spy Score
23540 Points (68%)
3DMark - 3DMark Time Spy Graphics
23695 Points (63%)
3DMark - 3DMark Ice Storm Unlimited Graphics
759135 Points (86%)
3DMark - 3DMark Cloud Gate Score
79438 Points (85%)
3DMark - 3DMark Cloud Gate Graphics
165604 Points (44%)
3DMark - 3DMark Fire Strike Standard Score
42631 Points (75%)
3DMark - 3DMark Fire Strike Standard Graphics
52738 Points (60%)
3DMark - 3DMark Ice Storm Graphics
587810 Points (71%)
3DMark - 3DMark Night Raid
91419 Points (86%)
3DMark - 3DMark Night Raid Graphics Score
209177 Points (80%)
3DMark 11 - 3DM11 Performance Score
54278 Points (75%)
3DMark 11 - 3DM11 Performance GPU
74834 Points (64%)
Unigine Valley 1.0 - Unigine Valley 1.0 DX
242.6 fps (79%)
Blender - Blender 3.3 Classroom CUDA *
17 Seconds (3%)
Blender - Blender 3.3 Classroom OPTIX *
10 Seconds (4%)
Cinebench R15 + NVIDIA GeForce RTX 4070 Ti SUPER Cinebench R15 - Cinebench R15 OpenGL 64 Bit
min: 289 avg: 311 median: 317 (18%) max: 327 fps
Cinebench R15 OpenGL Ref. Match 64 Bit + NVIDIA GeForce RTX 4070 Ti SUPER Cinebench R15 - Cinebench R15 OpenGL Ref. Match 64 Bit
99.6 % (100%)
LuxMark v2.0 64Bit - LuxMark v2.0 Room GPU
9355 Samples/s (42%)
LuxMark v2.0 64Bit - LuxMark v2.0 Sala GPU
19620 Samples/s (34%)
ComputeMark v2.1 - ComputeMark v2.1 Result
54675 Points (59%)
Power Consumption - Furmark Stress Test Power Consumption - external Monitor *
min: 395 avg: 410.5 median: 410.5 (58%) max: 426 Watt
Power Consumption - The Witcher 3 Power Consumption - external Monitor *
min: 393 avg: 395.5 median: 395.5 (55%) max: 398 Watt
Power Consumption - Witcher 3 ultra Power Efficiency - external Monitor
0.5 fps per Watt (44%)
Average Benchmarks NVIDIA GeForce RTX 4070 Ti SUPER → 0% n=
- Range of benchmark values for this graphics card
- Average benchmark values for this graphics card
* Smaller numbers mean a higher performance
1 This benchmark is not used for the average calculation
Game Benchmarks The following benchmarks stem from our benchmarks of review laptops. The performance depends on the used graphics memory, clock rate, processor, system settings, drivers, and operating systems. So the results don't have to be representative for all laptops with this GPU. For detailed information on the benchmark results, click on the fps number.
NVIDIA GeForce RTX 4070 Ti SUPER:
163 fps
NVIDIA GeForce RTX 4070 Ti SUPER:
141.8 fps
NVIDIA GeForce RTX 4070 Ti SUPER:
113.2 fps
NVIDIA GeForce RTX 4070 Ti SUPER:
76.6 fps
NVIDIA GeForce RTX 4070 Ti SUPER:
39.8 fps
NVIDIA GeForce RTX 4070 Ti SUPER:
68.9 fps
NVIDIA GeForce RTX 4070 Ti SUPER:
227 fps
NVIDIA GeForce RTX 4070 Ti SUPER:
184 fps
NVIDIA GeForce RTX 4070 Ti SUPER:
179 fps
NVIDIA GeForce RTX 4070 Ti SUPER:
133 fps
NVIDIA GeForce RTX 4070 Ti SUPER:
84 fps
NVIDIA GeForce RTX 4070 Ti SUPER:
112 fps
NVIDIA GeForce RTX 4070 Ti SUPER:
124.7 fps
NVIDIA GeForce RTX 4070 Ti SUPER:
114.4 fps
NVIDIA GeForce RTX 4070 Ti SUPER:
82.5 fps
NVIDIA GeForce RTX 4070 Ti SUPER:
44.7 fps
NVIDIA GeForce RTX 4070 Ti SUPER:
63.7 fps
NVIDIA GeForce RTX 4070 Ti SUPER:
221 fps
NVIDIA GeForce RTX 4070 Ti SUPER:
206 fps
NVIDIA GeForce RTX 4070 Ti SUPER:
170 fps
NVIDIA GeForce RTX 4070 Ti SUPER:
136 fps
NVIDIA GeForce RTX 4070 Ti SUPER:
84 fps
NVIDIA GeForce RTX 4070 Ti SUPER:
112 fps
NVIDIA GeForce RTX 4070 Ti SUPER:
188.5 fps
NVIDIA GeForce RTX 4070 Ti SUPER:
188.5 fps
NVIDIA GeForce RTX 4070 Ti SUPER:
170.8 fps
NVIDIA GeForce RTX 4070 Ti SUPER:
150.3 fps
NVIDIA GeForce RTX 4070 Ti SUPER:
94.9 fps
NVIDIA GeForce RTX 4070 Ti SUPER:
42.3 fps
NVIDIA GeForce RTX 4070 Ti SUPER:
246 fps
NVIDIA GeForce RTX 4070 Ti SUPER:
223 fps
NVIDIA GeForce RTX 4070 Ti SUPER:
218 fps
NVIDIA GeForce RTX 4070 Ti SUPER:
157.8 fps
NVIDIA GeForce RTX 4070 Ti SUPER:
117.2 fps
NVIDIA GeForce RTX 4070 Ti SUPER:
133.9 fps
NVIDIA GeForce RTX 4070 Ti SUPER:
385 fps
NVIDIA GeForce RTX 4070 Ti SUPER:
402 fps
NVIDIA GeForce RTX 4070 Ti SUPER:
363 fps
NVIDIA GeForce RTX 4070 Ti SUPER:
138.2 fps
NVIDIA GeForce RTX 4070 Ti SUPER:
90 fps
NVIDIA GeForce RTX 4070 Ti SUPER:
45.1 fps
NVIDIA GeForce RTX 4070 Ti SUPER:
77.4 fps
NVIDIA GeForce RTX 4070 Ti SUPER:
210.6 fps
NVIDIA GeForce RTX 4070 Ti SUPER:
202.9 fps
NVIDIA GeForce RTX 4070 Ti SUPER:
149.4 fps
NVIDIA GeForce RTX 4070 Ti SUPER:
114.8 fps
NVIDIA GeForce RTX 4070 Ti SUPER:
70 fps
NVIDIA GeForce RTX 4070 Ti SUPER:
371 fps
NVIDIA GeForce RTX 4070 Ti SUPER:
384 fps
NVIDIA GeForce RTX 4070 Ti SUPER:
336 fps
NVIDIA GeForce RTX 4070 Ti SUPER:
144.9 fps
NVIDIA GeForce RTX 4070 Ti SUPER:
95.1 fps
NVIDIA GeForce RTX 4070 Ti SUPER:
48.9 fps
NVIDIA GeForce RTX 4070 Ti SUPER:
278 fps
NVIDIA GeForce RTX 4070 Ti SUPER:
282 fps
NVIDIA GeForce RTX 4070 Ti SUPER:
283 fps
NVIDIA GeForce RTX 4070 Ti SUPER:
217 fps
NVIDIA GeForce RTX 4070 Ti SUPER:
99.2 fps
NVIDIA GeForce RTX 4070 Ti SUPER:
196.9 fps
NVIDIA GeForce RTX 4070 Ti SUPER:
195.9 fps
NVIDIA GeForce RTX 4070 Ti SUPER:
172.3 fps
NVIDIA GeForce RTX 4070 Ti SUPER:
157.5 fps
NVIDIA GeForce RTX 4070 Ti SUPER:
103.6 fps
NVIDIA GeForce RTX 4070 Ti SUPER:
49.7 fps
NVIDIA GeForce RTX 4070 Ti SUPER:
213 fps
NVIDIA GeForce RTX 4070 Ti SUPER:
162.2 fps
NVIDIA GeForce RTX 4070 Ti SUPER:
121.5 fps
NVIDIA GeForce RTX 4070 Ti SUPER:
63.7 fps
NVIDIA GeForce RTX 4070 Ti SUPER:
209 fps
NVIDIA GeForce RTX 4070 Ti SUPER:
191 fps
NVIDIA GeForce RTX 4070 Ti SUPER:
169 fps
NVIDIA GeForce RTX 4070 Ti SUPER:
154 fps
NVIDIA GeForce RTX 4070 Ti SUPER:
91 fps
NVIDIA GeForce RTX 4070 Ti SUPER:
171.2 fps
NVIDIA GeForce RTX 4070 Ti SUPER:
159.3 fps
NVIDIA GeForce RTX 4070 Ti SUPER:
144.2 fps
NVIDIA GeForce RTX 4070 Ti SUPER:
115.9 fps
NVIDIA GeForce RTX 4070 Ti SUPER:
68.6 fps
NVIDIA GeForce RTX 4070 Ti SUPER:
239 fps
NVIDIA GeForce RTX 4070 Ti SUPER:
231 fps
NVIDIA GeForce RTX 4070 Ti SUPER:
181 fps
NVIDIA GeForce RTX 4070 Ti SUPER:
96.6 fps
NVIDIA GeForce RTX 4070 Ti SUPER:
192.1 fps
NVIDIA GeForce RTX 4070 Ti SUPER:
176.8 fps
NVIDIA GeForce RTX 4070 Ti SUPER:
169.6 fps
NVIDIA GeForce RTX 4070 Ti SUPER:
143.6 fps
NVIDIA GeForce RTX 4070 Ti SUPER:
79.4 fps
NVIDIA GeForce RTX 4070 Ti SUPER:
226 fps
NVIDIA GeForce RTX 4070 Ti SUPER:
196.9 fps
NVIDIA GeForce RTX 4070 Ti SUPER:
130.3 fps
NVIDIA GeForce RTX 4070 Ti SUPER:
66.4 fps
NVIDIA GeForce RTX 4070 Ti SUPER:
78.9 fps
NVIDIA GeForce RTX 4070 Ti SUPER:
236 fps
NVIDIA GeForce RTX 4070 Ti SUPER:
193.5 fps
NVIDIA GeForce RTX 4070 Ti SUPER:
158.3 fps
NVIDIA GeForce RTX 4070 Ti SUPER:
130.9 fps
NVIDIA GeForce RTX 4070 Ti SUPER:
84.4 fps
NVIDIA GeForce RTX 4070 Ti SUPER:
273 fps
NVIDIA GeForce RTX 4070 Ti SUPER:
269 fps
NVIDIA GeForce RTX 4070 Ti SUPER:
256 fps
NVIDIA GeForce RTX 4070 Ti SUPER:
205 fps
NVIDIA GeForce RTX 4070 Ti SUPER:
109.5 fps
NVIDIA GeForce RTX 4070 Ti SUPER:
568 fps
NVIDIA GeForce RTX 4070 Ti SUPER:
467 fps
NVIDIA GeForce RTX 4070 Ti SUPER:
442 fps
NVIDIA GeForce RTX 4070 Ti SUPER:
407 fps
NVIDIA GeForce RTX 4070 Ti SUPER:
306 fps
NVIDIA GeForce RTX 4070 Ti SUPER:
161.9 fps
NVIDIA GeForce RTX 4070 Ti SUPER:
203 fps
NVIDIA GeForce RTX 4070 Ti SUPER:
197 fps
NVIDIA GeForce RTX 4070 Ti SUPER:
188 fps
NVIDIA GeForce RTX 4070 Ti SUPER:
187 fps
NVIDIA GeForce RTX 4070 Ti SUPER:
119 fps
NVIDIA GeForce RTX 4070 Ti SUPER:
224 fps
NVIDIA GeForce RTX 4070 Ti SUPER:
196.7 fps
NVIDIA GeForce RTX 4070 Ti SUPER:
150 fps
NVIDIA GeForce RTX 4070 Ti SUPER:
127.8 fps
NVIDIA GeForce RTX 4070 Ti SUPER:
235 fps
NVIDIA GeForce RTX 4070 Ti SUPER:
235 fps
NVIDIA GeForce RTX 4070 Ti SUPER:
209 fps
NVIDIA GeForce RTX 4070 Ti SUPER:
168.8 fps
NVIDIA GeForce RTX 4070 Ti SUPER:
98.9 fps
NVIDIA GeForce RTX 4070 Ti SUPER:
245 fps
NVIDIA GeForce RTX 4070 Ti SUPER:
228 fps
NVIDIA GeForce RTX 4070 Ti SUPER:
226 fps
NVIDIA GeForce RTX 4070 Ti SUPER:
202 fps
NVIDIA GeForce RTX 4070 Ti SUPER:
203 fps
NVIDIA GeForce RTX 4070 Ti SUPER:
558 fps
NVIDIA GeForce RTX 4070 Ti SUPER:
430 fps
NVIDIA GeForce RTX 4070 Ti SUPER:
210 fps
NVIDIA GeForce RTX 4070 Ti SUPER:
159.3 fps
NVIDIA GeForce RTX 4070 Ti SUPER:
187.6 fps
NVIDIA GeForce RTX 4070 Ti SUPER:
187.6 fps
NVIDIA GeForce RTX 4070 Ti SUPER:
187.4 fps
NVIDIA GeForce RTX 4070 Ti SUPER:
160.1 fps
NVIDIA GeForce RTX 4070 Ti SUPER:
155.3 fps
NVIDIA GeForce RTX 4070 Ti SUPER:
182.1 fps
NVIDIA GeForce RTX 4070 Ti SUPER low med. high ultra QHD 4K Avatar Frontiers of Pandora 163 141.8 113.2 76.6 39.8 Call of Duty Modern Warfare 3 2023 227 184 179 133 84 Alan Wake 2 124.7 114.4 82.5 44.7 Assassin's Creed Mirage 221 206 170 136 84 Cyberpunk 2077 2.1 Phantom Liberty 188.5 188.5 170.8 150.3 94.9 42.3 Baldur's Gate 3 246 223 218 157.8 117.2 F1 23 385 402 363 138.2 90 45.1 The Callisto Protocol 210.62 202.94 149.39 114.82 70.04 F1 22 371 384 336 144.9 95.1 48.9 Ghostwire Tokyo 278 282 283 217 99.2 Cyberpunk 2077 1.6 196.9 195.9 172.3 157.5 103.6 49.7 Dying Light 2 213 162.2 121.5 63.7 Far Cry 6 209 191 169 154 91 Watch Dogs Legion 171.2 159.3 144.2 115.9 68.6 Mafia Definitive Edition 239 231 181 96.6 Borderlands 3 192.1 176.8 169.6 143.6 79.4 Control 226 196.9 130.3 66.4 Metro Exodus 236 193.5 158.3 130.9 84.4 Shadow of the Tomb Raider 273 269 256 205 109.5 Strange Brigade 568 467 442 407 306 161.9 Far Cry 5 203 197 188 187 119 X-Plane 11.11 224 196.7 150 127.8 Final Fantasy XV Benchmark 235 235 209 168.8 98.9 Dota 2 Reborn 245 228 226 202 203 The Witcher 3 558 430 210 159.3 GTA V 187.6 187.6 187.4 160.1 155.3 182.1 < 30 fps < 60 fps < 120 fps ≥ 120 fps 9 26 1 25 1 19 8 16 6 15 4
For more games that might be playable and a list of all games and graphics cards visit our Gaming List
v1.28
log 30. 20:10:23
#0 checking url part for id 10947 +0s ... 0s
#1 checking url part for id 12305 +0s ... 0s
#2 redirected to Ajax server, took 1719771023 +0s ... 0s
#3 did not recreate cache, as it is less than 5 days old! Created at Fri, 28 Jun 2024 05:15:43 +0200 +0s ... 0s
#4 composed specs +0.053s ... 0.054s
#5 did output specs +0s ... 0.054s
#6 start showIntegratedCPUs +0s ... 0.054s
#7 getting avg benchmarks for device 10947 +0.018s ... 0.072s
#8 got single benchmarks 10947 +0.005s ... 0.077s
#9 getting avg benchmarks for device 12305 +0.007s ... 0.084s
#10 got single benchmarks 12305 +0.004s ... 0.088s
#11 got avg benchmarks for devices +0s ... 0.088s
#12 min, max, avg, median took s +0.01s ... 0.098s
#13 before gaming benchmark output +0s ... 0.098s
#14 Got 137 rows for game benchmarks. +0.007s ... 0.106s
#15 composed SQL query for gamebenchmarks +0s ... 0.106s
#16 got data and put it in $dataArray +0.001s ... 0.107s
#17 benchmarks composed for output. +0.008s ... 0.116s
#18 calculated avg scores. +0s ... 0.116s
#19 return log +0.002s ... 0.117s
Please share our article, every link counts!
Redaktion, 2017-09- 8 (Update: 2023-07- 1)
 Deutsch
 English
 Español
 Français
 Italiano
 Nederlands
 Polski
 Português
 Русский
 Türkçe
 Svenska
 Chinese
 Magyar