ARM Mali-G610 MP4 vs Qualcomm Adreno 690 vs ARM Mali-G610 MP3
ARM Mali-G610 MP4 ► remove from comparison
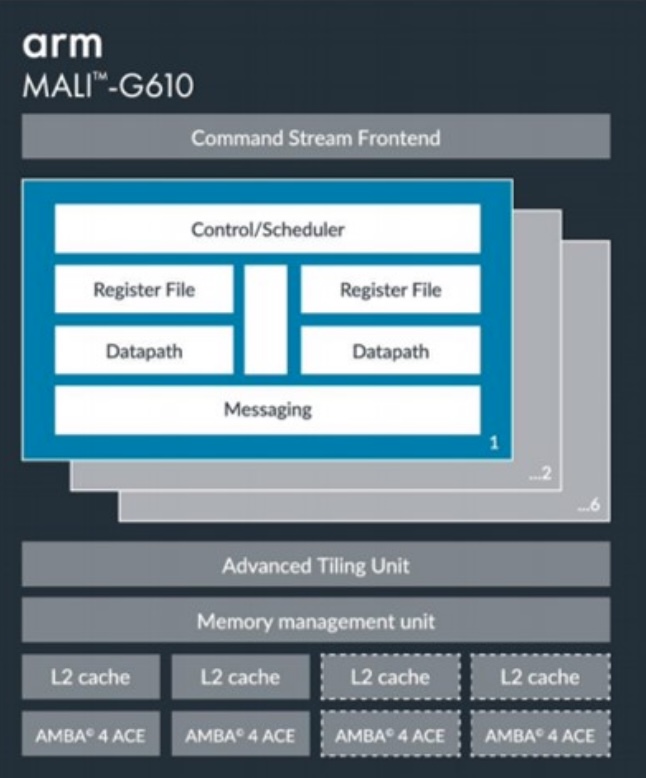
The ARM Mali-G610 MP4 or MC4 is an integrated mid-range graphics card for smartphones with 4 cores. It is based on the second generation of the Valhall architecture and supports OpenGL ES 3.2, OpenCL 2.0 and Vulkan 1.2. It was first integrated in the 2023 smartphone SoC, the MediaTek Dimensity 7200-Ultra .
Qualcomm Adreno 690 ► remove from comparison
The Qualcomm Adreno 690 is an integrated graphics card in the Qualcomm Snapdragon 8cx Gen 3 SoC for Windows laptops. According to Qualcomm, the 690 is up to 60% faster than the previous generation. In our tests with the Lenovo ThinkPad X13s, the Adreno 690 was only on par with a low en Intel UHD Graphics iGPU and not well suited for 3D games.
The chip is manufactured in 5nm at Samsung (5LPE) and suited for fanless laptops.
ARM Mali-G610 MP3 ► remove from comparison
The ARM Mali-G610 MP3 or MC3 is an integrated mid-range graphics card for smartphones with 3 cores. It is based on the second generation of the Valhall architecture and supports OpenGL ES 3.2, OpenCL 2.0 and Vulkan 1.2.
We first found the GPU in the 2023 MediaTek Dimensity 7030 where the GPU positioned itself between the Adreno 642L (Snapdragon 778G) and Adreno 644 (Snapdragon 7 Gen 1) depending on the benchmark (see below).
The Mali-G610 MP3 in the Dimensity 7030 is manufactured in the matured 6nm process at TSMC.
ARM Mali-G610 MP4 Qualcomm Adreno 690 ARM Mali-G610 MP3 Mali-G610 Series Codename Valhall Valhall Architecture Valhall Valhall Pipelines 6 - unified 3 - unified Shared Memory yes yes yes API OpenGL ES 3.2 DirectX 12 OpenGL ES 3.2 technology 4 nm 5 nm 4 nm Features OpenGL ES 3.2, OpenCL 2.0, DirectX 12, Vulkan 1.1 OpenGL ES 3.2, OpenCL 2.0, DirectX 12, Vulkan 1.1 Date of Announcement 25.05.2021 06.12.2018 25.05.2021 Link to Manufacturer Page www.arm.com www.arm.com Power Consumption 7 Watt
Benchmarks Performance Rating - 3DMark 11 + Fire Strike + Time Spy - Adreno 690
1.3 pt (4%)
...
max:
3DMark - 3DMark Time Spy Score
909 Points (3%)
3DMark - 3DMark Time Spy Graphics
811 Points (2%)
3DMark - 3DMark Cloud Gate Score
min: 8602 avg: 9818 median: 9818 (10%) max: 11034 Points
3DMark - 3DMark Cloud Gate Graphics
min: 13768 avg: 16708 median: 16707.5 (4%) max: 19647 Points
3DMark - 3DMark Fire Strike Standard Score
min: 2758 avg: 2835 median: 2834.5 (5%) max: 2911 Points
3DMark - 3DMark Fire Strike Standard Graphics
min: 2837 avg: 2933 median: 2932.5 (3%) max: 3028 Points
3DMark - 3DMark Ice Storm Graphics
14652 Points (2%)
3DMark - 3DMark Sling Shot (ES 3.0) Unlimited
min: 7035 avg: 7158 median: 7158 (31%) max: 7281 Points
3DMark - 3DMark Sling Shot (ES 3.0) Unlimited Graphics
min: 9011 avg: 9380 median: 9379.5 (21%) max: 9748 Points
3DMark - 3DMark Sling Shot Extreme (ES 3.1) Unlimited
min: 5966 avg: 6016 median: 6015.5 (30%) max: 6065 Points
4211 Points (21%)
3DMark - 3DMark Sling Shot Extreme (ES 3.1) Unlimited Graphics
min: 6935 avg: 7105 median: 7105 (21%) max: 7275 Points
4258 Points (13%)
3DMark - 3DMark Wild Life Unlimited
min: 4259 avg: 4371 median: 4371 (2%) max: 4483 Points
2583 Points (1%)
3DMark - 3DMark Wild Life Extreme Unlimited
min: 1156 avg: 1179 median: 1179 (1%) max: 1202 Points
3067 Points (4%)
693 Points (1%)
3DMark 11 - 3DM11 Performance Score
min: 3063 avg: 3085 median: 3077 (4%) max: 3115 Points
3DMark 11 - 3DM11 Performance GPU
min: 2898 avg: 2930 median: 2912 (3%) max: 2979 Points
Cinebench R10 Cinebench R10 Shading (32bit) + Qualcomm Adreno 690 Cinebench R10 - Cinebench R10 Shading (32bit)
558 Points (0%)
Cinebench R15 + Qualcomm Adreno 690 Cinebench R15 - Cinebench R15 OpenGL 64 Bit
min: 13.4 avg: 13.7 median: 13.7 (1%) max: 14 fps
Cinebench R15 OpenGL Ref. Match 64 Bit + Qualcomm Adreno 690 Cinebench R15 - Cinebench R15 OpenGL Ref. Match 64 Bit
98 % (98%)
GFXBench - GFXBench 5.0 4K Aztec Ruins High Tier Offscreen
min: 9.4 avg: 9.5 median: 9.5 (4%) max: 9.5 fps
5.3 fps (2%)
GFXBench - GFXBench 5.0 Aztec Ruins High Tier Offscreen
min: 21 avg: 21.5 median: 21.5 (4%) max: 22 fps
12 fps (2%)
GFXBench - GFXBench 5.0 Aztec Ruins Normal Tier Offscreen
min: 53 avg: 53.5 median: 53.5 (4%) max: 54 fps
32 fps (2%)
GFXBench - GFXBench Car Chase Offscreen
min: 40 avg: 42 median: 42 (5%) max: 44 fps
26 fps (3%)
GFXBench 3.1 - GFXBench Manhattan ES 3.1 Offscreen
min: 67 avg: 70 median: 70 (1%) max: 73 fps
49 fps (1%)
GFXBench 3.0 - GFXBench 3.0 Manhattan Offscreen
min: 98 avg: 104.5 median: 104.5 (6%) max: 111 fps
71 fps (4%)
GFXBench (DX / GLBenchmark) 2.7 + ARM Mali-G610 MP4 GFXBench (DX / GLBenchmark) 2.7 - GFXBench T-Rex HD Offscreen C24Z16
min: 159 avg: 175 median: 175 (1%) max: 191 fps
GFXBench T-Rex HD Offscreen C24Z16 + ARM Mali-G610 MP3
117 fps (1%)
Antutu v9 - AnTuTu v9 GPU
min: 187031 avg: 202428 median: 202428 (25%) max: 217824 Points
136557 Points (17%)
Basemark GPU 1.2 - Basemark GPU 1.2 Vulkan Official Medium Offscreen 1080
71 fps (0%)
39.7 fps (0%)
Geekbench 6.2 - Geekbench 6.2 GPU OpenCL
min: 3292 avg: 3307 median: 3306.5 (1%) max: 3321 Points
Geekbench 6.2 - Geekbench 6.2 GPU Vulkan
min: 3207 avg: 3290 median: 3289.5 (1%) max: 3372 Points
PassMark PerformanceTest Mobile V1 - PerformanceTest Mobile V1 2D Graphics Tests
30918 Points (31%)
PassMark PerformanceTest Mobile V1 - PerformanceTest Mobile V1 3D Graphics Tests
35024 Points (61%)
Power Consumption - Furmark Stress Test Power Consumption - external Monitor *
min: 17 avg: 19.7 median: 19.7 (3%) max: 22.3 Watt
Power Consumption - The Witcher 3 Power Consumption - external Monitor *
15.8 Watt (2%)
Power Consumption - Witcher 3 Power Consumption *
16.4 Watt (4%)
Power Consumption - GFXBench Aztec Ruins Normal Tier Offscreen Power Consumption 150cd *
min: 4.26 avg: 4.4 median: 4.4 (2%) max: 4.58 Watt
8.8 Watt (3%)
Average Benchmarks ARM Mali-G610 MP4 → 100% n=1 Average Benchmarks Qualcomm Adreno 690 → 260% n=1 Average Benchmarks ARM Mali-G610 MP3 → 59% n=1
- Range of benchmark values for this graphics card
- Average benchmark values for this graphics card
* Smaller numbers mean a higher performance
1 This benchmark is not used for the average calculation
Game Benchmarks The following benchmarks stem from our benchmarks of review laptops. The performance depends on the used graphics memory, clock rate, processor, system settings, drivers, and operating systems. So the results don't have to be representative for all laptops with this GPU. For detailed information on the benchmark results, click on the fps number.
100%
Mali-G610 MP4:
47.9 [X] Nothing Phone (2a) 4.6.0_22174900_22378599
MediaTek Dimensity 7200 2GHz
Mali-G610 MP4
min:
15 fps, max:
58 fps
53 ~ 50 fps
100%
Mali-G610 MP4:
34.6 [X] Nothing Phone (2a) 4.5.0_21307647_21321795
MediaTek Dimensity 7200 2GHz
Mali-G610 MP4
min:
19 fps, max:
50 fps
44 ~ 39 fps
100%
Mali-G610 MP4:
59.3 fps
101%
Mali-G610 MP3:
60 fps
100%
Mali-G610 MP4:
39.7 fps
100%
Mali-G610 MP4:
39.4 60 ~ 50 fps
100%
Mali-G610 MP4:
57.3 60 ~ 59 fps
Average Gaming ARM Mali-G610 MP4 → 100% Average Gaming 30-70 fps → 100%
Average Gaming ARM Mali-G610 MP3 → 79% Average Gaming 30-70 fps → 91%
Qualcomm Adreno 690 low med. high ultra QHD 4K F1 22 26 22.5 17 12.6 X-Plane 11.11 14 12 11 Final Fantasy XV Benchmark 19 12.3 7.29 Dota 2 Reborn 58 55 44 37 The Witcher 3 25 16 10 4 GTA V 29.9 < 30 fps < 60 fps < 120 fps ≥ 120 fps 5 1 4 1 4 1 2 1
ARM Mali-G610 MP3 low med. high ultra QHD 4K Diablo Immortal 60 38 Genshin Impact 30 29 PUBG Mobile 60 40 < 30 fps < 60 fps < 120 fps ≥ 120 fps 1 2 1 1 1
ARM Mali-G610 MP4 low med. high ultra QHD 4K Genshin Impact 50 39 PUBG Mobile 59.3 39.7 50 Asphalt 9: Legends 59 < 30 fps < 60 fps < 120 fps ≥ 120 fps 2 1 2 1
For more games that might be playable and a list of all games and graphics cards visit our Gaming List
v1.28
log 02. 04:54:21
#0 checking url part for id 12462 +0s ... 0s
#1 checking url part for id 11411 +0s ... 0s
#2 checking url part for id 11622 +0s ... 0s
#3 redirected to Ajax server, took 1719888860 +0s ... 0s
#4 did not recreate cache, as it is less than 5 days old! Created at Mon, 01 Jul 2024 05:16:07 +0200 +0s ... 0s
#5 composed specs +0.053s ... 0.053s
#6 did output specs +0s ... 0.053s
#7 start showIntegratedCPUs +0s ... 0.053s
#8 getting avg benchmarks for device 12462 +0.026s ... 0.079s
#9 got single benchmarks 12462 +0.005s ... 0.084s
#10 getting avg benchmarks for device 11411 +0.007s ... 0.092s
#11 got single benchmarks 11411 +0.005s ... 0.097s
#12 getting avg benchmarks for device 11622 +0s ... 0.097s
#13 got single benchmarks 11622 +0.003s ... 0.1s
#14 got avg benchmarks for devices +0s ... 0.1s
#15 min, max, avg, median took s +0.023s ... 0.123s
#16 before gaming benchmark output +0s ... 0.124s
#17 Got 56 rows for game benchmarks. +0.006s ... 0.13s
#18 composed SQL query for gamebenchmarks +0s ... 0.13s
#19 got data and put it in $dataArray +0s ... 0.13s
#20 benchmarks composed for output. +0.003s ... 0.133s
#21 calculated avg scores. +0s ... 0.133s
#22 return log +0s ... 0.134s
Please share our article, every link counts!
Redaktion, 2017-09- 8 (Update: 2023-07- 1)
 Deutsch
 English
 Español
 Français
 Italiano
 Nederlands
 Polski
 Português
 Русский
 Türkçe
 Svenska
 Chinese
 Magyar