Notebookcheck Logo

Apple M4 10-core GPU vs Apple M3 Pro 18-Core GPU

Apple M4 10-core GPU

► remove from comparison Apple M4 10-Core GPU

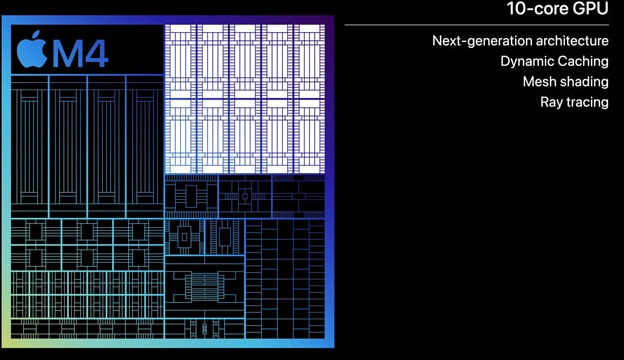
The 10-core Apple M4 GPU is a graphics adapter built into Apple M4 SoCs that features 10 cores and uses the unified memory architecture (LPDDR5X-7500, 120 GB/s bandwidth). The Apple-designed iGPU unfortunately does not have any noteworthy new features that could help it stand out from its M3 series predecessors.

Much like the 10-core GPU built into the M3 SoC, the M4 GPU (10 cores) has hardware support for ray tracing as well as mesh shading and other modern technologies. It supports external displays with resolutions as high as 6K and it can hardware-decode the popular AV1, HEVC and AVC video codecs (encoding is not yet supported for AV1).

While early benchmark comparisons between the M4 GPU and the M3 GPU hint at performance gains as high as 15%, it is important to state that the M4 chip's performance sustainability is set to be very poor because of the new iPads' thin chassis that lacks active cooling.

  • M4 GPU Geekbench Metal - early results: ~53,800 points
  • M3 GPU Geekbench Metal - Notebookcheck database: ~47,000 points

Just like the rest of the Apple M4 chip, the graphics adapter is manufactured on a "second generation 3 nm" TSMC process for high, as of H1 2024, energy efficiency.

Apple M3 Pro 18-Core GPU

► remove from comparison Apple M3 Pro 18-Core GPU

The Apple M3 Pro 18-Core GPU is a self-designed graphics card in the Apple M3 Pro (with 12 CPU cores) and offers all eighteen cores available on the chip. The graphics card uses a new architecture and now offers dynamic caching, mesh shading and ray tracing acceleration.

The GPU can access up to 36 GB LPDDR5-6400 unified memory via a 192-bit memory bus (max 150 GBit/s). Thanks to dynamic caching, the GPU only reserves as much memory as is required.

The entire chip is manufactured in the current 3nm process (probably N3B) at TSMC.

Apple M4 10-core GPUApple M3 Pro 18-Core GPU
Pipelines10 - unified18 - unified
Memory TypeLPDDR5X-7500LPDDR5-6400
Shared Memoryyesno
Power Consumption10 Watt
technology3 nm5 nm
Date of Announcement07.05.2024 31.10.2023
PredecessorM3 10-Core GPU
Apple M3 Series
M3 Max 40-Core GPU compare 40
M3 Max 30-Core GPU compare 30
M3 Pro 18-Core GPU 18
M3 Pro 14-Core GPU compare 14
M3 10-Core GPU compare 10
M3 8-Core GPU compare 8
Notebook Sizemedium sized
CPU in M4 10-Core GPUGPU Base SpeedGPU Boost / Turbo
Apple M4 (10 cores)10 x ? MHz, 10 W? MHz? MHz
Apple M4 (9 cores)9 x ? MHz, 11 W? MHz? MHz
min. - max.? MHz? MHz
CPU in M3 Pro 18-Core GPUGPU Base SpeedGPU Boost / Turbo
Apple M3 Pro 12-Core12 x 2748 MHz, 27 W? MHz? MHz

Benchmarks

3DMark - 3DMark Wild Life Unlimited
min: 31653     avg: 32089     median: 32089 (16%)     max: 32525 Points
3DMark - 3DMark Wild Life Extreme Unlimited
min: 8457     avg: 8673     median: 8673 (10%)     max: 8889 Points
14545 Points (17%)
Blender - Blender 3.3 Classroom METAL *
69 Seconds (7%)
GFXBench - GFXBench 5.0 4K Aztec Ruins High Tier Offscreen
min: 48.6     avg: 51.9     median: 51.9 (21%)     max: 55.1 fps
97.8 fps (40%)
GFXBench - GFXBench 5.0 Aztec Ruins High Tier Offscreen
min: 105.4     avg: 110     median: 110 (20%)     max: 114.5 fps
219.7 fps (40%)
GFXBench - GFXBench 5.0 Aztec Ruins Normal Tier Offscreen
min: 287.9     avg: 313.8     median: 313.8 (23%)     max: 339.7 fps
580 fps (43%)
GFXBench - GFXBench Car Chase Offscreen
min: 233.8     avg: 258.9     median: 258.9 (29%)     max: 283.9 fps
436 fps (49%)
GFXBench 3.1 - GFXBench Manhattan ES 3.1 Offscreen
min: 351     avg: 375.3     median: 375.3 (8%)     max: 399.5 fps
670 fps (14%)
GFXBench 3.0 - GFXBench 3.0 Manhattan Offscreen
min: 449.3     avg: 489.7     median: 489.7 (29%)     max: 530 fps
936 fps (55%)
GFXBench (DX / GLBenchmark) 2.7
GFXBench T-Rex HD Offscreen C24Z16 + Apple M4 10-core GPU
GFXBench (DX / GLBenchmark) 2.7 - GFXBench T-Rex HD Offscreen C24Z16
min: 706.3     avg: 732     median: 732.3 (6%)     max: 758.2 fps
GFXBench T-Rex HD Offscreen C24Z16 + Apple M3 Pro 18-Core GPU
1480 fps (12%)
Geekbench 6.2 - Geekbench 6.2 GPU OpenCL
50373 Points (15%)
Geekbench 6.2 - Geekbench 6.2 GPU Metal
53465 Points (34%)
78324 Points (50%)
Power Consumption - The Witcher 3 Power Consumption - external Monitor *
40 Watt (6%)
Power Consumption - Witcher 3 Power Consumption *
52.1 Watt (11%)
Power Consumption - GFXBench Aztec Ruins Normal Tier Offscreen Power Consumption 150cd *
17.6 Watt (7%)
Power Consumption - Witcher 3 ultra Power Efficiency
0.8 fps per Watt (74%)
Power Consumption - Witcher 3 ultra Power Efficiency - external Monitor
min: 1.075     avg: 1.1     median: 1.1 (89%)     max: 1.207 fps per Watt
Emissions Witcher 3 Fan Noise + Apple M3 Pro 18-Core GPU
Emissions - Witcher 3 Fan Noise
25.1 dB(A) (40%)

Average Benchmarks Apple M4 10-core GPU → 100% n=9

Average Benchmarks Apple M3 Pro 18-Core GPU → 181% n=9

- Range of benchmark values for this graphics card
- Average benchmark values for this graphics card
* Smaller numbers mean a higher performance
1 This benchmark is not used for the average calculation

Game Benchmarks

The following benchmarks stem from our benchmarks of review laptops. The performance depends on the used graphics memory, clock rate, processor, system settings, drivers, and operating systems. So the results don't have to be representative for all laptops with this GPU. For detailed information on the benchmark results, click on the fps number.

Total War Pharaoh

Total War Pharaoh

2023
low 1920x1080
M3 Pro 18-Core GPU:
212  fps
med. 1920x1080
M3 Pro 18-Core GPU:
140  fps
high 1920x1080
M3 Pro 18-Core GPU:
77  fps
ultra 1920x1080
M3 Pro 18-Core GPU:
58  fps
QHD 2560x1440
M3 Pro 18-Core GPU:
42  fps
Cyberpunk 2077 2.1 Phantom Liberty

Cyberpunk 2077 2.1 Phantom Liberty

2023
low 1920x1080
M3 Pro 18-Core GPU:
53  fps
med. 1920x1080
M3 Pro 18-Core GPU:
42.6  fps
high 1920x1080
M3 Pro 18-Core GPU:
35  fps
ultra 1920x1080
M3 Pro 18-Core GPU:
30.8  fps
high 1920x1080
M3 Pro 18-Core GPU:
53  fps
ultra 1920x1080
M3 Pro 18-Core GPU:
43  fps
high 1920x1080
M3 Pro 18-Core GPU:
30  fps
ultra 1920x1080
M3 Pro 18-Core GPU:
26  fps
QHD 2560x1440
M3 Pro 18-Core GPU:
17  fps
Diablo Immortal

Diablo Immortal

2022
ultra Ultra
100%
M4 10-Core GPU:
58.3 59.8 ~ 59 fps
Call of Duty Mobile

Call of Duty Mobile

2020
ultra
100%
M4 10-Core GPU:
78.2  fps
Genshin Impact

Genshin Impact

2020
low
100%
M4 10-Core GPU:
78.3 80.9 ~ 80 fps
med.
100%
M4 10-Core GPU:
78.2 79.8 ~ 79 fps
ultra
100%
M4 10-Core GPU:
76.5 97.3 ~ 87 fps
med. 1920x1080
M3 Pro 18-Core GPU:
87  fps
high 1920x1080
M3 Pro 18-Core GPU:
56  fps
ultra 1920x1080
M3 Pro 18-Core GPU:
41  fps
QHD 2560x1440
M3 Pro 18-Core GPU:
25  fps
med. 1920x1080
M3 Pro 18-Core GPU:
71  fps
high 1920x1080
M3 Pro 18-Core GPU:
65  fps
ultra 1920x1080
M3 Pro 18-Core GPU:
57  fps
QHD 2560x1440
M3 Pro 18-Core GPU:
37  fps
PUBG Mobile

PUBG Mobile

2018
low
100%
M4 10-Core GPU:
63.2 80.5 ~ 72 fps
high
100%
M4 10-Core GPU:
38.2 42.3 ~ 40 fps
ultra
100%
M4 10-Core GPU:
38.2 43.9 ~ 41 fps
ultra 1920x1080
M3 Pro 18-Core GPU:
43  fps
GTA V

GTA V

2015
med. 1366x768
M3 Pro 18-Core GPU:
90  fps
high 1920x1080
M3 Pro 18-Core GPU:
79  fps
ultra 1920x1080
M3 Pro 18-Core GPU:
52  fps
QHD 2560x1440
M3 Pro 18-Core GPU:
49  fps
Asphalt 8: Airborne

Asphalt 8: Airborne

2013
high
100%
M4 10-Core GPU:
85.8  fps
Asphalt 9: Legends

Asphalt 9: Legends

2013
high
100%
M4 10-Core GPU:
75  fps

Average Gaming Apple M4 10-core GPU → 100%

Average Gaming 30-70 fps → 100%

Apple M3 Pro 18-Core GPUlowmed.highultraQHD4K
Total War Pharaoh212140775842
Cyberpunk 2077 2.1 Phantom Liberty5342.63530.8
Baldur's Gate 35343
Star Wars Jedi Survivor302617
Total War: Three Kingdoms87564125
Shadow of the Tomb Raider71655737
The Witcher 343
GTA V90795249
< 30 fps
< 60 fps
< 120 fps
≥ 120 fps

1

1

1
3
1

4
3
1
7

2
3


Apple M4 10-core GPUlowmed.highultraQHD4K
Diablo Immortal59
Call of Duty Mobile78.2
Genshin Impact807987
PUBG Mobile724041
Asphalt 8: Airborne85.8
Asphalt 9: Legends75
< 30 fps
< 60 fps
< 120 fps
≥ 120 fps


2


1

1
2

2
2


For more games that might be playable and a list of all games and graphics cards visit our Gaming List

Add one or more devices and compare

In the following list you can select (and also search for) devices that should be added to the comparison. You can select more than one device.

restrict list:

show all (including archived), 2024, 2023
v1.28
log 29. 22:32:09

#0 checking url part for id 12502 +0s ... 0s

#1 checking url part for id 11638 +0s ... 0s

#2 redirected to Ajax server, took 1719693129 +0s ... 0s

#3 did not recreate cache, as it is less than 5 days old! Created at Fri, 28 Jun 2024 05:15:43 +0200 +0s ... 0s

#4 composed specs +0.052s ... 0.052s

#5 did output specs +0s ... 0.052s

#6 start showIntegratedCPUs +0s ... 0.052s

#7 getting avg benchmarks for device 12502 +0.019s ... 0.07s

#8 got single benchmarks 12502 +0.004s ... 0.075s

#9 getting avg benchmarks for device 11638 +0s ... 0.075s

#10 got single benchmarks 11638 +0.003s ... 0.078s

#11 got avg benchmarks for devices +0s ... 0.078s

#12 min, max, avg, median took s +0.011s ... 0.089s

#13 before gaming benchmark output +0s ... 0.089s

#14 Got 54 rows for game benchmarks. +0.005s ... 0.095s

#15 composed SQL query for gamebenchmarks +0s ... 0.095s

#16 got data and put it in $dataArray +0.001s ... 0.095s

#17 benchmarks composed for output. +0.005s ... 0.1s

#18 calculated avg scores. +0s ... 0.1s

#19 return log +0.002s ... 0.102s

Please share our article, every link counts!
> Expert Reviews and News on Laptops, Smartphones and Tech Innovations > Benchmarks / Tech > Graphics Card Comparison - Head 2 Head
Redaktion, 2017-09- 8 (Update: 2023-07- 1)