Notebookcheck Logo

Apple M3 Pro 14-Core GPU vs NVIDIA Quadro RTX 6000 (Laptop)

Apple M3 Pro 14-Core GPU

► remove from comparison Apple M3 Pro 14-Core GPU

The Apple M3 Pro 14-Core GPU is a self-designed graphics card in the Apple M3 Pro (with 11 CPU cores) and offers fourteen of the eighteen cores available on the chip. The graphics card uses a new architecture and now offers dynamic caching, mesh shading and ray tracing acceleration.

The GPU can access up to 24 GB LPDDR5-6400 unified memory via a 192-bit memory bus (max 150 GBit/s). Thanks to dynamic caching, the GPU only reserves as much memory as is required.

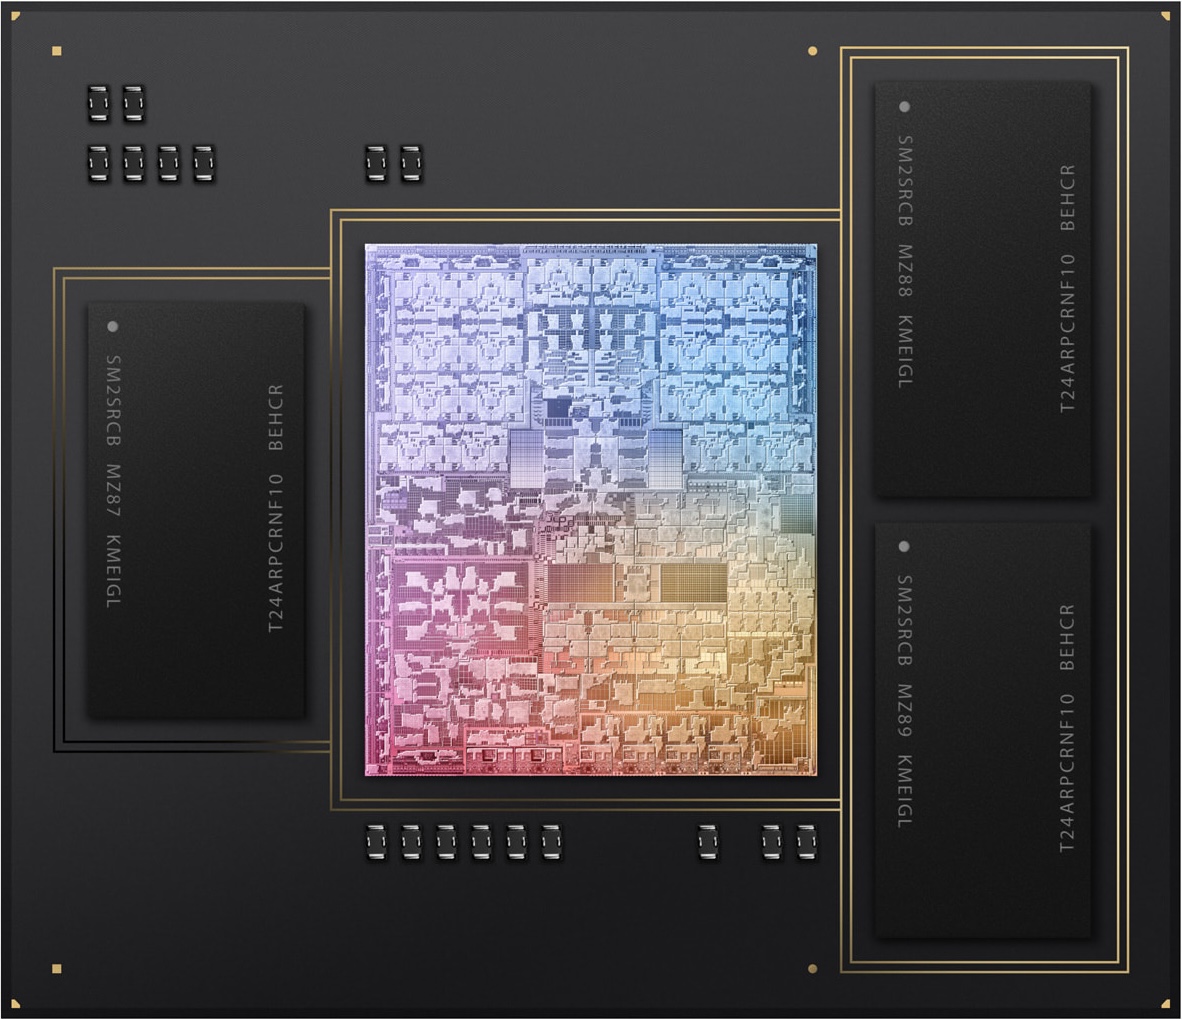
The entire chip is manufactured in the current 3nm process (probably N3B) at TSMC.

NVIDIA Quadro RTX 6000 (Laptop)

► remove from comparison NVIDIA Quadro RTX 6000 (Laptop)

The Nvidia Quadro RTX 6000 for laptops is a professional high-end graphics card for big and powerful laptops and mobile workstations. It is based on the same TU102 chip as the consumer GeForce RTX 2080 Ti. Compared to the desktop RTX 6000, the mobile variant offers lower clock speeds.

The Quadro GPUs offer certified drivers, which are optimized for stability and performance in professional applications (CAD, DCC, medical, prospection, and visualizing applications). The performance in these areas is therefore much better compared to corresponding consumer GPUs.

Features

NVIDIA manufacturers the TU102 chip on a 12 nm FinFET process and includes features like Deep Learning Super Sampling (DLSS) and Real-Time Ray Tracing (RTRT), which should combine to create more realistic lighting effects than older GPUs based on the company's Pascal architecture (if the games support it). The Quadro RTX 6000 is also DisplayPort 1.4 ready, while there is also support for HDMI 2.0b, HDR, Simultaneous Multi-Projection (SMP) and H.265 video en/decoding (PlayReady 3.0).

Performance

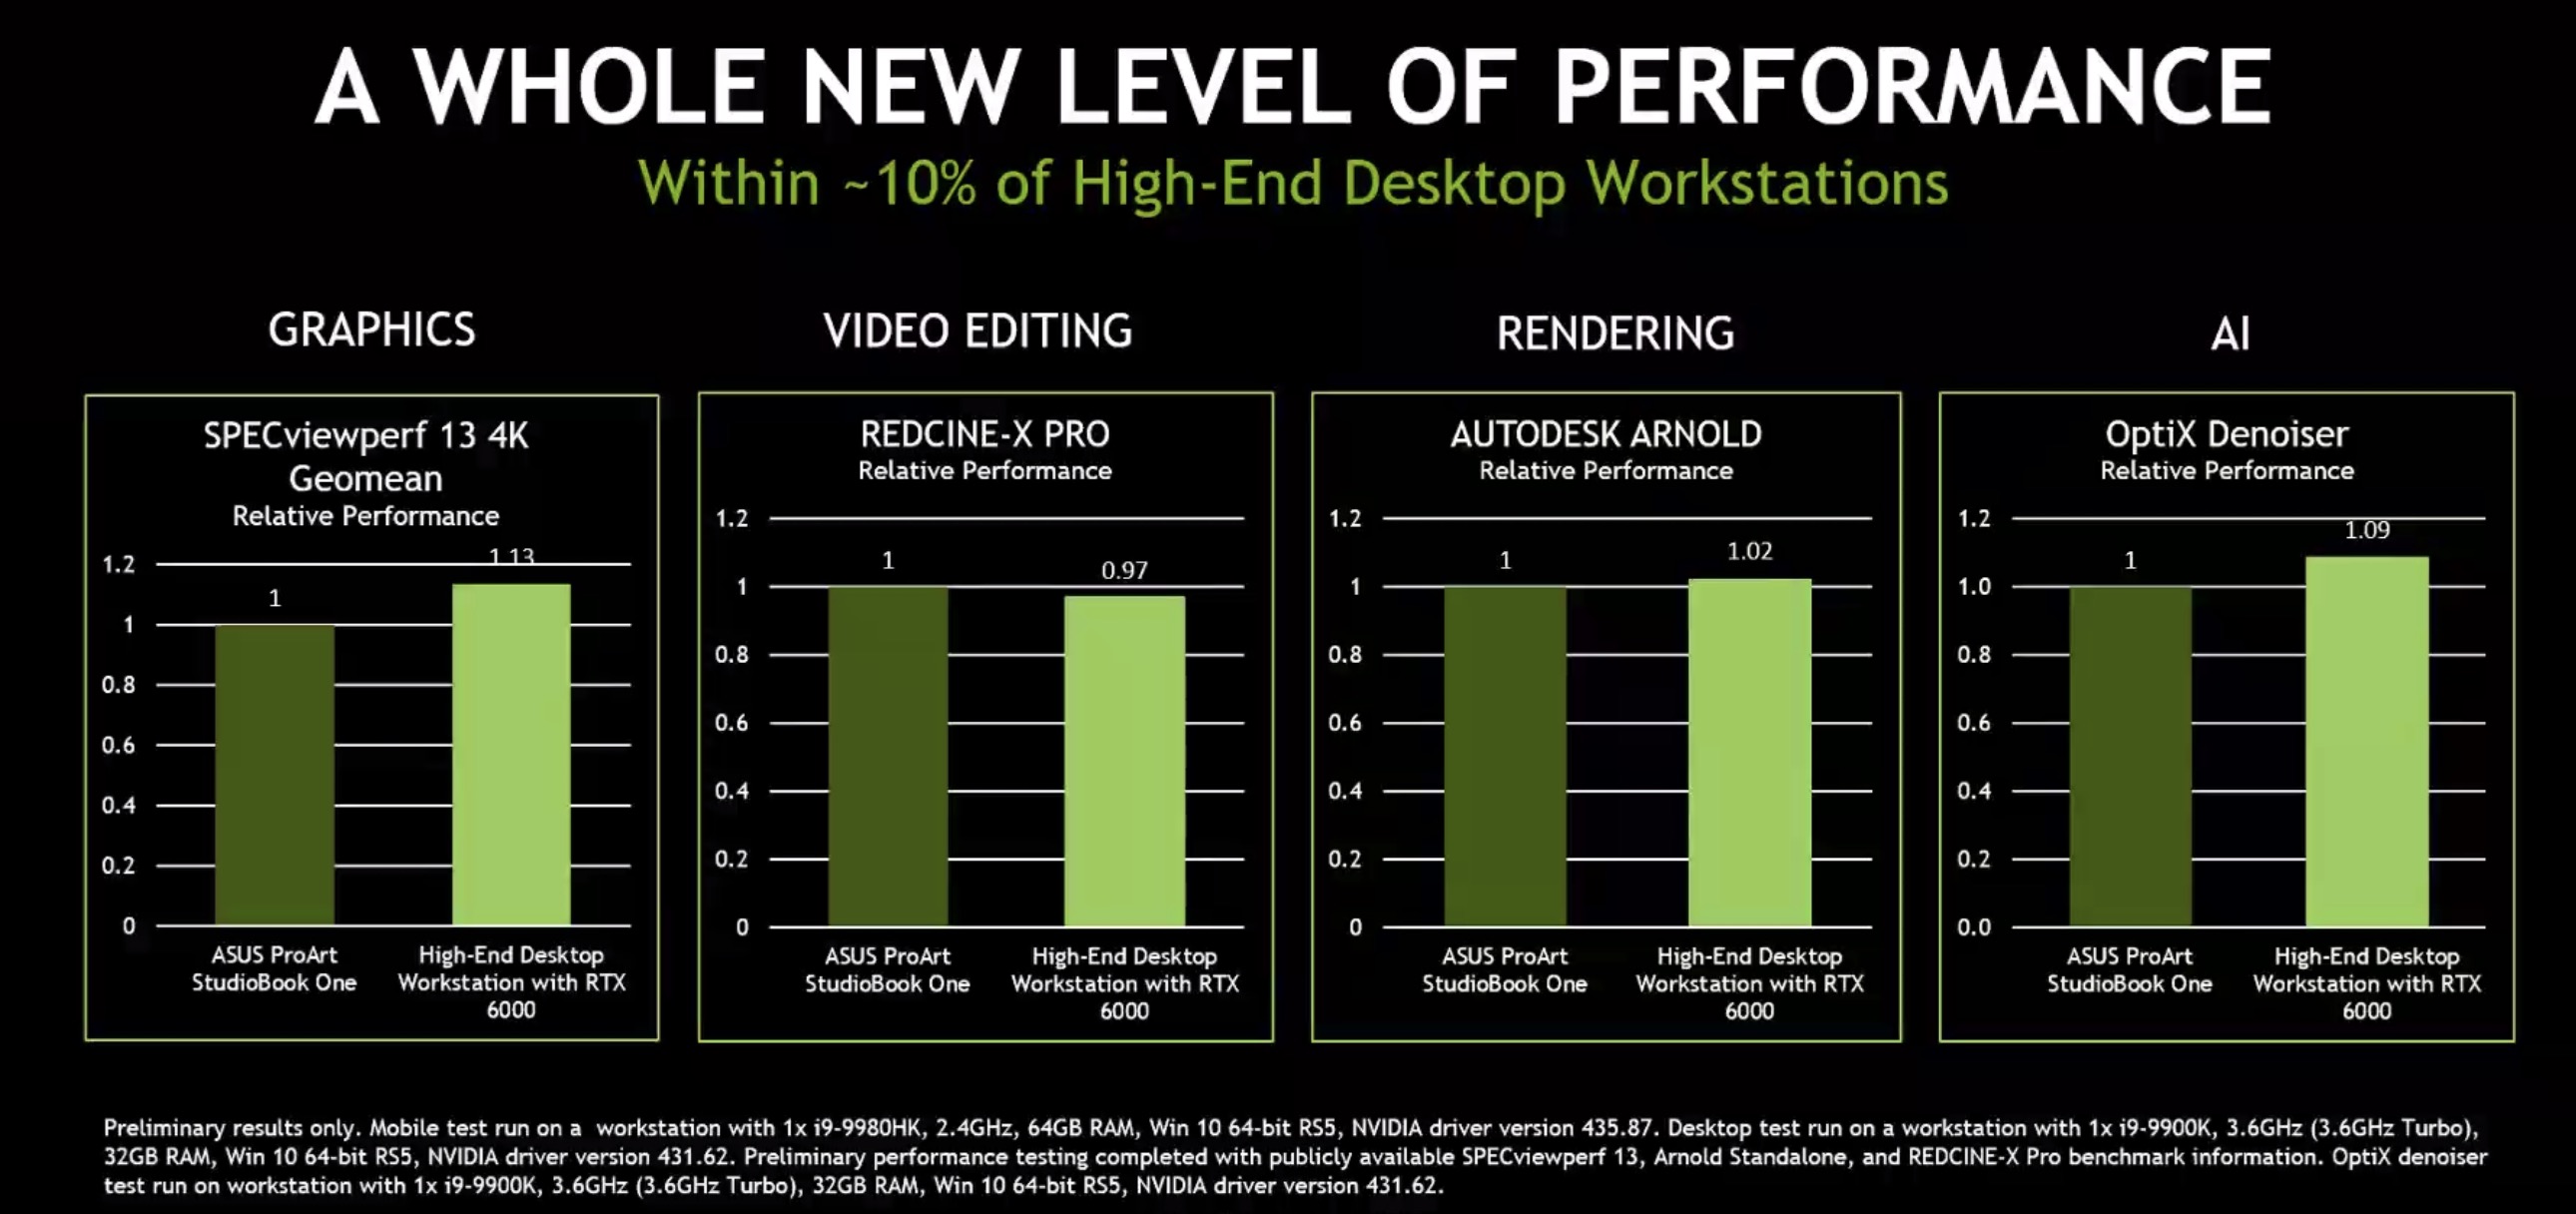
Due to the lower clock speeds, the mobile RTX 6000 lags slightly behind the desktop version with the same name. Nvidia states for example that a desktop system using the RTX 6000 is on average 13% faster in the SPECviewperf13 4k benchmark.

Due to the extremely high power consumption of 200 Watt (TDP), the mobile Quadro RTX 6000 needs an excellent cooling solution and will be used only in big laptops.

Apple M3 Pro 14-Core GPUNVIDIA Quadro RTX 6000 (Laptop)
Quadro Turing Series
M3 Max 40-Core GPU compare 40
M3 Max 30-Core GPU compare 30
M3 Pro 18-Core GPU compare 18
M3 Pro 14-Core GPU 14
M3 10-Core GPU compare 10
M3 8-Core GPU compare 8
Quadro RTX 6000 (Laptop) 4608 @ 1.28 - 1.46 GHz384 Bit @ 14000 MHz
Quadro RTX 5000 (Laptop) compare 3072 @ 1.04 - 1.55 GHz256 Bit @ 14000 MHz
Quadro RTX 5000 Max-Q compare 3072 @ 0.6 - 1.35 GHz256 Bit @ 14000 MHz
Quadro RTX 4000 (Laptop) compare 2560 @ 1.11 - 1.56 GHz256 Bit @ 14000 MHz
Quadro RTX 4000 Max-Q compare 2560 @ 0.78 - 1.38 GHz256 Bit @ 14000 MHz
Quadro RTX 3000 (Laptop) compare 1920 @ 0.95 - 1.38 GHz192 Bit @ 14000 MHz
Quadro RTX 3000 Max-Q compare 1920 @ 0.6 - 1.22 GHz192 Bit @ 14000 MHz
Quadro T2000 (Laptop) compare 1024 @ 1.58 - 1.79 GHz128 Bit @ 8000 MHz
Quadro T2000 Max-Q compare 1024 @ 0.93 - 1.5 GHz128 Bit @ 8000 MHz
T1200 Laptop GPU compare 1024 @ 0.86 - 1.43 GHz128 Bit @ 10000 MHz
Quadro T1000 (Laptop) compare 768 @ 1.4 - 1.46 GHz128 Bit @ 8000 MHz
Quadro T1000 Max-Q compare 768 @ 0.8 - 1.46 GHz128 Bit @ 8000 MHz
T600 Laptop GPU compare 896 @ 1.4 GHz128 Bit @ 10000 MHz
T550 Laptop GPU compare 1024 @ 1.07 - 1.67 GHz64 Bit @ 12000 MHz
T500 Laptop GPU compare 896 @ 1.37 - 1.7 GHz64 Bit @ 10000 MHz
T600 compare 640 @ 0.74 - 1.34 GHz128 Bit @ 10000 MHz
Pipelines14 - unified4608 - unified
Memory TypeLPDDR5-6400GDDR6
Shared Memorynono
technology5 nm12 nm
Notebook Sizemedium sizedlarge
Date of Announcement31.10.2023 04.09.2019
CodenameTU102
ArchitectureTuring
Core Speed1275 - 1455 (Boost) MHz
Memory Speed14000 MHz
Memory Bus Width384 Bit
Max. Amount of Memory24 GB
APIDirectX 12_1, OpenGL 4.6
Power Consumption200 Watt
Transistors18.6 Billion
FeaturesNVLink, DLSS, Raytraycing, VR Ready, G-SYNC, Vulkan, Multi Monitor
CPU in M3 Pro 14-Core GPUGPU Base SpeedGPU Boost / Turbo
Apple M3 Pro 11-Core11 x 2748 MHz, 27 W? MHz? MHz

Benchmarks

3DMark - 3DMark Time Spy Score
11084 Points (32%)
3DMark - 3DMark Wild Life Extreme Unlimited
12094 Points (14%)
Blender - Blender 3.3 Classroom METAL *
73 Seconds (8%)
SPECviewperf 13 specvp13 sw-04 + NVIDIA Quadro RTX 6000 (Laptop)
SPECviewperf 13 - specvp13 sw-04
217 fps (58%)
specvp13 3dsmax-06 + NVIDIA Quadro RTX 6000 (Laptop)
SPECviewperf 13 - specvp13 3dsmax-06
217 fps (38%)
Cinebench R15
Cinebench R15 OpenGL 64 Bit + Apple M3 Pro 14-Core GPU
Cinebench R15 - Cinebench R15 OpenGL 64 Bit
129.9 fps (8%)
Cinebench R15 OpenGL Ref. Match 64 Bit + Apple M3 Pro 14-Core GPU
Cinebench R15 - Cinebench R15 OpenGL Ref. Match 64 Bit
99.5 % (100%)
GFXBench - GFXBench 5.0 4K Aztec Ruins High Tier Offscreen
79 fps (32%)
GFXBench - GFXBench 5.0 Aztec Ruins High Tier Offscreen
178.7 fps (32%)
GFXBench - GFXBench 5.0 Aztec Ruins Normal Tier Offscreen
481.9 fps (36%)
GFXBench - GFXBench Car Chase Offscreen
376.3 fps (42%)
GFXBench 3.1 - GFXBench Manhattan ES 3.1 Offscreen
565 fps (12%)
GFXBench 3.0 - GFXBench 3.0 Manhattan Offscreen
818 fps (48%)
GFXBench (DX / GLBenchmark) 2.7
GFXBench T-Rex HD Offscreen C24Z16 + Apple M3 Pro 14-Core GPU
GFXBench (DX / GLBenchmark) 2.7 - GFXBench T-Rex HD Offscreen C24Z16
1299 fps (10%)
Geekbench 6.2 - Geekbench 6.2 GPU OpenCL
42798 Points (12%)
Geekbench 6.2 - Geekbench 6.2 GPU Metal
68043 Points (44%)
Power Consumption - The Witcher 3 Power Consumption - external Monitor *
32.8 Watt (5%)
Power Consumption - Witcher 3 Power Consumption *
42.8 Watt (9%)
Power Consumption - Witcher 3 ultra Power Efficiency
0.9 fps per Watt (82%)
Power Consumption - Witcher 3 ultra Power Efficiency - external Monitor
min: 1.189     avg: 1.2     median: 1.2 (99%)     max: 1.207 fps per Watt
Emissions Witcher 3 Fan Noise + Apple M3 Pro 14-Core GPU
Emissions - Witcher 3 Fan Noise
25.1 dB(A) (40%)

Average Benchmarks Apple M3 Pro 14-Core GPU → 0% n=

Average Benchmarks NVIDIA Quadro RTX 6000 (Laptop) → 0% n=

- Range of benchmark values for this graphics card
- Average benchmark values for this graphics card
* Smaller numbers mean a higher performance
1 This benchmark is not used for the average calculation

Game Benchmarks

The following benchmarks stem from our benchmarks of review laptops. The performance depends on the used graphics memory, clock rate, processor, system settings, drivers, and operating systems. So the results don't have to be representative for all laptops with this GPU. For detailed information on the benchmark results, click on the fps number.

low 1920x1080
100%
M3 Pro 14-Core GPU:
193  fps
med. 1920x1080
100%
M3 Pro 14-Core GPU:
125  fps
high 1920x1080
100%
M3 Pro 14-Core GPU:
67  fps
ultra 1920x1080
100%
M3 Pro 14-Core GPU:
53  fps
QHD 2560x1440
100%
M3 Pro 14-Core GPU:
35  fps
high 1920x1080
100%
M3 Pro 14-Core GPU:
42  fps
ultra 1920x1080
100%
M3 Pro 14-Core GPU:
39  fps
med. 1920x1080
100%
M3 Pro 14-Core GPU:
75  fps
high 1920x1080
100%
M3 Pro 14-Core GPU:
49.5  fps
ultra 1920x1080
100%
M3 Pro 14-Core GPU:
35.9  fps
QHD 2560x1440
100%
M3 Pro 14-Core GPU:
22.5  fps
med. 1920x1080
100%
M3 Pro 14-Core GPU:
66  fps
high 1920x1080
100%
M3 Pro 14-Core GPU:
60  fps
ultra 1920x1080
100%
M3 Pro 14-Core GPU:
53  fps
QHD 2560x1440
100%
M3 Pro 14-Core GPU:
34  fps
ultra 1920x1080
100%
M3 Pro 14-Core GPU:
39  fps
GTA V

GTA V

2015
high 1920x1080
100%
M3 Pro 14-Core GPU:
79  fps
ultra 1920x1080
100%
M3 Pro 14-Core GPU:
50  fps

Average Gaming Apple M3 Pro 14-Core GPU → 100%

Average Gaming 30-70 fps → 100%

Apple M3 Pro 14-Core GPUlowmed.highultraQHD4K
Total War Pharaoh193125675335
Baldur's Gate 34239
Total War: Three Kingdoms7549.535.922.5
Shadow of the Tomb Raider66605334
The Witcher 339
GTA V7950
< 30 fps
< 60 fps
< 120 fps
≥ 120 fps


1


2
1

2
3

6

1
2


For more games that might be playable and a list of all games and graphics cards visit our Gaming List

Add one or more devices and compare

In the following list you can select (and also search for) devices that should be added to the comparison. You can select more than one device.

restrict list:

show all (including archived), 2024, 2023
v1.28
log 04. 06:41:13

#0 checking url part for id 12032 +0s ... 0s

#1 checking url part for id 9923 +0s ... 0s

#2 redirected to Ajax server, took 1720068073 +0s ... 0s

#3 did not recreate cache, as it is less than 5 days old! Created at Thu, 04 Jul 2024 05:15:44 +0200 +0s ... 0s

#4 composed specs +0.028s ... 0.028s

#5 did output specs +0s ... 0.028s

#6 start showIntegratedCPUs +0s ... 0.028s

#7 getting avg benchmarks for device 12032 +0.019s ... 0.047s

#8 got single benchmarks 12032 +0.003s ... 0.05s

#9 getting avg benchmarks for device 9923 +0s ... 0.05s

#10 got single benchmarks 9923 +0.003s ... 0.053s

#11 got avg benchmarks for devices +0s ... 0.053s

#12 min, max, avg, median took s +0.009s ... 0.062s

#13 before gaming benchmark output +0s ... 0.062s

#14 Got 18 rows for game benchmarks. +0.002s ... 0.064s

#15 composed SQL query for gamebenchmarks +0s ... 0.064s

#16 got data and put it in $dataArray +0s ... 0.064s

#17 benchmarks composed for output. +0.002s ... 0.067s

#18 calculated avg scores. +0s ... 0.067s

#19 return log +0.002s ... 0.068s

Please share our article, every link counts!
> Expert Reviews and News on Laptops, Smartphones and Tech Innovations > Benchmarks / Tech > Graphics Card Comparison - Head 2 Head
Redaktion, 2017-09- 8 (Update: 2023-07- 1)