Apple M3 Max 40-Core GPU vs NVIDIA T600
Apple M3 Max 40-Core GPU ► remove from comparison
The Apple M3 Max 40-Core GPU is a self-designed graphics card in the Apple M3 SoC and according to Apple with forty cores. According to Apple, the GPU uses a new architecture and now offers dynamic caching, mesh shading and ray tracing acceleration.
The GPU can access up to 128 GB LPDDR5-6400 unified memory via a 512 bit memory bus (max 400 GBit/s). Thanks to dynamic caching, the GPU should only reserve as much memory as is required.
Since the SoC is manufactured in the current 3nm (probably N3B) at TSMC. According to powermetrics, the GPU requires up to 60 watts (chip incl. CPU total 78 watts).
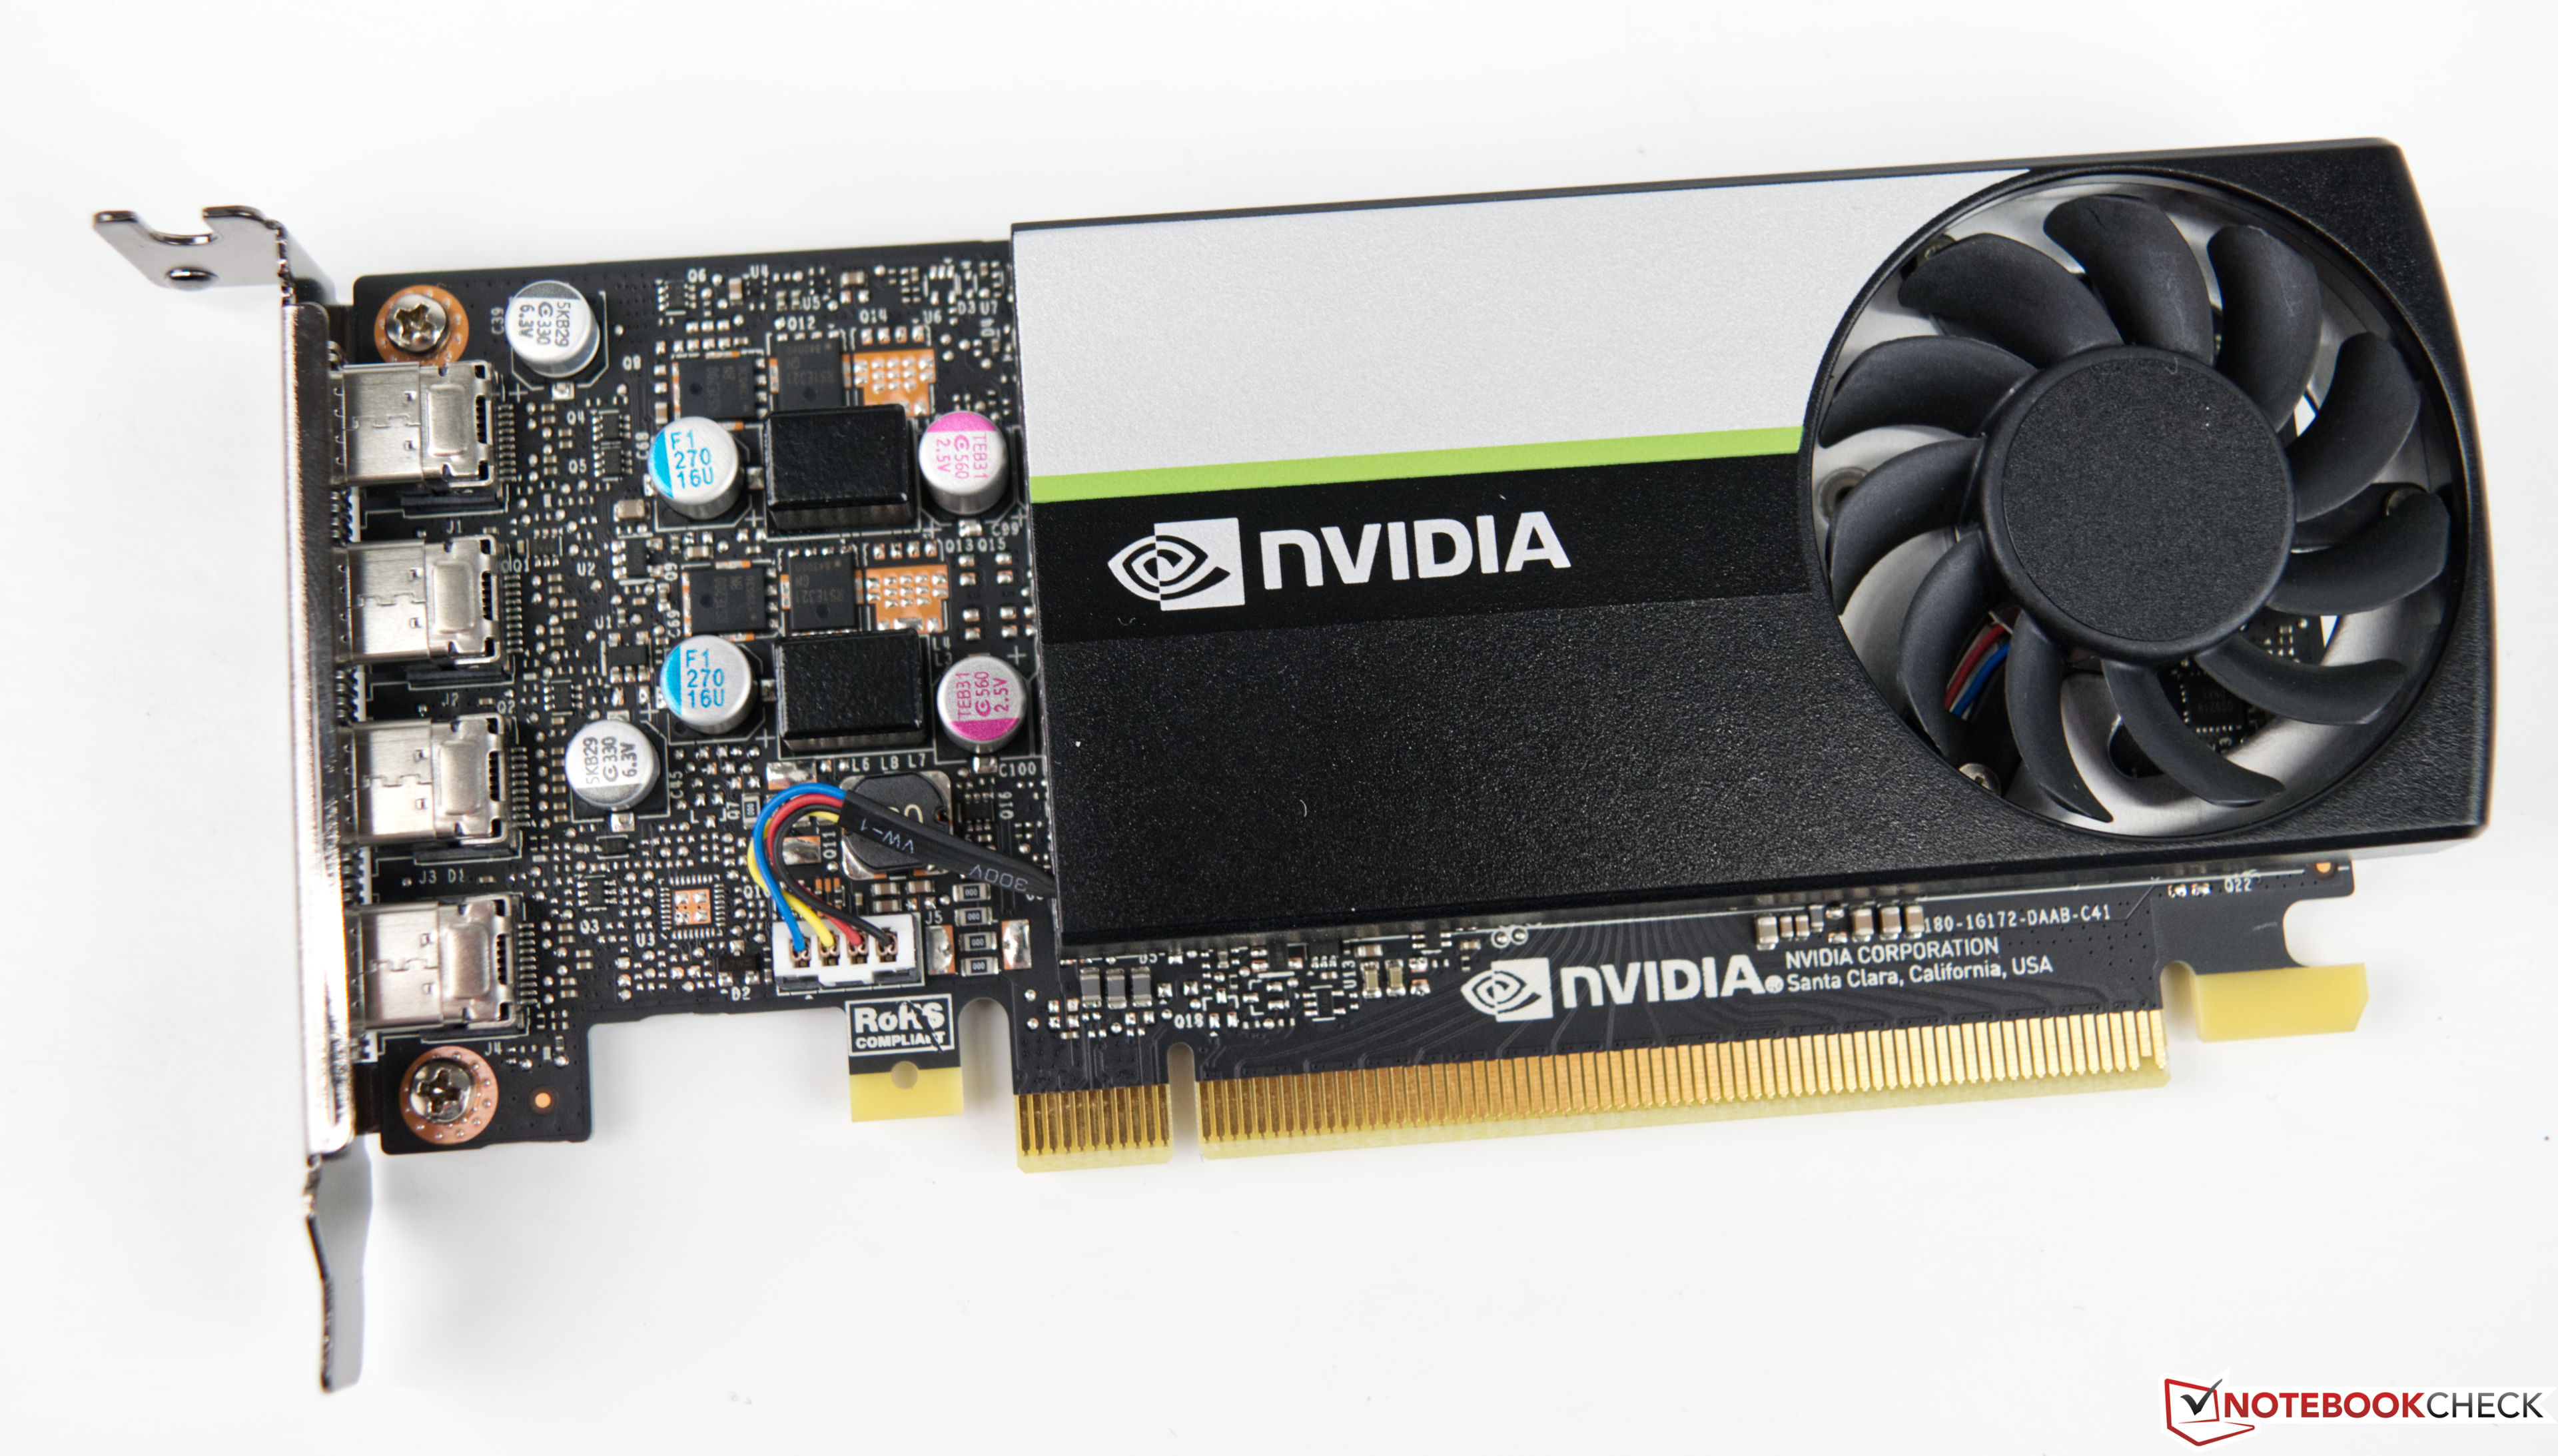
NVIDIA T600 ► remove from comparison
The Nvidia T600 Desktop GPU is a professional graphics card for workstations that is based on the Turing architecture (TU117 chip). The desktop version only offers 640 of the 1024 cores and therefore also less than the T600 mobile (896 CUDA cores). The card offers 4 GB GDDR6 graphics memory connected with a 128 bit bus (up to 160 GB/s bandwidth). The T600 supports certified drivers (former Quadro line) for professional applications like CAD, 3D modelling, DCC, medicine, or visualization applications.
The maximum power consumption of the card is rated at 40W.
Apple M3 Max 40-Core GPU NVIDIA T600 Quadro Turing Series Pipelines 40 - unified 640 - unified Memory Type LPDDR5-6400 GDDR6 Shared Memory no no Power Consumption 53 Watt 40 Watt technology 5 nm 12 nm Notebook Size medium sized Date of Announcement 31.10.2023 12.04.2021 Architecture Turing TMUs 40 ROPs 32 Core Speed 735 - 1335 (Boost) MHz Memory Speed 10000 effective = 1250 MHz Memory Bus Width 128 Bit Max. Amount of Memory 4 GB Memory Bandwidth 160 GB/s API DirectX 12_1, Shader 6.6, OpenGL 4.6, OpenCL 3.0, Vulkan 1.3 Transistors 4.7 Billion Die Size 200 mm² PCIe 3.0 x16 Displays 4 Displays (max.), DisplayPort 4x mini-DisplayPort 1.4a
CPU in M3 Max 40-Core GPU GPU Base Speed GPU Boost / Turbo Apple M3 Max 16-Core 16 x 2748 MHz, 78 W ? MHz ? MHz
Benchmarks Performance Rating - 3DMark 11 + Fire Strike + Time Spy - T600
3 pt (9%)
...
...
max:
3DMark - 3DMark Time Spy Score
2496 Points (7%)
3DMark - 3DMark Time Spy Graphics
2195 Points (6%)
3DMark - 3DMark Ice Storm Unlimited Graphics
304731 Points (35%)
3DMark - 3DMark Ice Storm Extreme Graphics
152912 Points (20%)
3DMark - 3DMark Cloud Gate Score
31922 Points (34%)
3DMark - 3DMark Cloud Gate Graphics
40917 Points (11%)
3DMark - 3DMark Fire Strike Standard Score
6284 Points (11%)
3DMark - 3DMark Fire Strike Standard Graphics
6552 Points (7%)
3DMark - 3DMark Ice Storm Graphics
182459 Points (22%)
3DMark - 3DMark Wild Life Extreme Unlimited
min: 31268 avg: 31336 median: 31335.5 (36%) max: 31403 Points
3DMark 11 - 3DM11 Performance Score
9497 Points (13%)
3DMark 11 - 3DM11 Performance GPU
8694 Points (7%)
3DMark Vantage + NVIDIA T600 3DMark Vantage - 3DM Vant. Perf. total
344838 Points (100%)
3DM Vant. Perf. GPU no PhysX + NVIDIA T600 3DMark Vantage - 3DM Vant. Perf. GPU no PhysX
30400 Points (17%)
3DMark 05 - 3DMark 05 - Standard
46380 Points (51%)
3DMark 06 3DMark 06 - Standard 1280x1024 + NVIDIA T600
43997 Points (57%)
Unigine Valley 1.0 - Unigine Valley 1.0 DX
32.7 fps (11%)
Blender - Blender 3.3 Classroom METAL *
min: 29.6 avg: 30.8 median: 30.8 (3%) max: 32 Seconds
SPECviewperf 12 + NVIDIA T600 SPECviewperf 12 - specvp12 sw-03
115 fps (29%)
specvp12 snx-02 + NVIDIA T600 SPECviewperf 12 - specvp12 snx-02
68.6 fps (10%)
specvp12 showcase-01 + NVIDIA T600 SPECviewperf 12 - specvp12 showcase-01
35.3 fps (8%)
specvp12 mediacal-01 + NVIDIA T600 SPECviewperf 12 - specvp12 mediacal-01
19.5 fps (5%)
specvp12 maya-04 + NVIDIA T600 SPECviewperf 12 - specvp12 maya-04
67.4 fps (18%)
specvp12 energy-01 + NVIDIA T600 SPECviewperf 12 - specvp12 energy-01
5 fps (4%)
specvp12 creo-01 + NVIDIA T600 SPECviewperf 12 - specvp12 creo-01
78.5 fps (31%)
specvp12 catia-04 + NVIDIA T600 SPECviewperf 12 - specvp12 catia-04
76.9 fps (13%)
specvp12 3dsmax-05 + NVIDIA T600 SPECviewperf 12 - specvp12 3dsmax-05
80 fps (14%)
SPECviewperf 13 specvp13 sw-04 + NVIDIA T600 SPECviewperf 13 - specvp13 sw-04
114 fps (31%)
specvp13 snx-03 + NVIDIA T600 SPECviewperf 13 - specvp13 snx-03
122 fps (14%)
specvp13 showcase-02 + NVIDIA T600 SPECviewperf 13 - specvp13 showcase-02
34.9 fps (8%)
specvp13 medical-02 + NVIDIA T600 SPECviewperf 13 - specvp13 medical-02
35.7 fps (7%)
specvp13 maya-05 + NVIDIA T600 SPECviewperf 13 - specvp13 maya-05
99.8 fps (11%)
specvp13 energy-02 + NVIDIA T600 SPECviewperf 13 - specvp13 energy-02
12.6 fps (4%)
specvp13 creo-02 + NVIDIA T600 SPECviewperf 13 - specvp13 creo-02
98 fps (14%)
specvp13 3dsmax-06 + NVIDIA T600 SPECviewperf 13 - specvp13 3dsmax-06
79.9 fps (14%)
SPECviewperf 2020 specvp2020 solidworks-05 4k + NVIDIA T600 SPECviewperf 2020 - specvp2020 solidworks-05 4k
16.9 fps (5%)
specvp2020 snx-04 4k + NVIDIA T600 SPECviewperf 2020 - specvp2020 snx-04 4k
75.6 fps (8%)
specvp2020 medical-03 4k + NVIDIA T600 SPECviewperf 2020 - specvp2020 medical-03 4k
4.5 fps (4%)
specvp2020 maya-06 4k + NVIDIA T600 SPECviewperf 2020 - specvp2020 maya-06 4k
46.1 fps (8%)
specvp2020 energy-03 4k + NVIDIA T600 SPECviewperf 2020 - specvp2020 energy-03 4k
6.7 fps (1%)
specvp2020 creo-03 4k + NVIDIA T600 SPECviewperf 2020 - specvp2020 creo-03 4k
32.3 fps (15%)
specvp2020 catia-06 4k + NVIDIA T600 SPECviewperf 2020 - specvp2020 catia-06 4k
13.8 fps (9%)
specvp2020 3dsmax-07 4k + NVIDIA T600 SPECviewperf 2020 - specvp2020 3dsmax-07 4k
19.4 fps (8%)
Cinebench R10 Cinebench R10 Shading (32bit) + NVIDIA T600 Cinebench R10 - Cinebench R10 Shading (32bit)
6830 Points (5%)
Cinebench R11.5 Cinebench R11.5 OpenGL 64 Bit + NVIDIA T600 Cinebench R11.5 - Cinebench R11.5 OpenGL 64 Bit
104.1 fps (36%)
Cinebench R15 + Apple M3 Max 40-Core GPU Cinebench R15 - Cinebench R15 OpenGL 64 Bit
min: 136.23 avg: 137.4 median: 137.4 (8%) max: 138.52 fps
Cinebench R15 OpenGL 64 Bit + NVIDIA T600
227.1 fps (13%)
GPU TDP ? TDP 60 W 100% 60%
Cinebench R15 OpenGL Ref. Match 64 Bit + Apple M3 Max 40-Core GPU Cinebench R15 - Cinebench R15 OpenGL Ref. Match 64 Bit
99.5 % (100%)
Cinebench R15 OpenGL Ref. Match 64 Bit + NVIDIA T600
99.6 % (100%)
GPU TDP ? TDP 60 W 100% 100%
GFXBench - GFXBench 5.0 4K Aztec Ruins High Tier Offscreen
min: 188.2 avg: 196 median: 196 (80%) max: 203.7 fps
GFXBench - GFXBench 5.0 Aztec Ruins High Tier Offscreen
min: 416 avg: 431 median: 431 (78%) max: 446 fps
GFXBench - GFXBench 5.0 Aztec Ruins Normal Tier Offscreen
min: 858 avg: 863 median: 863 (64%) max: 868 fps
GFXBench - GFXBench Car Chase Offscreen
min: 556 avg: 560 median: 560 (63%) max: 564 fps
GFXBench 3.1 - GFXBench Manhattan ES 3.1 Offscreen
min: 1163 avg: 1178 median: 1178 (25%) max: 1193 fps
GFXBench 3.0 - GFXBench 3.0 Manhattan Offscreen
min: 1557 avg: 1573 median: 1573 (92%) max: 1589 fps
GFXBench (DX / GLBenchmark) 2.7 + Apple M3 Max 40-Core GPU GFXBench (DX / GLBenchmark) 2.7 - GFXBench T-Rex HD Offscreen C24Z16
min: 2893 avg: 2942 median: 2941.5 (23%) max: 2990 fps
Geekbench 6.2 - Geekbench 6.2 GPU OpenCL
min: 91413 avg: 91416 median: 91415.5 (26%) max: 91418 Points
Geekbench 6.2 - Geekbench 6.2 GPU Metal
min: 154675 avg: 155214 median: 155214 (100%) max: 155752 Points
LuxMark v2.0 64Bit - LuxMark v2.0 Room GPU
1121 Samples/s (5%)
LuxMark v2.0 64Bit - LuxMark v2.0 Sala GPU
2049 Samples/s (4%)
ComputeMark v2.1 - ComputeMark v2.1 Result
4825 Points (5%)
Power Consumption - Furmark Stress Test Power Consumption - external Monitor *
76.7 Watt (11%)
Power Consumption - The Witcher 3 Power Consumption - external Monitor *
min: 87.7 avg: 91.6 median: 91.6 (13%) max: 95.4 Watt
83.5 Watt (12%)
GPU TDP ? TDP 60 W 101% 100%
Power Consumption - Witcher 3 Power Consumption *
min: 92.5 avg: 100.8 median: 100.8 (22%) max: 109 Watt
Power Consumption - Witcher 3 ultra Power Efficiency
min: 0.633 avg: 0.8 median: 0.8 (73%) max: 0.995 fps per Watt
Power Consumption - Witcher 3 ultra Power Efficiency - external Monitor
min: 0.723 avg: 0.9 median: 0.9 (73%) max: 1.207 fps per Watt
0.3 fps per Watt (27%)
GPU TDP ? TDP 60 W 37% 100%
Emissions Witcher 3 Fan Noise + Apple M3 Max 40-Core GPU Emissions - Witcher 3 Fan Noise
min: 42.8 avg: 43.1 median: 43.1 (69%) max: 43.4 dB(A)
Average Benchmarks Apple M3 Max 40-Core GPU → 100% n=2 Average Benchmarks NVIDIA T600 → 133% n=2
- Range of benchmark values for this graphics card
- Average benchmark values for this graphics card
* Smaller numbers mean a higher performance
1 This benchmark is not used for the average calculation
Game Benchmarks The following benchmarks stem from our benchmarks of review laptops. The performance depends on the used graphics memory, clock rate, processor, system settings, drivers, and operating systems. So the results don't have to be representative for all laptops with this GPU. For detailed information on the benchmark results, click on the fps number.
100%
M3 Max 40-Core GPU:
242 fps
100%
M3 Max 40-Core GPU:
207 212 ~ 210 fps
100%
M3 Max 40-Core GPU:
138 139 ~ 139 fps
100%
M3 Max 40-Core GPU:
97 121 ~ 109 fps
100%
M3 Max 40-Core GPU:
82 82 ~ 82 fps
100%
M3 Max 40-Core GPU:
45 fps
100%
M3 Max 40-Core GPU:
44 fps
100%
M3 Max 40-Core GPU:
43.7 44.4 ~ 44 fps
100%
M3 Max 40-Core GPU:
40.8 42.8 ~ 42 fps
100%
M3 Max 40-Core GPU:
35.5 37.4 ~ 36 fps
100%
M3 Max 40-Core GPU:
96 fps
100%
M3 Max 40-Core GPU:
90 fps
100%
M3 Max 40-Core GPU:
60 fps
100%
M3 Max 40-Core GPU:
51 fps
100%
M3 Max 40-Core GPU:
170 170 ~ 170 fps
100%
M3 Max 40-Core GPU:
109 113 ~ 111 fps
100%
M3 Max 40-Core GPU:
80 84 ~ 82 fps
100%
M3 Max 40-Core GPU:
54 58 ~ 56 fps
100%
M3 Max 40-Core GPU:
145 150 ~ 148 fps
100%
M3 Max 40-Core GPU:
135 143 ~ 139 fps
100%
M3 Max 40-Core GPU:
118 122 ~ 120 fps
100%
M3 Max 40-Core GPU:
86 88 ~ 87 fps
100%
M3 Max 40-Core GPU:
56 fps
100%
M3 Max 40-Core GPU:
53 54 ~ 54 fps
100%
M3 Max 40-Core GPU:
50 51 ~ 51 fps
100%
M3 Max 40-Core GPU:
49 49 ~ 49 fps
100%
M3 Max 40-Core GPU:
87 fps
100%
M3 Max 40-Core GPU:
69 92 ~ 81 fps
100%
M3 Max 40-Core GPU:
77 79 ~ 78 fps
100%
M3 Max 40-Core GPU:
53 54 ~ 54 fps
100%
M3 Max 40-Core GPU:
51 52 ~ 52 fps
Average Gaming Apple M3 Max 40-Core GPU → 100% Average Gaming 30-70 fps → 100%
Average Gaming NVIDIA T600 → 67% Average Gaming 30-70 fps → 72%
Apple M3 Max 40-Core GPU low med. high ultra QHD 4K Total War Pharaoh 242 210 139 109 82 Cyberpunk 2077 2.1 Phantom Liberty 45 44 44 42 36 Baldur's Gate 3 96 90 60 Star Wars Jedi Survivor 51 Total War: Three Kingdoms 170 111 82 56 Shadow of the Tomb Raider 148 139 120 87 Far Cry 5 56 54 51 49 The Witcher 3 87 81 GTA V 78 54 52 < 30 fps < 60 fps < 120 fps ≥ 120 fps 1 1 2 3 2 4 2 4 4 1 4 3
NVIDIA T600 low med. high ultra QHD 4K Far Cry 6 93.5 44.6 21.3 6.33 F1 2021 171.9 78.8 63.7 40.2 29.1 15.7 F1 2020 150.4 73.1 55.5 38.6 27 14.5 Borderlands 3 107.6 42 26.7 19.9 13.4 5.54 Metro Exodus 74.6 34 24 19.4 14.8 8.47 Strange Brigade 174.4 64.9 51.4 44.8 31.9 17.9 Far Cry 5 95 46 42 39 26 12 X-Plane 11.11 132.8 107 95.9 40.8 Final Fantasy XV Benchmark 70.7 34.9 25.1 17.8 9.98 Dota 2 Reborn 162.8 148.6 120.7 110.5 39.6 The Witcher 3 139.1 82.8 47.5 27.2 16.1 GTA V 181.5 175.6 80.3 38.2 26.6 25 < 30 fps < 60 fps < 120 fps ≥ 120 fps 5 7 5 5 2 4 4 3 1 4 5 1 7 1 9 2
For more games that might be playable and a list of all games and graphics cards visit our Gaming List
v1.28
log 04. 06:00:10
#0 checking url part for id 11636 +0s ... 0s
#1 checking url part for id 11373 +0s ... 0s
#2 redirected to Ajax server, took 1720065609 +0s ... 0s
#3 did not recreate cache, as it is less than 5 days old! Created at Thu, 04 Jul 2024 05:15:44 +0200 +0s ... 0s
#4 composed specs +0.035s ... 0.035s
#5 did output specs +0s ... 0.035s
#6 start showIntegratedCPUs +0s ... 0.035s
#7 getting avg benchmarks for device 11636 +0.022s ... 0.057s
#8 got single benchmarks 11636 +0.005s ... 0.062s
#9 getting avg benchmarks for device 11373 +0.006s ... 0.068s
#10 got single benchmarks 11373 +0.004s ... 0.072s
#11 got avg benchmarks for devices +0s ... 0.072s
#12 min, max, avg, median took s +0.031s ... 0.103s
#13 before gaming benchmark output +0s ... 0.103s
#14 Got 118 rows for game benchmarks. +0.008s ... 0.111s
#15 composed SQL query for gamebenchmarks +0s ... 0.111s
#16 got data and put it in $dataArray +0.001s ... 0.112s
#17 benchmarks composed for output. +0.007s ... 0.119s
#18 calculated avg scores. +0s ... 0.119s
#19 return log +0.03s ... 0.149s
Please share our article, every link counts!
Redaktion, 2017-09- 8 (Update: 2023-07- 1)
 Deutsch
 English
 Español
 Français
 Italiano
 Nederlands
 Polski
 Português
 Русский
 Türkçe
 Svenska
 Chinese
 Magyar