Apple M3 Max 40-Core GPU vs Apple M1 8-Core GPU
Apple M3 Max 40-Core GPU ► remove from comparison
The Apple M3 Max 40-Core GPU is a self-designed graphics card in the Apple M3 SoC and according to Apple with forty cores. According to Apple, the GPU uses a new architecture and now offers dynamic caching, mesh shading and ray tracing acceleration.
The GPU can access up to 128 GB LPDDR5-6400 unified memory via a 512 bit memory bus (max 400 GBit/s). Thanks to dynamic caching, the GPU should only reserve as much memory as is required.
Since the SoC is manufactured in the current 3nm (probably N3B) at TSMC. According to powermetrics, the GPU requires up to 60 watts (chip incl. CPU total 78 watts).
Apple M1 8-Core GPU ► remove from comparison
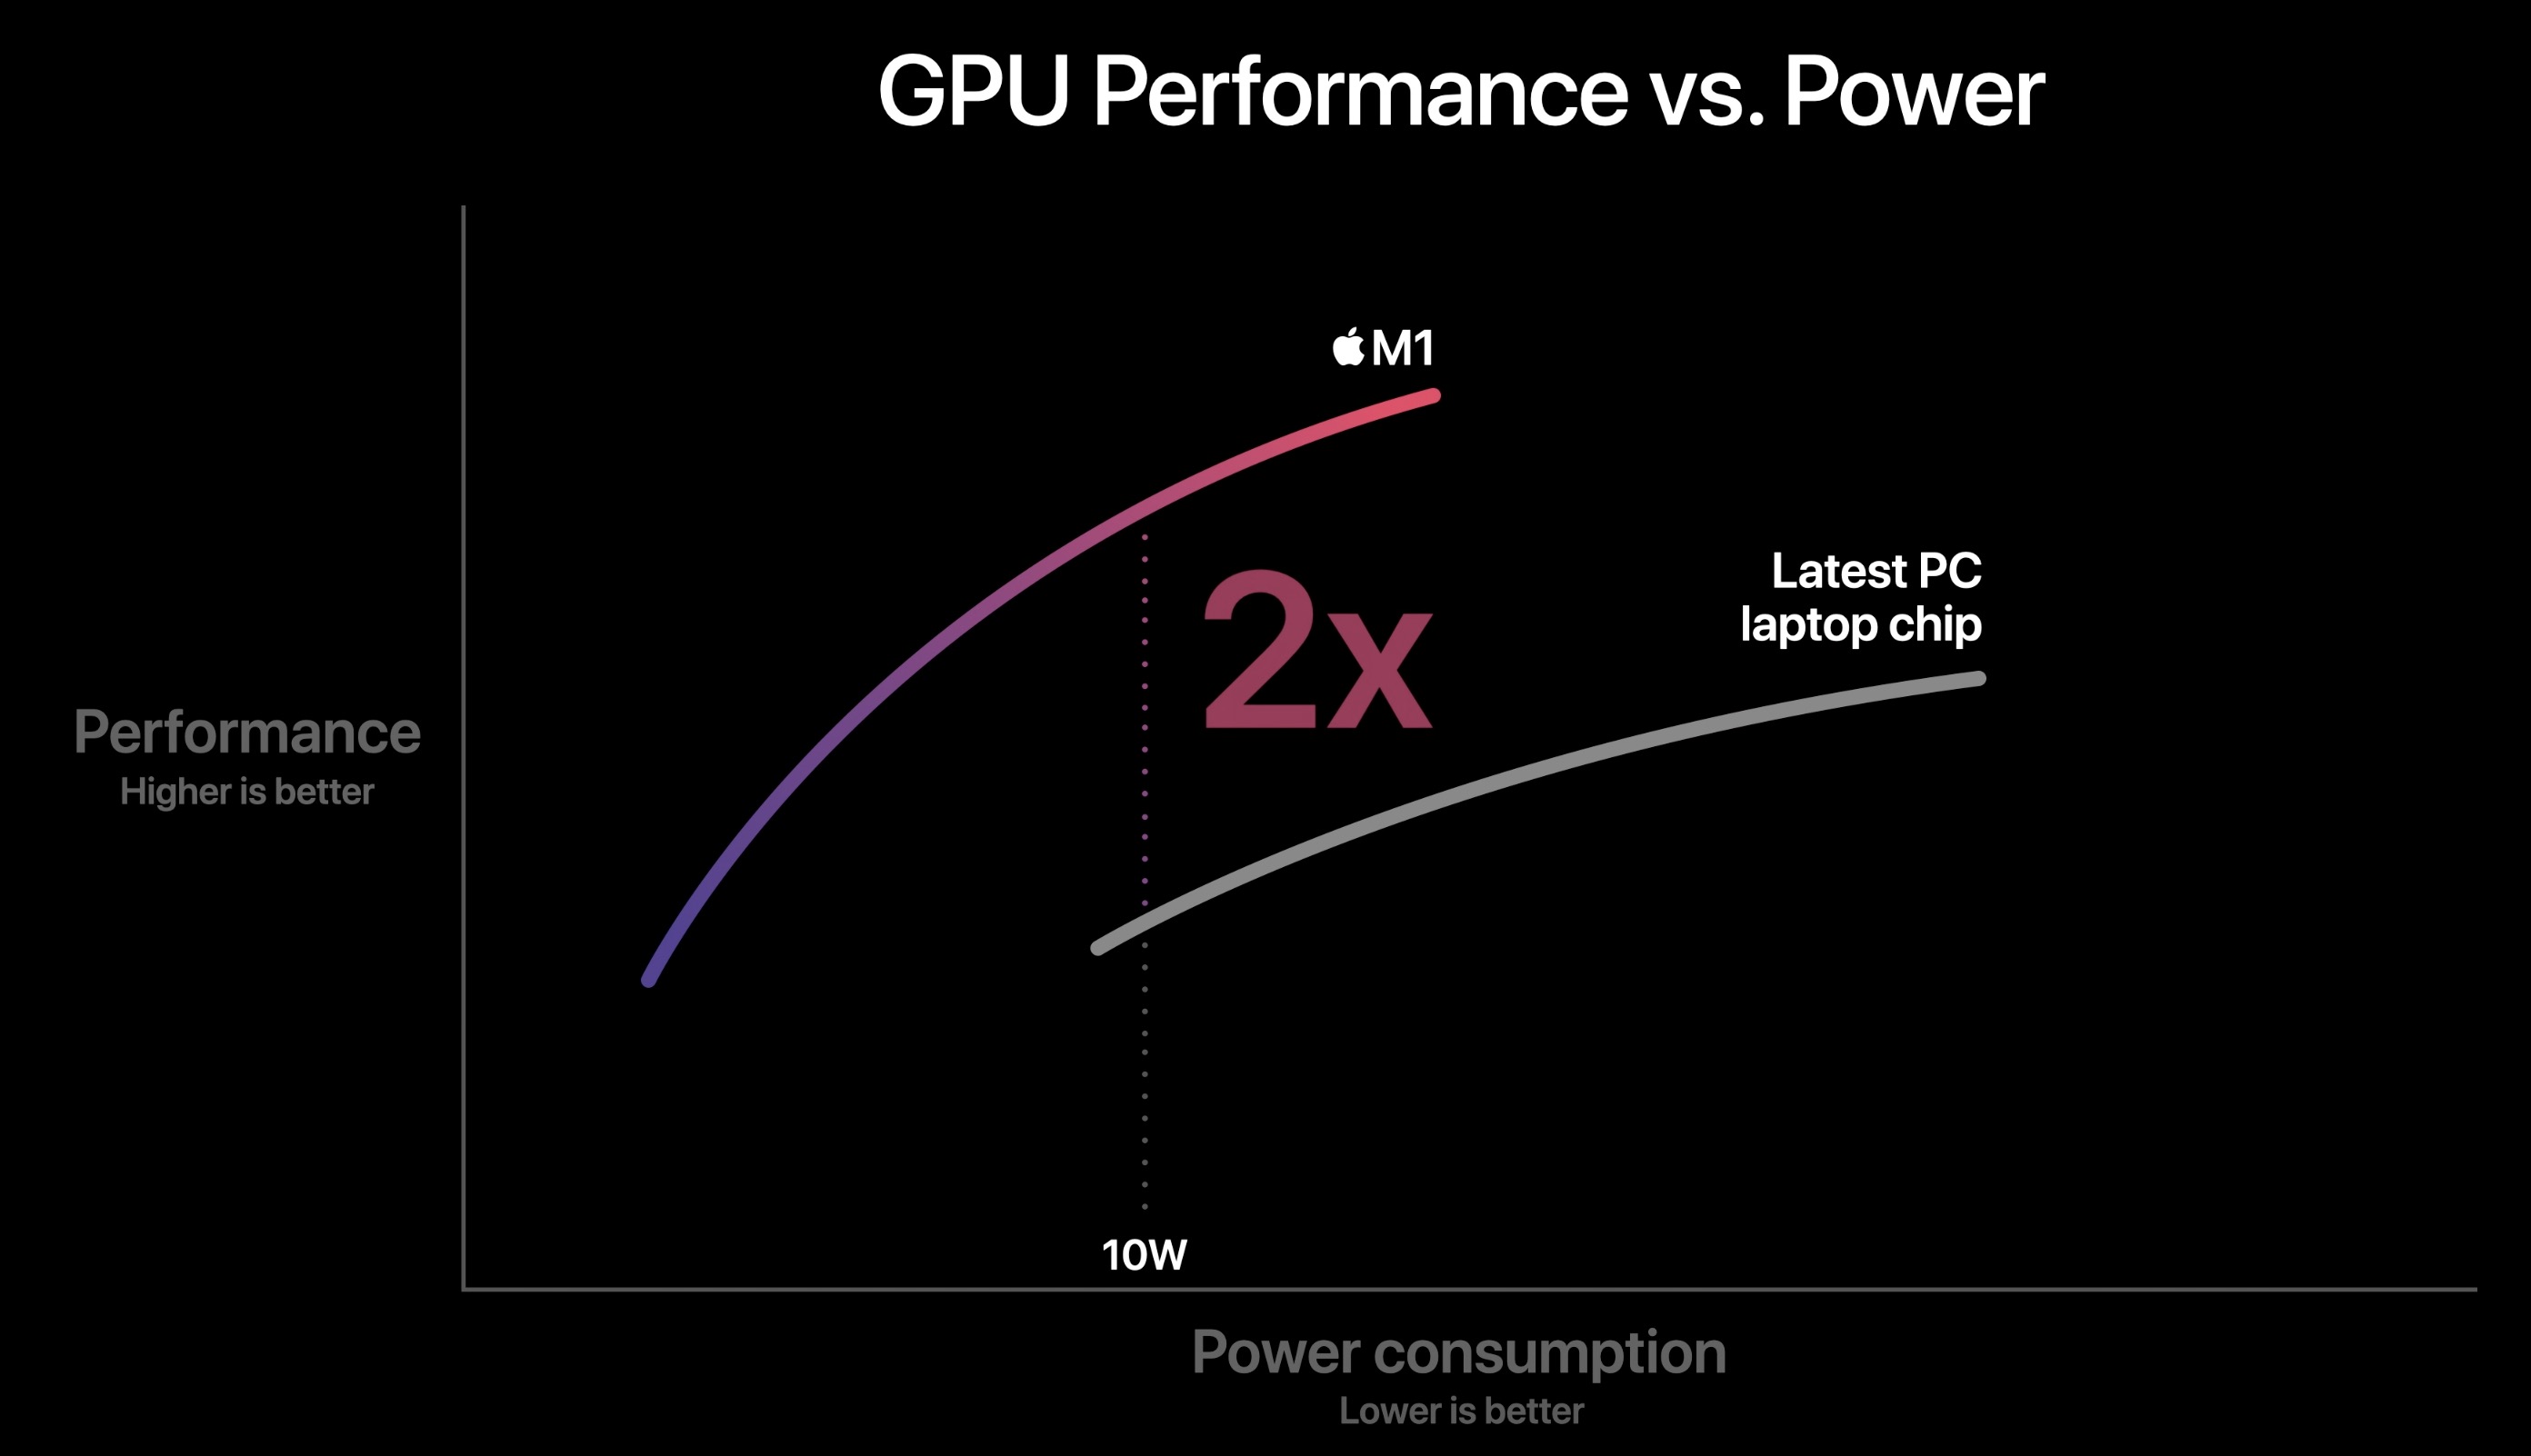
The Apple M1 GPU is an integrated graphics card offering 8 cores (1 deactivated core in the entry MacBook Air) designed by Apple and integrated in the Apple M1 SoC . According to Apple it is faster and more energy efficient as competing products (like the Tiger Lake Xe GPU ). The peak performance of the high end variant is 2.6 teraflops and thanks to the unified memory architecture it should have fast access to the RAM.
The Apple M1 is manufactured in the modern 5nm process at TSMC and should offer an excellent energy efficiency. According to internal tools, the M1 GPU uses under load approximately 10 Watt (11.5 Watt package power including the RAM).
Apple M3 Max 40-Core GPU Apple M1 8-Core GPU Apple M1 Series Pipelines 40 - unified 8 - unified Memory Type LPDDR5-6400 LPDDR4X-4266 Shared Memory no no Power Consumption 53 Watt 10 Watt technology 5 nm 5 nm Notebook Size medium sized Date of Announcement 31.10.2023 10.11.2020 Core Speed 1278 MHz Theoretical Performance 2.6 TFLOPS FP32
CPU in M3 Max 40-Core GPU GPU Base Speed GPU Boost / Turbo Apple M3 Max 16-Core 16 x 2748 MHz, 78 W ? MHz ? MHz
CPU in M1 8-Core GPU GPU Base Speed GPU Boost / Turbo Apple M1 8 x 2064 MHz ? MHz ? MHz
Benchmarks 3DMark - 3DMark Ice Storm Unlimited Graphics
280200 Points (32%)
Model CPU GPU RAM Value Apple Mac Mini Late 2020 (M1, 16GB) M1 M1 8-Core GPU 16 GB 280200
3DMark - 3DMark Sling Shot (ES 3.0) Unlimited
min: 7588 avg: 10635 median: 10635 (46%) max: 13682 Points
3DMark - 3DMark Sling Shot (ES 3.0) Unlimited Graphics
min: 35978 avg: 39365 median: 39364.5 (87%) max: 42751 Points
3DMark - 3DMark Sling Shot Extreme (ES 3.1) Unlimited
min: 8911 avg: 9606 median: 9605.5 (48%) max: 10300 Points
3DMark - 3DMark Sling Shot Extreme (ES 3.1) Unlimited Graphics
25707 Points (77%)
3DMark - 3DMark Wild Life Unlimited
min: 17731 avg: 18099 median: 18177 (9%) max: 18326 Points
3DMark - 3DMark Wild Life Extreme Unlimited
min: 31268 avg: 31336 median: 31335.5 (36%) max: 31403 Points
min: 4144 avg: 4696 median: 4821 (6%) max: 4997 Points
GPU TDP ? TDP 60 W 15% 100%
Blender - Blender 3.3 Classroom METAL *
min: 29.6 avg: 30.8 median: 30.8 (3%) max: 32 Seconds
Cinebench R15 + Apple M3 Max 40-Core GPU Cinebench R15 - Cinebench R15 OpenGL 64 Bit
min: 136.23 avg: 137.4 median: 137.4 (8%) max: 138.52 fps
Cinebench R15 OpenGL 64 Bit + Apple M1 8-Core GPU
min: 88.1 avg: 89.1 median: 89.4 (5%) max: 89.8 fps
GPU TDP ? TDP 60 W 65% 100%
Cinebench R15 OpenGL Ref. Match 64 Bit + Apple M3 Max 40-Core GPU Cinebench R15 - Cinebench R15 OpenGL Ref. Match 64 Bit
99.5 % (100%)
Cinebench R15 OpenGL Ref. Match 64 Bit + Apple M1 8-Core GPU
99.5 % (100%)
GPU TDP ? TDP 60 W 100% 100%
GFXBench - GFXBench 5.0 4K Aztec Ruins High Tier Offscreen
min: 188.2 avg: 196 median: 196 (80%) max: 203.7 fps
GFXBench - GFXBench 5.0 Aztec Ruins High Tier Offscreen
min: 416 avg: 431 median: 431 (78%) max: 446 fps
min: 60.9 avg: 74.3 median: 78.1 (14%) max: 81.7 fps
GPU TDP ? TDP 60 W 17% 100%
GFXBench - GFXBench 5.0 Aztec Ruins Normal Tier Offscreen
min: 858 avg: 863 median: 863 (64%) max: 868 fps
min: 149 avg: 196.9 median: 206 (15%) max: 216.1 fps
GPU TDP ? TDP 60 W 23% 100%
GFXBench - GFXBench Car Chase Offscreen
min: 556 avg: 560 median: 560 (63%) max: 564 fps
min: 150 avg: 167.4 median: 165.1 (19%) max: 197 fps
GPU TDP ? TDP 60 W 30% 100%
GFXBench 3.1 - GFXBench Manhattan ES 3.1 Offscreen
min: 1163 avg: 1178 median: 1178 (25%) max: 1193 fps
min: 216 avg: 248.2 median: 248.7 (5%) max: 275 fps
GPU TDP ? TDP 60 W 21% 100%
GFXBench 3.0 - GFXBench 3.0 Manhattan Offscreen
min: 1557 avg: 1573 median: 1573 (92%) max: 1589 fps
min: 317 avg: 358.5 median: 345 (20%) max: 408 fps
GPU TDP ? TDP 60 W 23% 100%
GFXBench (DX / GLBenchmark) 2.7 + Apple M3 Max 40-Core GPU GFXBench (DX / GLBenchmark) 2.7 - GFXBench T-Rex HD Offscreen C24Z16
min: 2893 avg: 2942 median: 2941.5 (23%) max: 2990 fps
GFXBench T-Rex HD Offscreen C24Z16 + Apple M1 8-Core GPU
min: 557 avg: 610 median: 588 (5%) max: 670 fps
GPU TDP ? TDP 60 W 21% 100%
Antutu v9 - AnTuTu v9 GPU
min: 549301 avg: 598951 median: 598951 (75%) max: 648601 Points
Geekbench 6.2 - Geekbench 6.2 GPU OpenCL
min: 91413 avg: 91416 median: 91415.5 (26%) max: 91418 Points
Geekbench 6.2 - Geekbench 6.2 GPU Metal
min: 154675 avg: 155214 median: 155214 (100%) max: 155752 Points
Power Consumption - The Witcher 3 Power Consumption - external Monitor *
min: 87.7 avg: 91.6 median: 91.6 (13%) max: 95.4 Watt
Power Consumption - Witcher 3 Power Consumption *
min: 92.5 avg: 100.8 median: 100.8 (22%) max: 109 Watt
min: 19.6 avg: 39.4 median: 39.4 (9%) max: 59.2 Watt
GPU TDP ? TDP 60 W 117% 100%
Power Consumption - GFXBench Aztec Ruins Normal Tier Offscreen Power Consumption 150cd *
min: 16 avg: 16.4 median: 16.5 (6%) max: 16.6 Watt
Power Consumption - Witcher 3 ultra Power Efficiency
min: 0.633 avg: 0.8 median: 0.8 (73%) max: 0.995 fps per Watt
Power Consumption - Witcher 3 ultra Power Efficiency - external Monitor
min: 0.723 avg: 0.9 median: 0.9 (73%) max: 1.207 fps per Watt
Emissions Witcher 3 Fan Noise + Apple M3 Max 40-Core GPU Emissions - Witcher 3 Fan Noise
min: 42.8 avg: 43.1 median: 43.1 (69%) max: 43.4 dB(A)
Average Benchmarks Apple M3 Max 40-Core GPU → 100% n=9 Average Benchmarks Apple M1 8-Core GPU → 35% n=9
- Range of benchmark values for this graphics card
- Average benchmark values for this graphics card
* Smaller numbers mean a higher performance
1 This benchmark is not used for the average calculation
Game Benchmarks The following benchmarks stem from our benchmarks of review laptops. The performance depends on the used graphics memory, clock rate, processor, system settings, drivers, and operating systems. So the results don't have to be representative for all laptops with this GPU. For detailed information on the benchmark results, click on the fps number.
100%
M3 Max 40-Core GPU:
242 fps
100%
M3 Max 40-Core GPU:
207 212 ~ 210 fps
100%
M3 Max 40-Core GPU:
138 139 ~ 139 fps
100%
M3 Max 40-Core GPU:
97 121 ~ 109 fps
100%
M3 Max 40-Core GPU:
82 82 ~ 82 fps
100%
M3 Max 40-Core GPU:
45 fps
100%
M3 Max 40-Core GPU:
44 fps
100%
M3 Max 40-Core GPU:
43.7 44.4 ~ 44 fps
100%
M3 Max 40-Core GPU:
40.8 42.8 ~ 42 fps
100%
M3 Max 40-Core GPU:
35.5 37.4 ~ 36 fps
100%
M3 Max 40-Core GPU:
96 fps
100%
M3 Max 40-Core GPU:
90 fps
100%
M3 Max 40-Core GPU:
60 fps
100%
M3 Max 40-Core GPU:
51 fps
M1 8-Core GPU:
59 60 ~ 60 fps
M1 8-Core GPU:
59 60 60 ~ 60 fps
M1 8-Core GPU:
59 60 ~ 60 fps
M1 8-Core GPU:
59 60 ~ 60 fps
100%
M3 Max 40-Core GPU:
170 170 ~ 170 fps
100%
M3 Max 40-Core GPU:
109 113 ~ 111 fps
100%
M3 Max 40-Core GPU:
80 84 ~ 82 fps
18%
M1 8-Core GPU:
15 15 ~ 15 fps
100%
M3 Max 40-Core GPU:
54 58 ~ 56 fps
M1 8-Core GPU:
64 66 78 ~ 69 fps
100%
M3 Max 40-Core GPU:
145 150 ~ 148 fps
22%
M1 8-Core GPU:
25 27 45 ~ 32 fps
100%
M3 Max 40-Core GPU:
135 143 ~ 139 fps
22%
M1 8-Core GPU:
23 25 43 ~ 30 fps
100%
M3 Max 40-Core GPU:
118 122 ~ 120 fps
100%
M3 Max 40-Core GPU:
86 88 ~ 87 fps
M1 8-Core GPU:
39 44 ~ 42 fps
100%
M3 Max 40-Core GPU:
56 fps
100%
M3 Max 40-Core GPU:
53 54 ~ 54 fps
100%
M3 Max 40-Core GPU:
50 51 ~ 51 fps
100%
M3 Max 40-Core GPU:
49 49 ~ 49 fps
M1 8-Core GPU:
39.6 [X] Apple Mac Mini Late 2020 (M1, 16GB) Metal
Apple M1 2.1GHz
M1 8-Core GPU
fps
100%
M3 Max 40-Core GPU:
87 fps
100%
M3 Max 40-Core GPU:
69 92 ~ 81 fps
100%
M3 Max 40-Core GPU:
77 79 ~ 78 fps
100%
M3 Max 40-Core GPU:
53 54 ~ 54 fps
100%
M3 Max 40-Core GPU:
51 52 ~ 52 fps
Average Gaming Apple M3 Max 40-Core GPU → 100% Average Gaming 30-70 fps → 100%
Average Gaming Apple M1 8-Core GPU → 22% Average Gaming 30-70 fps → 25%
Apple M3 Max 40-Core GPU low med. high ultra QHD 4K Total War Pharaoh 242 210 139 109 82 Cyberpunk 2077 2.1 Phantom Liberty 45 44 44 42 36 Baldur's Gate 3 96 90 60 Star Wars Jedi Survivor 51 Total War: Three Kingdoms 170 111 82 56 Shadow of the Tomb Raider 148 139 120 87 Far Cry 5 56 54 51 49 The Witcher 3 87 81 GTA V 78 54 52 < 30 fps < 60 fps < 120 fps ≥ 120 fps 1 1 2 3 2 4 2 4 4 1 4 3
For more games that might be playable and a list of all games and graphics cards visit our Gaming List
v1.28
log 04. 16:39:20
#0 checking url part for id 11636 +0s ... 0s
#1 checking url part for id 10552 +0s ... 0s
#2 redirected to Ajax server, took 1720103960 +0s ... 0s
#3 did not recreate cache, as it is less than 5 days old! Created at Thu, 04 Jul 2024 05:15:44 +0200 +0s ... 0s
#4 composed specs +0.05s ... 0.051s
#5 did output specs +0s ... 0.051s
#6 start showIntegratedCPUs +0s ... 0.051s
#7 getting avg benchmarks for device 11636 +0.019s ... 0.069s
#8 got single benchmarks 11636 +0.004s ... 0.074s
#9 getting avg benchmarks for device 10552 +0s ... 0.074s
#10 got single benchmarks 10552 +0.006s ... 0.08s
#11 got avg benchmarks for devices +0s ... 0.08s
#12 min, max, avg, median took s +0.018s ... 0.098s
#13 before gaming benchmark output +0s ... 0.098s
#14 Got 106 rows for game benchmarks. +0.008s ... 0.106s
#15 composed SQL query for gamebenchmarks +0s ... 0.106s
#16 got data and put it in $dataArray +0.001s ... 0.107s
#17 benchmarks composed for output. +0.006s ... 0.113s
#18 calculated avg scores. +0s ... 0.113s
#19 return log +0.002s ... 0.115s
Please share our article, every link counts!
Redaktion, 2017-09- 8 (Update: 2023-07- 1)
 Deutsch
 English
 Español
 Français
 Italiano
 Nederlands
 Polski
 Português
 Русский
 Türkçe
 Svenska
 Chinese
 Magyar