Apple M3 8-Core GPU vs AMD Radeon RX 6850M XT
Apple M3 8-Core GPU ► remove from comparison
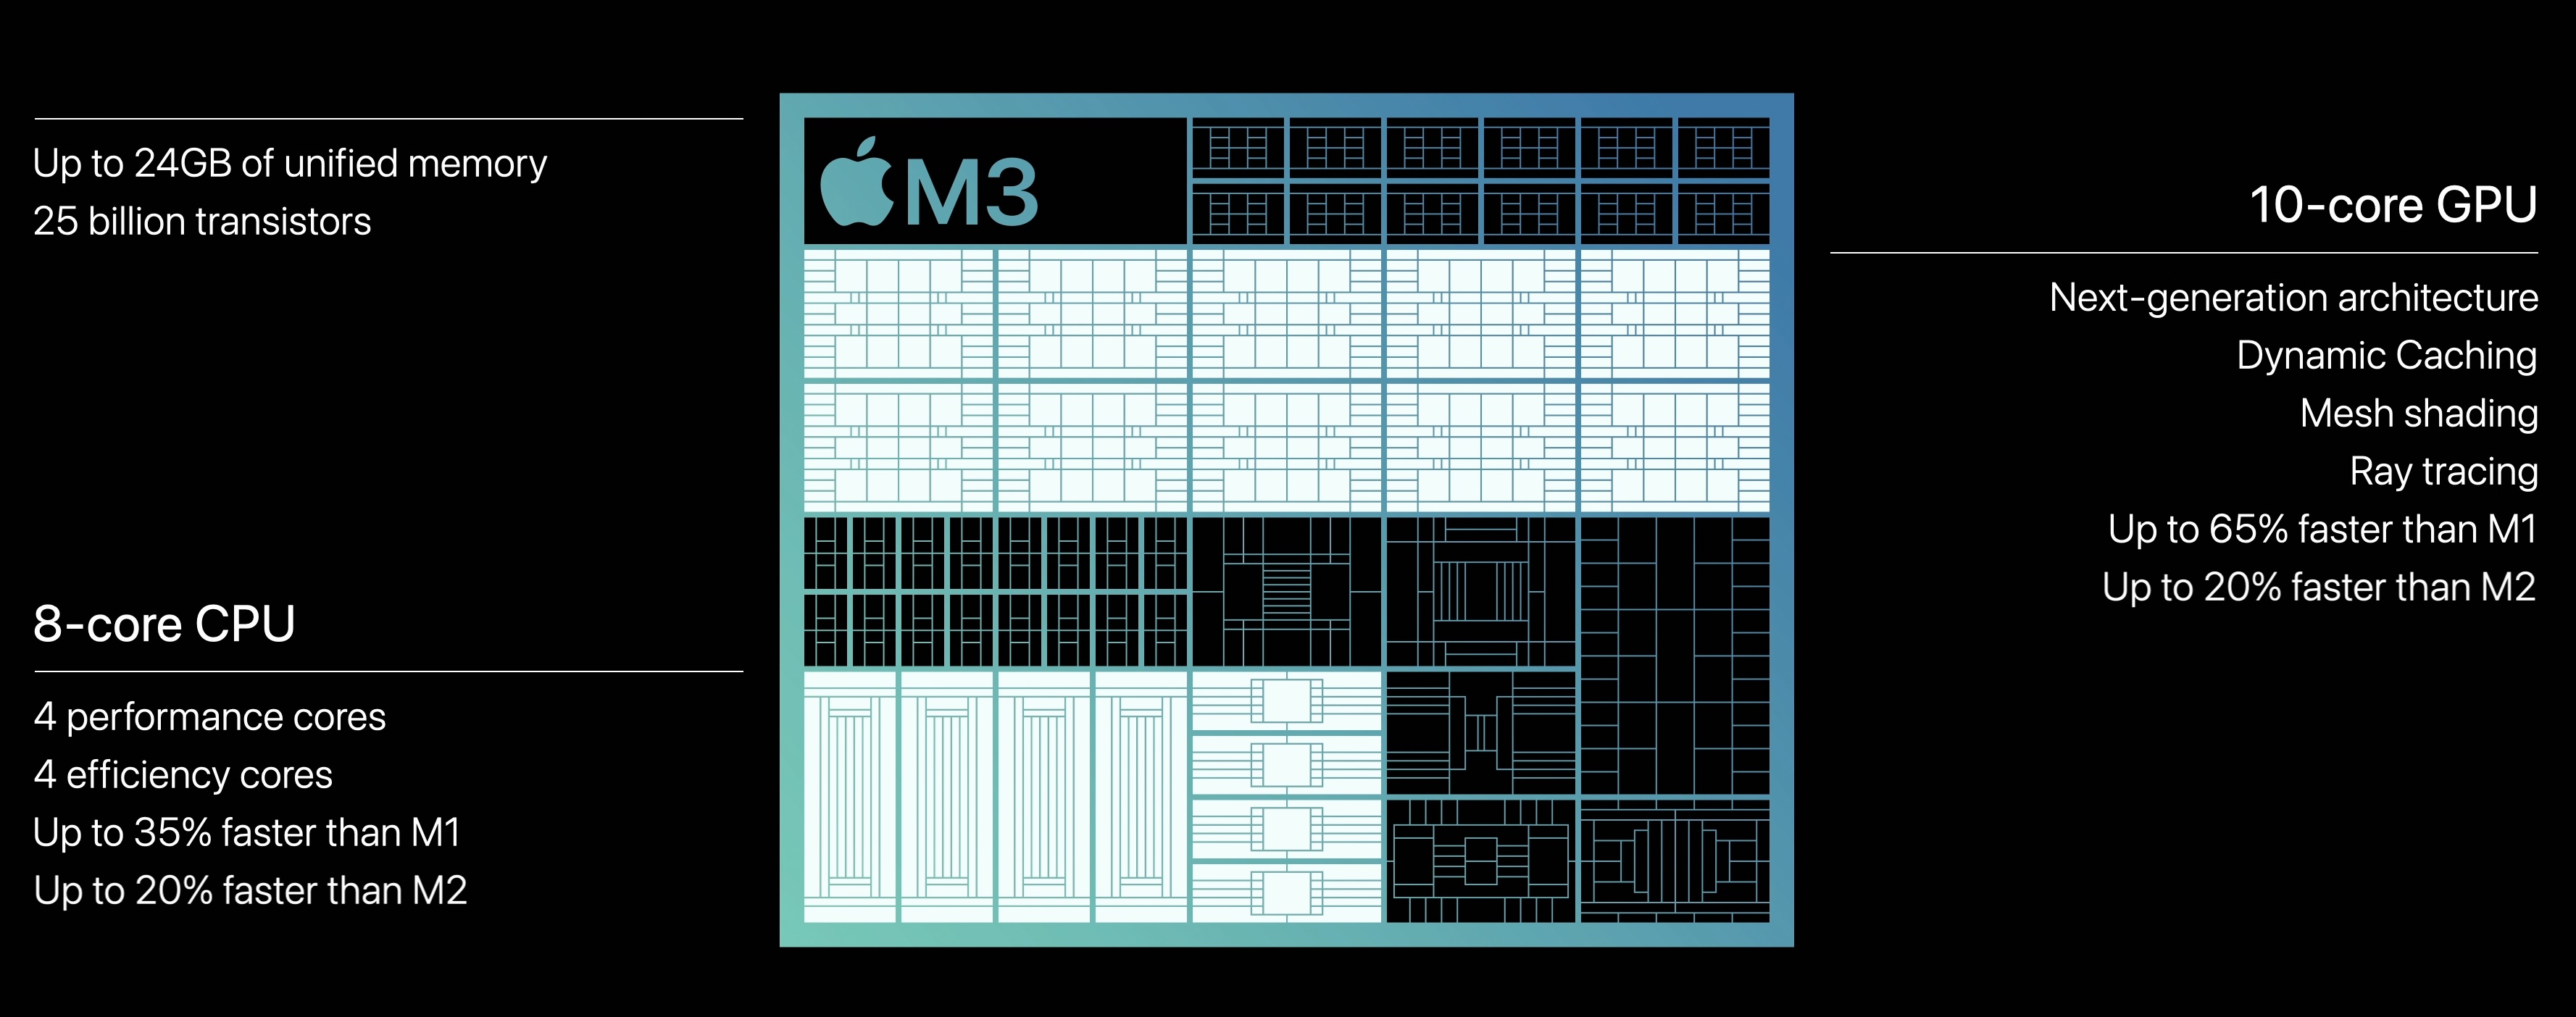
The Apple M3 GPU is an integrated graphics card offering 10 cores designed by Apple and integrated in the Apple M3 SoC . It uses the unified memory architecture of the M3 SoC (up to 24 GB LPDDR5-6400 with 100 GB/s bandwidth). The GPU uses a new architecture with support for mesh shading and ray tracing. Dynamic caching is also a new feature that should only us as much shared memory as needed.
The old M2 SoC showed a difference of around 15% between the 8-core and 10-core variant. Therefore, we expect a similar difference for the M3 models. This means, the M3 8-core version should be slightly faster than the 10-core GPU in the Apple M2 .
The M3 chip is manufactured in the new 3nm process at TSMC (most likely N3B). The power limit should be around the same 15 Watt as the 10-core variant.
AMD Radeon RX 6850M XT ► remove from comparison
The AMD Radeon RX 6850M XT is a mobile high-end graphics card for gaming laptops. It uses the Navi 22 chip based on the new RDNA 2 architecture. It uses all 2,560 shaders (= 40 CUs), 160 TMUs, and 64 ROPs and therefore is similar to the desktop Radeon RX 6700 XT. The 192 Bit memory system connects 12 GB GDDR6 with 18 Gbps memory speed. Furthermore, the RX6850MXT includes 96 MB Infinity Cache. AMD specified 2.463 GHz game clock for 13.3 TFLOPS theoretical performance (SP) at a TDP of 135-165 Watt. The difference to the previous RX 6800M is the slightly increased clock speed of the CPU and GPU.
The gaming performance of the RX 6850M XT should be slightly faster than the old RX 6800M which positioned itself between a RTX 3070 and 3080 for laptops . For
The Navi 22 chip is manufactured at TSMC in the modern 7nm process.
Apple M3 8-Core GPU AMD Radeon RX 6850M XT Radeon RX 6000M Series Pipelines 8 - unified 2560 - unified Memory Type LPDDR5-6400 GDDR6 Shared Memory no no Power Consumption 15 Watt 145 Watt technology 5 nm 7 nm Date of Announcement 31.10.2023 04.01.2022 Predecessor M1 8-Core GPU Codename Navi 22 Architecture RDNA 2 Core Speed 2463 (Boost) MHz Memory Speed 18000 MHz Memory Bus Width 192 Bit Max. Amount of Memory 12 GB API DirectX 12, Shader 6.4, OpenGL 4.6 Transistors 17.2 Billion Features DisplayPort 1.4 w/DFSC, HDMI 2.0b, Radeon Media Engine (H.264 4K150 decode, 4K90 encode / H.265 4K90 decode, 4K60 encode / VP9 4K90 decode) Notebook Size large Link to Manufacturer Page www.amd.com
Benchmarks 3DMark - 3DMark Time Spy Score
min: 11633 avg: 11650 median: 11649.5 (34%) max: 11666 Points
GPU TDP ? TDP 140 W 100% 100%
3DMark - 3DMark Time Spy Graphics
min: 11762 avg: 11837 median: 11837 (31%) max: 11912 Points
GPU TDP ? TDP 140 W 100% 99%
3DMark - 3DMark Cloud Gate Score
min: 60255 avg: 61794 median: 61794 (66%) max: 63333 Points
GPU TDP ? TDP 140 W 95% 100%
3DMark - 3DMark Cloud Gate Graphics
min: 168293 avg: 172972 median: 172972 (45%) max: 177650 Points
GPU TDP ? TDP 140 W 95% 100%
3DMark - 3DMark Fire Strike Standard Score
min: 27494 avg: 27931 median: 27931 (49%) max: 28368 Points
GPU TDP ? TDP 140 W 100% 97%
3DMark - 3DMark Fire Strike Standard Graphics
min: 32853 avg: 33901 median: 33900.5 (38%) max: 34948 Points
GPU TDP ? TDP 140 W 100% 94%
3DMark - 3DMark Wild Life Extreme Unlimited
6968 Points (8%)
3DMark 11 - 3DM11 Performance Score
min: 30432 avg: 30855 median: 30854.5 (43%) max: 31277 Points
GPU TDP ? TDP 140 W 97% 100%
3DMark 11 - 3DM11 Performance GPU
min: 41942 avg: 42016 median: 42015.5 (36%) max: 42089 Points
GPU TDP ? TDP 140 W 100% 100%
Blender - Blender 3.3 Classroom HIP *
min: 51 avg: 64 median: 64 (5%) max: 77 Seconds
GPU TDP ? TDP 140 W 100% 102%
Cinebench R15 + AMD Radeon RX 6850M XT Cinebench R15 - Cinebench R15 OpenGL 64 Bit
min: 197.6 avg: 200.8 median: 200.8 (12%) max: 204 fps
GPU TDP ? TDP 140 W 100% 97%
Cinebench R15 OpenGL Ref. Match 64 Bit + AMD Radeon RX 6850M XT Cinebench R15 - Cinebench R15 OpenGL Ref. Match 64 Bit
min: 97.9 avg: 98 median: 98 (98%) max: 98 %
GPU TDP ? TDP 140 W 100% 100%
GFXBench - GFXBench 5.0 4K Aztec Ruins High Tier Offscreen
44.5 fps (18%)
GFXBench - GFXBench 5.0 Aztec Ruins High Tier Offscreen
101.7 fps (18%)
GFXBench - GFXBench 5.0 Aztec Ruins Normal Tier Offscreen
282.3 fps (21%)
Geekbench 6.2 - Geekbench 6.2 GPU OpenCL
25825 Points (7%)
Power Consumption - Furmark Stress Test Power Consumption - external Monitor *
min: 217 avg: 223.5 median: 223.5 (32%) max: 230 Watt
GPU TDP ? TDP 140 W 100% 103%
Power Consumption - The Witcher 3 Power Consumption - external Monitor *
min: 223 avg: 237 median: 237 (33%) max: 251 Watt
GPU TDP ? TDP 140 W 106% 100%
Power Consumption - Witcher 3 Power Consumption *
min: 239 avg: 244 median: 244 (54%) max: 249 Watt
GPU TDP ? TDP 140 W 105% 100%
Power Consumption - Witcher 3 ultra Power Efficiency
min: 0.4743 avg: 0.5 median: 0.5 (45%) max: 0.528 fps per Watt
GPU TDP ? TDP 140 W 100% 90%
Power Consumption - Witcher 3 ultra Power Efficiency - external Monitor
min: 0.4705 avg: 0.5 median: 0.5 (43%) max: 0.566 fps per Watt
GPU TDP ? TDP 140 W 100% 83%
Emissions Witcher 3 Fan Noise + AMD Radeon RX 6850M XT Emissions - Witcher 3 Fan Noise
min: 49.75 avg: 52 median: 52 (83%) max: 54.3 dB(A)
GPU TDP ? TDP 140 W 92% 100%
Average Benchmarks Apple M3 8-Core GPU → 0% n= Average Benchmarks AMD Radeon RX 6850M XT → 0% n=
- Range of benchmark values for this graphics card
- Average benchmark values for this graphics card
* Smaller numbers mean a higher performance
1 This benchmark is not used for the average calculation
Game Benchmarks The following benchmarks stem from our benchmarks of review laptops. The performance depends on the used graphics memory, clock rate, processor, system settings, drivers, and operating systems. So the results don't have to be representative for all laptops with this GPU. For detailed information on the benchmark results, click on the fps number.
Radeon RX 6850M XT:
86 fps
Radeon RX 6850M XT:
54 fps
Radeon RX 6850M XT:
245 fps
Radeon RX 6850M XT:
241 fps
Radeon RX 6850M XT:
204 fps
Radeon RX 6850M XT:
52 fps
Radeon RX 6850M XT:
31 fps
Radeon RX 6850M XT:
160 fps
Radeon RX 6850M XT:
135.5 fps
Radeon RX 6850M XT:
105.8 fps
Radeon RX 6850M XT:
87.2 fps
Radeon RX 6850M XT:
53.6 57 ~ 55 fps
Radeon RX 6850M XT:
26 fps
Radeon RX 6850M XT:
136 fps
Radeon RX 6850M XT:
107 fps
Radeon RX 6850M XT:
86 fps
Radeon RX 6850M XT:
60 fps
Radeon RX 6850M XT:
30 fps
Radeon RX 6850M XT:
89 fps
Radeon RX 6850M XT:
95.6 fps
Radeon RX 6850M XT:
94.5 fps
Radeon RX 6850M XT:
78.4 fps
Radeon RX 6850M XT:
64.7 fps
Radeon RX 6850M XT:
130 fps
Radeon RX 6850M XT:
131 fps
Radeon RX 6850M XT:
132 fps
Radeon RX 6850M XT:
129 fps
Radeon RX 6850M XT:
103 fps
Radeon RX 6850M XT:
123 fps
Radeon RX 6850M XT:
112 fps
Radeon RX 6850M XT:
100 fps
Radeon RX 6850M XT:
99 fps
Radeon RX 6850M XT:
87 fps
Radeon RX 6850M XT:
351 fps
Radeon RX 6850M XT:
308 fps
Radeon RX 6850M XT:
297 fps
Radeon RX 6850M XT:
146 fps
Radeon RX 6850M XT:
95 fps
Radeon RX 6850M XT:
211.9 fps
Radeon RX 6850M XT:
192.6 fps
Radeon RX 6850M XT:
192.9 fps
Radeon RX 6850M XT:
191.3 fps
Radeon RX 6850M XT:
136.1 fps
Radeon RX 6850M XT:
235 fps
Radeon RX 6850M XT:
159 fps
Radeon RX 6850M XT:
130 fps
Radeon RX 6850M XT:
112 fps
Radeon RX 6850M XT:
82 87 ~ 85 fps
Radeon RX 6850M XT:
47 fps
Radeon RX 6850M XT:
270 fps
Radeon RX 6850M XT:
169.5 fps
Radeon RX 6850M XT:
131.7 fps
Radeon RX 6850M XT:
110.5 fps
Radeon RX 6850M XT:
89.3 fps
Radeon RX 6850M XT:
120 fps
Radeon RX 6850M XT:
119 fps
Radeon RX 6850M XT:
108 fps
Radeon RX 6850M XT:
83 fps
Radeon RX 6850M XT:
60 fps
Radeon RX 6850M XT:
181 fps
Radeon RX 6850M XT:
159 fps
Radeon RX 6850M XT:
142 fps
Radeon RX 6850M XT:
123 fps
Radeon RX 6850M XT:
100 fps
Radeon RX 6850M XT:
153 fps
Radeon RX 6850M XT:
252.2 fps
Radeon RX 6850M XT:
155.5 fps
Radeon RX 6850M XT:
117.8 fps
Radeon RX 6850M XT:
83.6 fps
Radeon RX 6850M XT:
112.8 fps
Radeon RX 6850M XT:
102.1 fps
Radeon RX 6850M XT:
94.2 fps
Radeon RX 6850M XT:
85.6 fps
Radeon RX 6850M XT:
68.6 fps
Radeon RX 6850M XT:
157.4 fps
Radeon RX 6850M XT:
150.7 fps
Radeon RX 6850M XT:
109.6 fps
Radeon RX 6850M XT:
86.9 fps
Radeon RX 6850M XT:
68.4 fps
Radeon RX 6850M XT:
375 445 ~ 410 fps
Radeon RX 6850M XT:
291 303 ~ 297 fps
Radeon RX 6850M XT:
256 261 [X] Lenovo Legion 7 16ARHA7 1.47.22.14 D3D12
AMD Ryzen 9 6900HX 3.3GHz
Radeon RX 6850M XT
min:
74.9 fps, P1:
186.3 fps, max:
472 fps
~ 259 fps
Radeon RX 6850M XT:
224 230 ~ 227 fps
Radeon RX 6850M XT:
92.1 fps
Radeon RX 6850M XT:
126 fps
Radeon RX 6850M XT:
109 fps
Radeon RX 6850M XT:
105 fps
Radeon RX 6850M XT:
102 fps
Radeon RX 6850M XT:
99 fps
Radeon RX 6850M XT:
68 fps
Radeon RX 6850M XT:
51 51.2 ~ 51 fps
Radeon RX 6850M XT:
27.5 fps
Radeon RX 6850M XT:
180.6 fps
Radeon RX 6850M XT:
148.5 fps
Radeon RX 6850M XT:
48.8 fps
Radeon RX 6850M XT:
94 95.2 ~ 95 fps
Radeon RX 6850M XT:
77.5 fps
Radeon RX 6850M XT:
72.2 fps
Radeon RX 6850M XT:
88.7 90 ~ 89 fps
Radeon RX 6850M XT:
98.5 fps
AMD Radeon RX 6850M XT low med. high ultra QHD 4K Call of Duty Modern Warfare 2 2022 86 54 F1 22 245 241 204 52 31 Cyberpunk 2077 1.6 160 135.5 105.8 87.2 55 26 Dying Light 2 136 107 86 60 30 God of War 89 95.6 94.5 78.4 64.7 Guardians of the Galaxy 130 131 132 129 103 Far Cry 6 123 112 100 99 87 F1 2021 351 308 297 146 95 Hitman 3 211.9 192.6 192.9 191.3 136.1 Assassin´s Creed Valhalla 235 159 130 112 85 47 Dirt 5 270 169.5 131.7 110.5 89.3 Watch Dogs Legion 120 119 108 83 60 Horizon Zero Dawn 181 159 142 123 100 Gears Tactics 153 252.2 155.5 117.8 83.6 Borderlands 3 112.8 102.1 94.2 85.6 68.6 Metro Exodus 157.4 150.7 109.6 86.9 68.4 Strange Brigade 410 297 259 227 166 92.1 Far Cry 5 126 109 105 102 99 68 X-Plane 11.11 65 51 44 27.5 Final Fantasy XV Benchmark 180.6 148.5 113 84 48.8 Dota 2 Reborn 141 114 113 95 77.5 The Witcher 3 303 225 198 122 72.2 GTA V 176 171 157 95 89 98.5 < 30 fps < 60 fps < 120 fps ≥ 120 fps 3 19 1 7 14 1 10 11 1 12 6 2 16 2 2 4 5
For more games that might be playable and a list of all games and graphics cards visit our Gaming List
v1.28
log 04. 22:00:23
#0 checking url part for id 12030 +0s ... 0s
#1 checking url part for id 11132 +0s ... 0s
#2 redirected to Ajax server, took 1720123223 +0s ... 0s
#3 did not recreate cache, as it is less than 5 days old! Created at Thu, 04 Jul 2024 05:15:44 +0200 +0s ... 0s
#4 composed specs +0.054s ... 0.054s
#5 did output specs +0s ... 0.054s
#6 start showIntegratedCPUs +0s ... 0.054s
#7 getting avg benchmarks for device 12030 +0.018s ... 0.072s
#8 got single benchmarks 12030 +0.003s ... 0.076s
#9 getting avg benchmarks for device 11132 +0s ... 0.076s
#10 got single benchmarks 11132 +0.005s ... 0.081s
#11 got avg benchmarks for devices +0s ... 0.081s
#12 min, max, avg, median took s +0.009s ... 0.09s
#13 before gaming benchmark output +0s ... 0.09s
#14 Got 141 rows for game benchmarks. +0.012s ... 0.102s
#15 composed SQL query for gamebenchmarks +0s ... 0.102s
#16 got data and put it in $dataArray +0.001s ... 0.103s
#17 benchmarks composed for output. +0.008s ... 0.111s
#18 calculated avg scores. +0s ... 0.111s
#19 return log +0.002s ... 0.113s
Please share our article, every link counts!
Redaktion, 2017-09- 8 (Update: 2023-07- 1)
 Deutsch
 English
 Español
 Français
 Italiano
 Nederlands
 Polski
 Português
 Русский
 Türkçe
 Svenska
 Chinese
 Magyar