 Deutsch
 English
 Español
 Français
 Italiano
 Nederlands
 Polski
 Português
 Русский
 Türkçe
 Svenska
 Chinese
 Magyar
Apple M3 8-Core GPU vs NVIDIA GeForce RTX 3070 Max-Q
Apple M3 8-Core GPU
► remove from comparison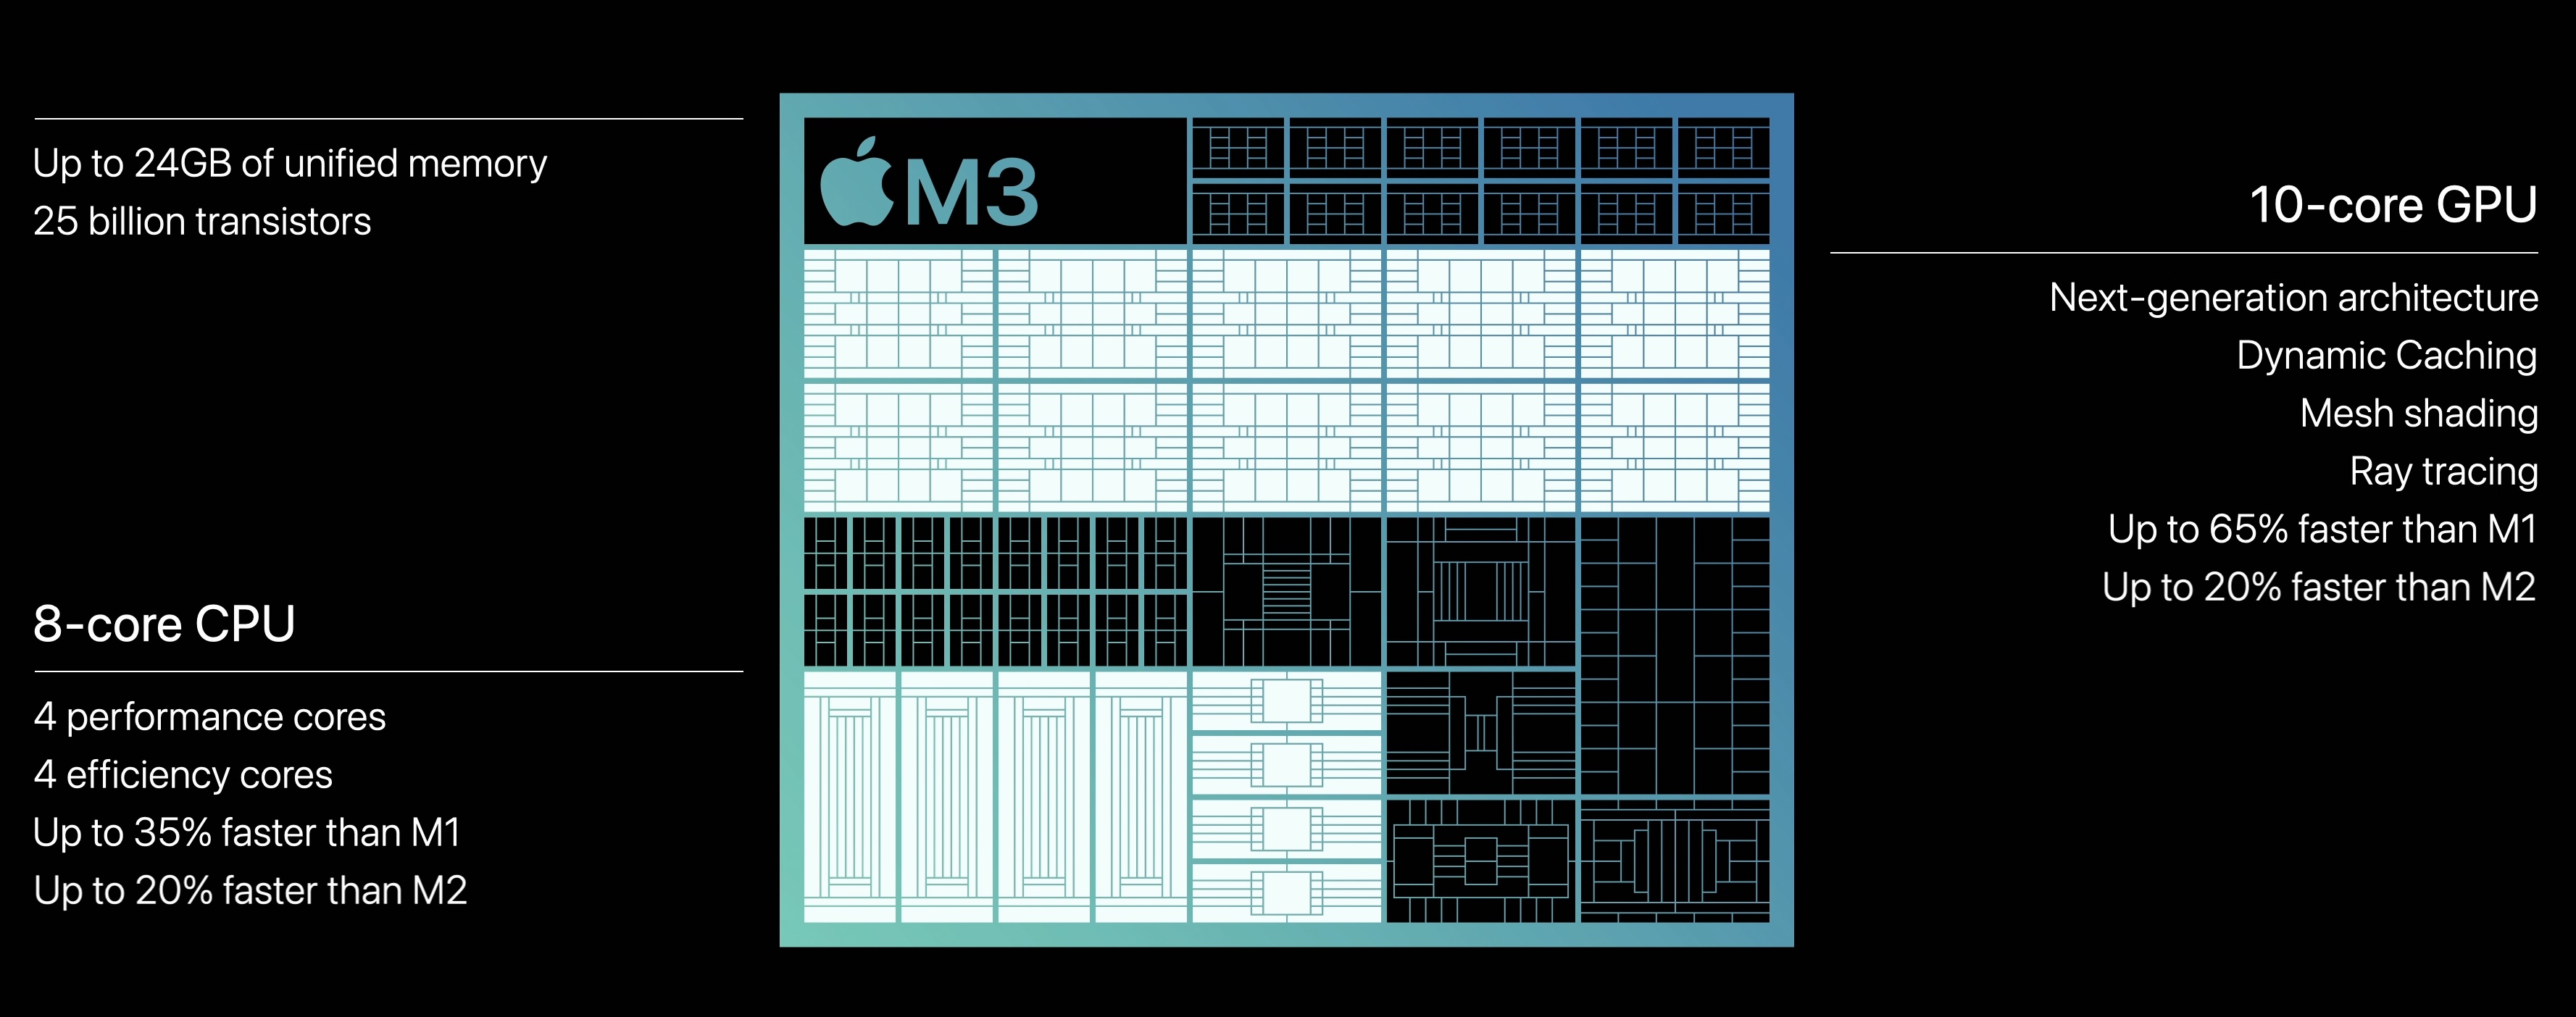
The Apple M3 GPU is an integrated graphics card offering 10 cores designed by Apple and integrated in the Apple M3 SoC. It uses the unified memory architecture of the M3 SoC (up to 24 GB LPDDR5-6400 with 100 GB/s bandwidth). The GPU uses a new architecture with support for mesh shading and ray tracing. Dynamic caching is also a new feature that should only us as much shared memory as needed.
The old M2 SoC showed a difference of around 15% between the 8-core and 10-core variant. Therefore, we expect a similar difference for the M3 models. This means, the M3 8-core version should be slightly faster than the 10-core GPU in the Apple M2.
The M3 chip is manufactured in the new 3nm process at TSMC (most likely N3B). The power limit should be around the same 15 Watt as the 10-core variant.
NVIDIA GeForce RTX 3070 Max-Q
► remove from comparison
The Nvidia GeForce RTX 3070 Max-Q (for laptops, GN20-E5 Max-Q) is the former name for a RTX 3070 Laptop GPU with Max-Q technologies. In previous generations, the Max-Q name was used for low power versions. With the RTX 3000 series, every TGP-version can now use Max-Q technologies and all GPUs are called RTX 3070 Laptop GPU (80 - 125W).
| Apple M3 8-Core GPU | NVIDIA GeForce RTX 3070 Max-Q | ||||||||||||||||||||||||||||||||||||||||||||||||||||||||||||||||||||||||||||||||||
| GeForce RTX 3000 Series |
|
| |||||||||||||||||||||||||||||||||||||||||||||||||||||||||||||||||||||||||||||||||
| Pipelines | 8 - unified | 5120 - unified | |||||||||||||||||||||||||||||||||||||||||||||||||||||||||||||||||||||||||||||||||
| Memory Type | LPDDR5-6400 | GDDR6 | |||||||||||||||||||||||||||||||||||||||||||||||||||||||||||||||||||||||||||||||||
| Shared Memory | no | no | |||||||||||||||||||||||||||||||||||||||||||||||||||||||||||||||||||||||||||||||||
| Power Consumption | 15 Watt | 80 Watt | |||||||||||||||||||||||||||||||||||||||||||||||||||||||||||||||||||||||||||||||||
| technology | 5 nm | 8 nm | |||||||||||||||||||||||||||||||||||||||||||||||||||||||||||||||||||||||||||||||||
| Date of Announcement | 31.10.2023 | 04.01.2021 | |||||||||||||||||||||||||||||||||||||||||||||||||||||||||||||||||||||||||||||||||
| Predecessor | M1 8-Core GPU | ||||||||||||||||||||||||||||||||||||||||||||||||||||||||||||||||||||||||||||||||||
| Codename | GN20-E5 GA104 | ||||||||||||||||||||||||||||||||||||||||||||||||||||||||||||||||||||||||||||||||||
| Architecture | Ampere | ||||||||||||||||||||||||||||||||||||||||||||||||||||||||||||||||||||||||||||||||||
| Core Speed | 1290 (Boost) MHz | ||||||||||||||||||||||||||||||||||||||||||||||||||||||||||||||||||||||||||||||||||
| Memory Bus Width | 256 Bit | ||||||||||||||||||||||||||||||||||||||||||||||||||||||||||||||||||||||||||||||||||
| Max. Amount of Memory | 8 GB | ||||||||||||||||||||||||||||||||||||||||||||||||||||||||||||||||||||||||||||||||||
| API | DirectX 12_2, Shader 6.7, OpenGL 4.6 | ||||||||||||||||||||||||||||||||||||||||||||||||||||||||||||||||||||||||||||||||||
| Notebook Size | large |