Notebookcheck Logo

Apple M2 vs Apple A10X Fusion

Apple M2

► remove from comparison Apple M2

The Apple M2 is a System on a Chip (SoC) from Apple that is found in the late 2022 MacBook Air and, MacBook Pro 13. It offers 8 cores divided in four performance cores and four power-efficiency cores. The big cores offer 192 KB instruction cache, 128 KB data cache, and 16 MB shared L2 cache (up from 12 MB). The four efficiency cores are a lot smaller and offer only 128 KB instruction cache, 64 KB data cache, and 4 MB shared cache. The efficiency cores (E cluster) clock with  up to 2,4 GHz, the performance cores (P cluster) with up to 3,5 GHz and therefore higher than the M1 cores. The architecture should be similar to the A15 (iPhone 13) with Avalanche and Blizzard cores.

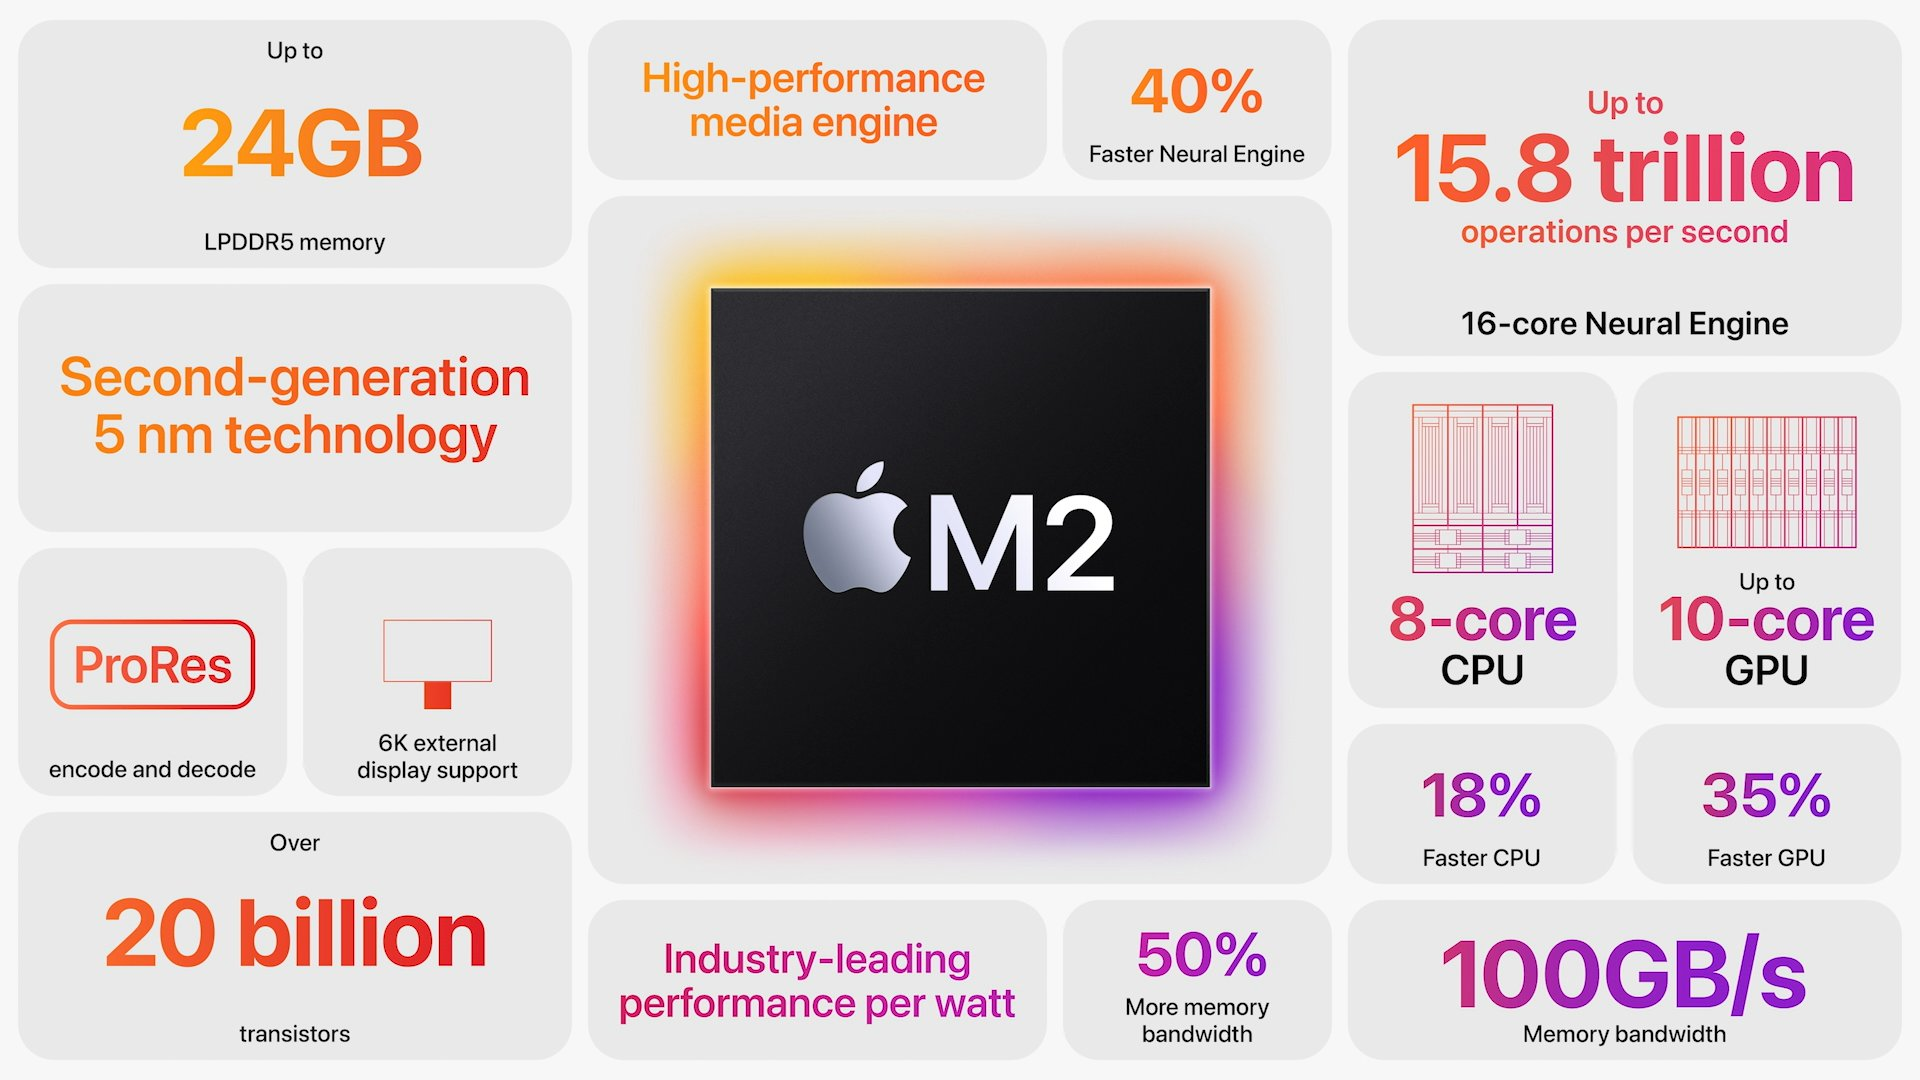
The chip features a unified memory architecture for the CPU and GPU cores and supports up to 24 GB LPDDR5-6400 for a bandwidth of up to 100GB/s.

According to Apple, the M2 offers a 18% higher CPU performance at the same power consumption level compared to the Apple M1. In our tests, the MacBook Pro 13 with active cooling was able to reach the 18% in Geekbench Multi. In other benchmarks we measured 12 to 15% gains compared to the M1. Therefore, the performance is now near the M1 Pro with 8 cores. The passively cooled MacBook Air may however suffer from throttling in longer load scenarios.

The integrated graphics card in the M2 offers 8 or 10 cores and a peak performance of 3.6 TFLOPs.

Furthermore, the SoC integrates a fast 16 core neural engine with a peak performance of 16 TOPS (for AI hardware acceleration), a secure enclave (e.g., for encryption), Thunderbolt / USB 4 controller, an ISP, and media de- and encoders.

The Apple M2 includes 20 billion transistors (up from the 16 billion of the M1) and is manufactured in the second generation 5nm process at TSMC (most likely N5P). The power consumption is rated at 20W what we also measured under CPU load.

Apple A10X Fusion

► remove from comparison

The Apple A10X Fusion is a system on a chip (SoC) from Apple that is built into the 2017 iPad Pro models. It integrates six 64 Bit cores that are divided in two clusters. Three high performance cores are clocked at up to 2.39 GHz. The three power saving cores are used for non demanding tasks. It looks like only one of both clusters is able to run at a time (therefore the apps see only three cores). The principle is similar to the first generation of ARMs big.LITTLE concept.

The performance of the SoC is positioned in the high and and clearly faster than all previous Apple SoCs. Even compared to Android high-end SoCs like the Snapdragon 835, the A10X takes the lead (e.g. in Geekbench or Antutu).

The integrated graphics card of the SoC will most likely stem from PowerVR (again) and features 12 cores instead of 6 in the A10 SoC.

According to TechInsights, the A10X is manufactured in the brand new 10 nm FinFet process at TSMC. Altough it offers more function blocks, the A10X is with measured 96.4 mm2 significantly smaller than the previous A9X (143.9 mm2).

ModelApple M2Apple A10X Fusion
SeriesApple Apple M2Apple Apple A-Series
Series: Apple M2
Apple M2 Max compare2.42 - 3.7 GHz12 / 12 cores48 MB L3
Apple M2 Pro compare2.42 - 3.5 GHz12 / 12 cores24 MB L3
Apple M2 Pro 10-Core compare2.42 - 3.7 GHz10 / 10 cores24 MB L3
Apple M2 « 2.42 - 3.48 GHz8 / 8 cores8 MB L3
Clock2424 - 3480 MHz2390 MHz
L1 Cache2 MB
L2 Cache20 MB
L3 Cache8 MB
Cores / Threads8 / 86 / 3
TDP20 Watt
Transistors20000 Million3300 Million
Technology5 nm10 nm
FeaturesARMv8 Instruction SetARMv8 Instruction Set
iGPUApple M2 10-Core GPU ( - 1398 MHz)Apple A10X Fusion GPU / PowerVR
ArchitectureARMARM
Announced
Manufacturerwww.apple.com
CodenameCyclone 4?

Benchmarks

Cinebench 2024 - Cinebench 2024 CPU Single Core
100%
1 M2 +
121 Points (84%)
Cinebench 2024 - Cinebench 2024 CPU Multi Core
100%
1 M2 +
513 Points (10%)
Cinebench R23 - Cinebench R23 Multi Core
100%
1 M2 +
min: 8517     avg: 8654     median: 8667 (8%)     max: 8772 Points
Cinebench R23 - Cinebench R23 Single Core
100%
1 M2 +
min: 1580     avg: 1595     median: 1585 (67%)     max: 1638 Points
Cinebench R20 - Cinebench R20 CPU (Single Core)
100%
1 M2 +
min: 216     avg: 370.8     median: 381 (42%)     max: 446 Points
Cinebench R20 - Cinebench R20 CPU (Multi Core)
100%
1 M2 +
min: 2231     avg: 2325     median: 2324 (6%)     max: 2416 Points
Cinebench R15 - Cinebench R15 CPU Multi 64 Bit
100%
1 M2 +
min: 1209.9     avg: 1222     median: 1215 (8%)     max: 1243 Points
Cinebench R15 - Cinebench R15 CPU Single 64 Bit
100%
1 M2 +
min: 222     avg: 223.8     median: 223 (67%)     max: 229 Points
Blender - Blender 3.3 Classroom CPU *
100%
1 M2 +
min: 540     avg: 620     median: 619.5 (8%)     max: 702 Seconds
Blender - Blender 2.79 BMW27 CPU *
100%
1 M2 +
min: 549     avg: 614     median: 597 (4%)     max: 713 Seconds
3DMark - 3DMark Ice Storm Unlimited Physics
min: 19534     avg: 19551     median: 19550.5 (16%)     max: 19567 Points
3DMark - 3DMark Sling Shot Extreme (ES 3.1) Unlimited Physics
min: 2036     avg: 2323     median: 2323 (27%)     max: 2610 Points
3DMark - 3DMark Sling Shot (ES 3.0) Unlimited Physics
min: 2145     avg: 2370     median: 2369.5 (27%)     max: 2594 Points
Geekbench 6.2 - Geekbench 6.2 Single-Core
100%
1 M2 +
min: 2587     avg: 2609     median: 2599 (70%)     max: 2650 Points
Geekbench 6.2 - Geekbench 6.2 Multi-Core
100%
1 M2 +
min: 10034     avg: 10083     median: 10089 (40%)     max: 10120 Points
Geekbench 5.5 - Geekbench 5.1 - 5.4 64 Bit Single-Core
100%
M2 +
min: 1887     avg: 1914     median: 1915.5 (81%)     max: 1953 Points
850 Points (36%)
Geekbench 5.5 - Geekbench 5.1 - 5.4 64 Bit Multi-Core
100%
M2 +
min: 8491     avg: 8812     median: 8956 (16%)     max: 8994 Points
2324 Points (4%)
Geekbench 4.4 - Geekbench 4.1 - 4.4 64 Bit Single-Core
min: 3924     avg: 3929     median: 3928.5 (39%)     max: 3933 Points
Geekbench 4.4 - Geekbench 4.1 - 4.4 64 Bit Multi-Core
min: 9293     avg: 9326     median: 9325.5 (10%)     max: 9358 Points
Mozilla Kraken 1.1 - Kraken 1.1 Total Score *
100%
M2 +
min: 440     avg: 450.1     median: 449.2 (1%)     max: 466.8 ms
min: 969     avg: 971     median: 971 (1%)     max: 973 ms
Octane V2 - Octane V2 Total Score
100%
M2 +
min: 72484     avg: 75019     median: 74878 (66%)     max: 78736 Points
min: 30333     avg: 30761     median: 30760.5 (27%)     max: 31188 Points
WebXPRT 4 - WebXPRT 4 Score
100%
1 M2 +
min: 223     avg: 237.8     median: 235 (68%)     max: 256 Points
WebXPRT 3 - WebXPRT 3 Score
100%
1 M2 +
min: 342     avg: 366.5     median: 376 (78%)     max: 387 Points
AnTuTu v6 - AnTuTu v6 Total Score
min: 217439     avg: 222713     median: 222713 (76%)     max: 227987 Points
Antutu v9 - AnTuTu v9 Total Score
100%
1 M2 +
min: 1257990     avg: 1337360     median: 1337360 (81%)     max: 1416730 Points
Antutu v9 - AnTuTu v9 CPU
100%
1 M2 +
min: 294643     avg: 298254     median: 298254 (82%)     max: 301865 Points
PassMark PerformanceTest Mobile V1 - PerformanceTest Mobile V1 CPU Tests
min: 82816     avg: 82838     median: 82837.5 (11%)     max: 82859 Points
CrossMark - CrossMark Overall
100%
1 M2 +
min: 1437     avg: 1515     median: 1507 (58%)     max: 1585 Points
Power Consumption - Cinebench R15 Multi Power Consumption - external Monitor *
100%
1 M2 +
29 Watt (5%)
Power Consumption - Geekbench 5.5 Power Consumption 150cd *
100%
1 M2 +
min: 6.86     avg: 8.3     median: 8.4 (4%)     max: 9.71 Watt
Power Consumption - Idle Power Consumption - external Monitor *
100%
1 M2 +
min: 2.03     avg: 2.6     median: 2.4 (2%)     max: 3.98 Watt
Power Consumption - Idle Power Consumption 150cd 1min *
100%
1 M2 +
min: 1.631     avg: 3.5     median: 3.6 (4%)     max: 5.32 Watt
Power Consumption - Cinebench R15 Multi Power Efficiency - external Monitor
100%
1 M2 +
42.4 Points per Watt (32%)

Average Benchmarks Apple M2 → 100% n=4

Average Benchmarks Apple A10X Fusion → 53% n=4

- Range of benchmark values for this graphics card
- Average benchmark values for this graphics card
* Smaller numbers mean a higher performance
1 This benchmark is not used for the average calculation

Add one or more devices and compare

In the following list you can select (and also search for) devices that should be added to the comparison. You can select more than one device.

restrict list:

show all (including archived), 2024, 2023
v1.28
log 30. 17:30:10

#0 checking url part for id 14521 +0s ... 0s

#1 checking url part for id 9162 +0s ... 0s

#2 redirected to Ajax server, took 1719761410 +0s ... 0s

#3 did not recreate cache, as it is less than 5 days old! Created at Fri, 28 Jun 2024 05:15:21 +0200 +0s ... 0s

#4 composed specs +0.005s ... 0.005s

#5 did output specs +0s ... 0.005s

#6 getting avg benchmarks for device 14521 +0.001s ... 0.006s

#7 got single benchmarks 14521 +0.008s ... 0.014s

#8 getting avg benchmarks for device 9162 +0.001s ... 0.014s

#9 got single benchmarks 9162 +0.004s ... 0.018s

#10 got avg benchmarks for devices +0s ... 0.018s

#11 min, max, avg, median took s +0.016s ... 0.034s

#12 return log +0.002s ... 0.036s

Please share our article, every link counts!
> Expert Reviews and News on Laptops, Smartphones and Tech Innovations > Benchmarks / Tech > Processor Comparison - Head 2 Head
Redaktion, 2017-09- 8 (Update: 2023-07- 1)