 Deutsch
 English
 Español
 Français
 Italiano
 Nederlands
 Polski
 Português
 Русский
 Türkçe
 Svenska
 Chinese
 Magyar
Apple M2 Pro vs Qualcomm Snapdragon X Elite X1E-80-100 vs Apple M2
Apple M2 Pro
► remove from comparison
The Apple M2 Pro is a System on a Chip (SoC) from Apple that is found in the early 2023 MacBook Pro 14 and 16-inch models. It offers all 12 cores available in the chip divided in eight performance cores (P-cores) and four power-efficiency cores (E-cores). The E-cores clock with up to 3.4 GHz, the P-Cores up to 3.7 GHz (mostly 3.3 GHz in multi-threaded workloads and 3.4 GHz in single threaded).
The big cores (codename Avalanche) offer 192 KB instruction cache, 128 KB data cache, and 36 MB shared L2 cache (up from 24 MB in the M1 Pro). The four efficiency cores (codename Blizzard) are a lot smaller and offer only 128 KB instruction cache, 64 KB data cache, and 4 MB shared cache. CPU and GPU can both use the 24 MB SLC (System Level Cache).
The unified memory (16 or 32 GB LPDDR5-6400) next to the chip is connected by a 256 Bit memory controller (200 GB/s bandwidth) and can be used by the GPU and CPU.
Apple states that the M2 Pro has a 25% higher performance than the M1 Pro in Xcode compiling.
The integrated graphics card in the M1 Pro offers all 19 cores.
Furthermore, the SoC integrates a fast 16 core neural engine (faster than M1 Pro), a secure enclave (e.g., for encryption), a unified memory architecture, Thunderbolt 4 controller, an ISP, and media de- and encoders (including ProRes).
The M2 Pro is manufactured in 5 nm at TSMC (second generation) and integrates 40 billion transistors.
Qualcomm Snapdragon X Elite X1E-80-100
► remove from comparison
The Snapdragon X Elite X1E-80-100 is a pretty fast ARM architecture processor (SoC) for use in Windows laptops. The X1E-80-100 is the second-fastest member of the Snapdragon X series, as of May 2024; as such, it has 12 Oryon CPU cores (3 clusters of equally powerful cores; 12 threads) running at up to 4.0 GHz, the 3.8 TFLOPS Adreno X1-85 GPU, the 45 TOPS Hexagon NPU and an impressively fast LPDDR5x-8448 memory controller.
The faster Snapdragon X Elite X1E-84-100 is thought to be based on the same die with the same NPU and the same number of CPU cores but with a higher GPU and CPU clock speeds.
Architecture and Features
Qualcomm Oryon cores are in part based on Nuvia IP; they most likely make use of the ARM v8.7 microarchitecture. Much like modern AMD and Intel processors, the Snapdragon chip is compatible with USB 4 and thus with Thunderbolt 4 but it remains to be seen if it is is compatible with GeForce or Radeon discrete graphics cards.
The Qualcomm SoC is thought to have at least 12 PCIe 4 and 4 PCIe 3 lanes for connecting various kinds of devices. NVMe SSDs are supported with a throughput of up to 7.9 GB/s; furthermore, most laptops built around the chip are expected to have 16 GB of LPDDR5X-8448 RAM. There is also a 45 TOPS NPU for accelerating AI workloads.
Performance
When all of the 12 cores are under load, they can run at up to 3.4 GHz. The much more desirable 4.0 GHz clock speed is only achievable under single-thread or dual-thread loads.
Given the very similar clock speeds, its multi-thread benchmark scores should be about the same as that of the X1E-78-100 for Ryzen 7 7840U and Apple M3-like performance in most real-world tasks. We'll make sure to update this section once we get our hands on a system powered by the X1E-80-100.
Like any other Windows on ARM platform, the Snapdragon X chip works best with applications and games compiled specifically for ARM processors. If making use of the built-in x86 to ARM emulation mode, a performance penalty of about 20% is to be expected.
Graphics
The integrated 3.8 TFLOPS Adreno X1-85 GPU is DirectX 12-enabled but not DirectX 12 Ultimate-enabled, despite featuring VRS and ray tracing support. The 3.8 TFLOPS of performance that it delivers pale in comparison to the slowest current-generation professional Nvidia Ada graphics card for laptops, the RTX 500 Ada, that delivers up to 9.2 TFLOPS.
Its gaming performance is somewhat underwhelming. While slightly faster than the aging Iris Xe (96 EUs), the Adreno is not fast enough to outpace the Radeon 780M meaning there is little point in comparing it with full-fat discrete graphics cards. Baldur's Gate 3, a triple-A title released in 2023, is pretty much unplayable at 1080p / Low. GTA V, a game that saw the light of day in 2015, is playable at 1080p / High.
The Qualcomm iGPU will let you use up to 3 UHD 2160p monitors simultaneously. 2160p120 integrated displays are supported, as are the popular AV1, HEVC and AVC video codecs (both decoding and encoding). The hardware does not support the VVC codec; that feature remains a Lunar Lake exclusive for now.
Power consumption
The X1E-80-100 is most likely going to be less power-hungry than its more powerful brother (the latter can be set to consume up to 80 Watts). Expect to see anything between 20 W and 45 W under long-term workloads because that's what Ryzen HS chips normally consume.
The SoC is built with a 4 nm TSMC process for decent, as of H1 2024, energy efficiency.
Apple M2
► remove from comparison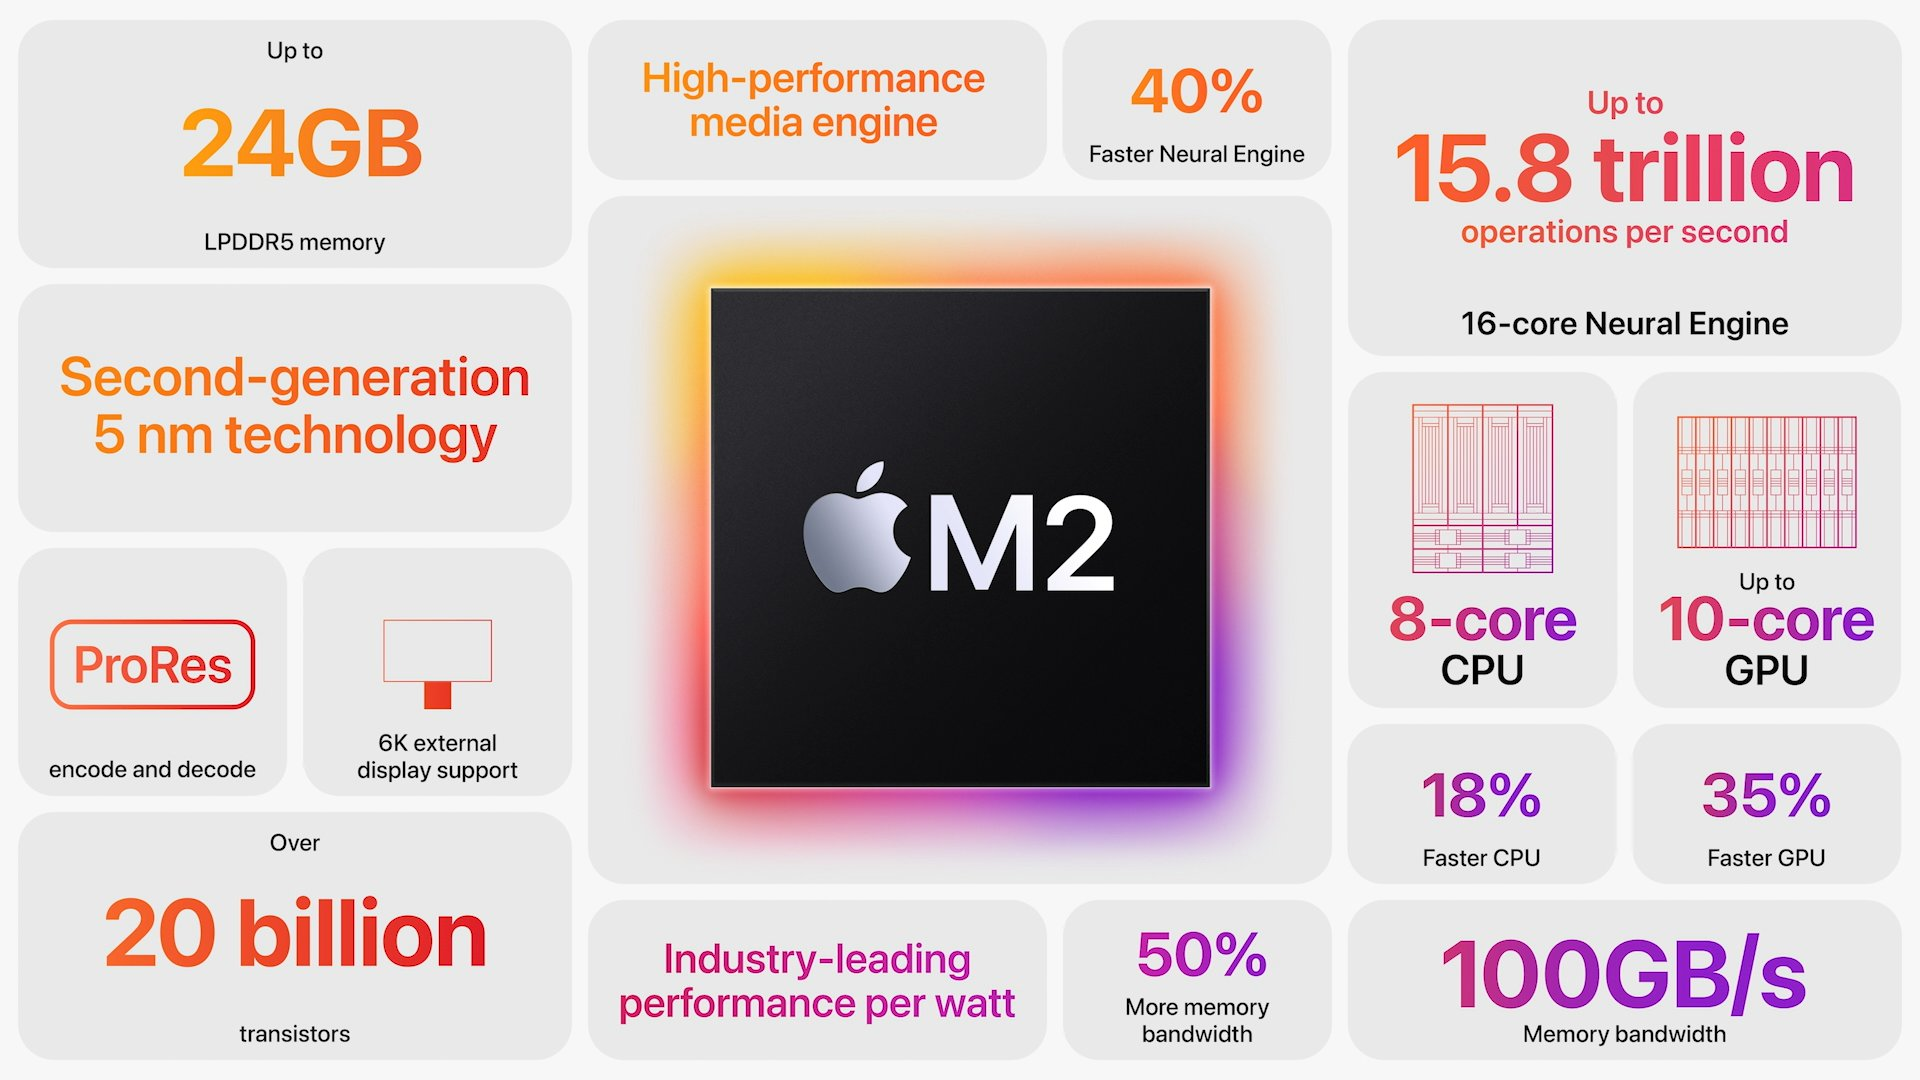
The Apple M2 is a System on a Chip (SoC) from Apple that is found in the late 2022 MacBook Air and, MacBook Pro 13. It offers 8 cores divided in four performance cores and four power-efficiency cores. The big cores offer 192 KB instruction cache, 128 KB data cache, and 16 MB shared L2 cache (up from 12 MB). The four efficiency cores are a lot smaller and offer only 128 KB instruction cache, 64 KB data cache, and 4 MB shared cache. The efficiency cores (E cluster) clock with up to 2,4 GHz, the performance cores (P cluster) with up to 3,5 GHz and therefore higher than the M1 cores. The architecture should be similar to the A15 (iPhone 13) with Avalanche and Blizzard cores.
The chip features a unified memory architecture for the CPU and GPU cores and supports up to 24 GB LPDDR5-6400 for a bandwidth of up to 100GB/s.
According to Apple, the M2 offers a 18% higher CPU performance at the same power consumption level compared to the Apple M1. In our tests, the MacBook Pro 13 with active cooling was able to reach the 18% in Geekbench Multi. In other benchmarks we measured 12 to 15% gains compared to the M1. Therefore, the performance is now near the M1 Pro with 8 cores. The passively cooled MacBook Air may however suffer from throttling in longer load scenarios.
The integrated graphics card in the M2 offers 8 or 10 cores and a peak performance of 3.6 TFLOPs.
Furthermore, the SoC integrates a fast 16 core neural engine with a peak performance of 16 TOPS (for AI hardware acceleration), a secure enclave (e.g., for encryption), Thunderbolt / USB 4 controller, an ISP, and media de- and encoders.
The Apple M2 includes 20 billion transistors (up from the 16 billion of the M1) and is manufactured in the second generation 5nm process at TSMC (most likely N5P). The power consumption is rated at 20W what we also measured under CPU load.
| Model | Apple M2 Pro | Qualcomm Snapdragon X Elite X1E-80-100 | Apple M2 | ||||||||||||||||||||||||||||||||||||||||||||||||||||
| Series | Apple Apple M2 | Qualcomm Snapdragon X | Apple Apple M2 | ||||||||||||||||||||||||||||||||||||||||||||||||||||
| Series: Apple M2 |
|
|
| ||||||||||||||||||||||||||||||||||||||||||||||||||||
| Clock | 2424 - 3504 MHz | <=4000 MHz | 2424 - 3480 MHz | ||||||||||||||||||||||||||||||||||||||||||||||||||||
| L1 Cache | 3.3 MB | 2 MB | |||||||||||||||||||||||||||||||||||||||||||||||||||||
| L2 Cache | 36 MB | 20 MB | |||||||||||||||||||||||||||||||||||||||||||||||||||||
| L3 Cache | 24 MB | 8 MB | |||||||||||||||||||||||||||||||||||||||||||||||||||||
| Cores / Threads | 12 / 12 | 12 / 12 12 x 4.0 GHz Qualcomm Oryon | 8 / 8 | ||||||||||||||||||||||||||||||||||||||||||||||||||||
| Transistors | 40000 Million | 20000 Million | |||||||||||||||||||||||||||||||||||||||||||||||||||||
| Technology | 5 nm | 4 nm | 5 nm | ||||||||||||||||||||||||||||||||||||||||||||||||||||
| Features | ARMv8 Instruction Set | ARMv8 Instruction Set | |||||||||||||||||||||||||||||||||||||||||||||||||||||
| iGPU | Apple M2 Pro 19-Core GPU | Qualcomm Snapdragon X Adreno X1-85 (3.8 TFLOPS) | Apple M2 10-Core GPU ( - 1398 MHz) | ||||||||||||||||||||||||||||||||||||||||||||||||||||
| Architecture | ARM | ARM | ARM | ||||||||||||||||||||||||||||||||||||||||||||||||||||
| Announced | |||||||||||||||||||||||||||||||||||||||||||||||||||||||
| Codename | Oryon | ||||||||||||||||||||||||||||||||||||||||||||||||||||||
| TDP Turbo PL2 | 80 Watt | ||||||||||||||||||||||||||||||||||||||||||||||||||||||
| Manufacturer | www.qualcomm.com | www.apple.com | |||||||||||||||||||||||||||||||||||||||||||||||||||||
| TDP | 20 Watt |

