Apple M2 Pro 16-Core GPU vs AMD Radeon RX 7700S
Apple M2 Pro 16-Core GPU ► remove from comparison
The Apple M2 Pro 16-Core-GPU is an integrated graphics card by Apple offering all 16 of the 19 cores in the M2 Pro 10-Core Chip .
The graphics card has no dedicated graphics memory but can use the fast LPDDR5-6400 unified memory with a 256 bit bus (up to 200 GBit/s).
According to Apple, the performance of the 19-core-GPU should be 30% higher than the old 16-core-GPU in the M1 Pro . Therefore, the cut down 16-core version should still beat the old full-featured 16-core M1 Pro slightly and the old 14-core more clearly.
The GPU is intended to use Apple Metal 2 API and could still be based on the older PowerVR architectures (last used in the Apple A10). A new feature in the MacBook Pro 14 of 2023 is the support for HDMI 2.1 and 8k output.
The Apple M2 Pro is manufactured in the second generation 5nm process at TSMC.
AMD Radeon RX 7700S ► remove from comparison
The AMD Radeon RX 7700S is a mobile upper mid-range graphics card based on the Navi 33 chip (RDNA 3 architecture) manufactured in 6nm. It features 2,048 cores (32 CUs - compute units) and 8 GB of fast GDDR6 graphics memory connected with a 128 Bit memory bus. The chip also includes 32 MB Infinity Cache. The clock speed of the cores will depend on the laptop according to AMD. The specified game clock speed is 2200 MHz (most likely at 100 W TGP). The 7700S is the power efficient version of the RX 7600M XT with slightly reduced clock speeds (-100 MHz) and TDP (-20W max).
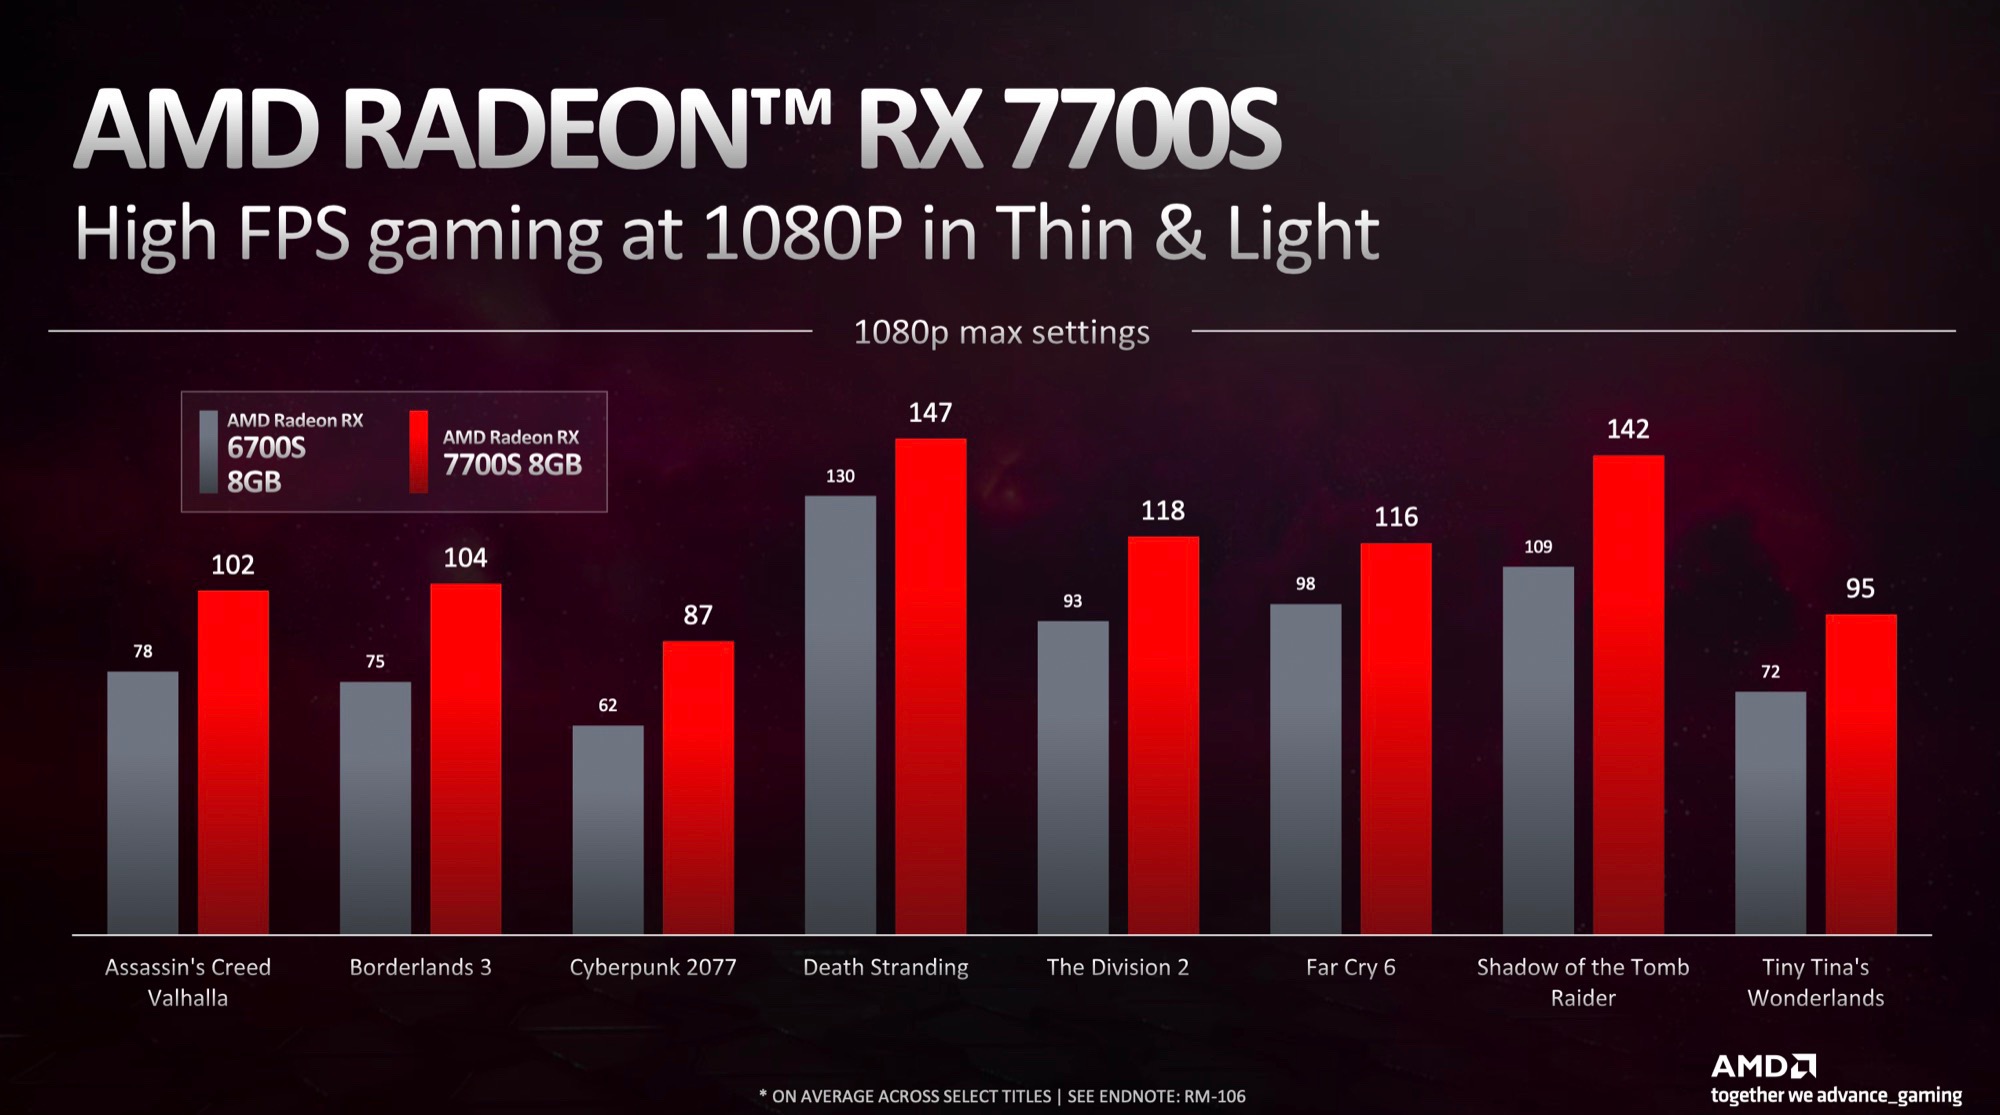
AMD compares the performance to the old Radeon RX 6700S , that is easily beaten by the 7700S. As the theoretical performance is only slightly below the 7600M XT (at 100W TGP), the 7700S should also beat the RTX 3060 desktop GPU . Although the Raytracing performance did increase for RDNA 3, the GeForce GPUs are still faster in this regard.
The Navi 33 chip is manufactured at TSMC in the current 6nm process (versus 4nm of Nvidia RTX 4000 series). The power consumption (TGP) is specified at 75 to 100 Watt.
Apple M2 Pro 16-Core GPU AMD Radeon RX 7700S Radeon RX 7000M Series Pipelines 16 - unified 2048 - unified Memory Type LPDDR5-6400 GDDR6 Shared Memory no no technology 5 nm 6 nm Notebook Size medium sized large Date of Announcement 17.01.2023 05.01.2023 Codename Navi 33 Architecture RDNA 3 ROPs 64 Core Speed 2200 (Boost) MHz Theoretical Performance 31 TFLOPS FP16, 20.5 TFLOPS FP32 Cache L3: 32 MB Memory Speed 18000 MHz Memory Bus Width 128 Bit Max. Amount of Memory 8 GB Memory Bandwidth 288 GB/s API DirectX 12, Shader 6.4, OpenGL 4.6 Power Consumption 100 Watt (75 - 100 Watt TGP) Transistors 13.3 Billion Die Size 204 mm² Link to Manufacturer Page www.amd.com
Benchmarks 3DMark - 3DMark Time Spy Score
10294 Points (30%)
3DMark - 3DMark Time Spy Graphics
10206 Points (27%)
3DMark - 3DMark Fire Strike Standard Score
21865 Points (39%)
3DMark - 3DMark Fire Strike Standard Graphics
24246 Points (27%)
3DMark - 3DMark Wild Life Extreme Unlimited
11224 Points (13%)
3DMark 11 - 3DM11 Performance Score
32427 Points (45%)
3DMark 11 - 3DM11 Performance GPU
37918 Points (33%)
Blender - Blender 3.3 Classroom METAL *
132 Seconds (14%)
Cinebench R15 + Apple M2 Pro 16-Core GPU Cinebench R15 - Cinebench R15 OpenGL 64 Bit
141.9 fps (8%)
Cinebench R15 OpenGL 64 Bit + AMD Radeon RX 7700S
282 fps (16%)
GPU TDP 25 W TDP 100 W 50% 100%
Cinebench R15 OpenGL Ref. Match 64 Bit + Apple M2 Pro 16-Core GPU Cinebench R15 - Cinebench R15 OpenGL Ref. Match 64 Bit
99.5 % (100%)
Cinebench R15 OpenGL Ref. Match 64 Bit + AMD Radeon RX 7700S
97.9 % (98%)
GPU TDP 25 W TDP 100 W 100% 98%
GFXBench - GFXBench 5.0 4K Aztec Ruins High Tier Offscreen
78.7 fps (32%)
GFXBench - GFXBench 5.0 Aztec Ruins High Tier Offscreen
181.1 fps (33%)
GFXBench - GFXBench 5.0 Aztec Ruins Normal Tier Offscreen
493 fps (37%)
GFXBench - GFXBench Car Chase Offscreen
389 fps (44%)
GFXBench 3.1 - GFXBench Manhattan ES 3.1 Offscreen
659 fps (14%)
GFXBench 3.0 - GFXBench 3.0 Manhattan Offscreen
1011 fps (59%)
GFXBench (DX / GLBenchmark) 2.7 + Apple M2 Pro 16-Core GPU GFXBench (DX / GLBenchmark) 2.7 - GFXBench T-Rex HD Offscreen C24Z16
1815 fps (14%)
Basemark GPU 1.2 - Basemark GPU 1.2 Vulkan Official Medium Offscreen 1080
104.6 fps (1%)
Basemark GPU 1.2 - Basemark GPU 1.2 Vulkan Official High Offscreen 2160
3.6 fps (1%)
Geekbench 6.2 - Geekbench 6.2 GPU OpenCL
73082 Points (21%)
Geekbench 6.2 - Geekbench 6.2 GPU Vulkan
31001 Points (10%)
Power Consumption - Furmark Stress Test Power Consumption - external Monitor *
167.5 Watt (24%)
Power Consumption - The Witcher 3 Power Consumption - external Monitor *
47.8 Watt (7%)
171.3 Watt (24%)
GPU TDP 25 W TDP 100 W 123% 100%
Power Consumption - Witcher 3 Power Consumption *
46.6 Watt (10%)
171.9 Watt (38%)
GPU TDP 25 W TDP 100 W 144% 100%
Power Consumption - Witcher 3 ultra Power Efficiency
1 fps per Watt (87%)
Power Consumption - Witcher 3 ultra Power Efficiency - external Monitor
0.9 fps per Watt (78%)
0.6 fps per Watt (48%)
GPU TDP 25 W TDP 100 W 100% 62%
Emissions Witcher 3 Fan Noise + AMD Radeon RX 7700S Emissions - Witcher 3 Fan Noise
51.9 dB(A) (83%)
Average Benchmarks Apple M2 Pro 16-Core GPU → 100% n=2 Average Benchmarks AMD Radeon RX 7700S → 149% n=2
- Range of benchmark values for this graphics card
- Average benchmark values for this graphics card
* Smaller numbers mean a higher performance
1 This benchmark is not used for the average calculation
Game Benchmarks The following benchmarks stem from our benchmarks of review laptops. The performance depends on the used graphics memory, clock rate, processor, system settings, drivers, and operating systems. So the results don't have to be representative for all laptops with this GPU. For detailed information on the benchmark results, click on the fps number.
Radeon RX 7700S:
100.7 fps
Radeon RX 7700S:
106.8 fps
Radeon RX 7700S:
183.5 fps
Radeon RX 7700S:
140.4 fps
100%
M2 Pro 16-Core GPU:
80.8 fps
100%
M2 Pro 16-Core GPU:
52 fps
100%
M2 Pro 16-Core GPU:
38 fps
100%
M2 Pro 16-Core GPU:
28.9 fps
100%
M2 Pro 16-Core GPU:
258 fps
100%
M2 Pro 16-Core GPU:
75 fps
100%
M2 Pro 16-Core GPU:
48 fps
100%
M2 Pro 16-Core GPU:
36 fps
100%
M2 Pro 16-Core GPU:
22 fps
100%
M2 Pro 16-Core GPU:
159 fps
100%
M2 Pro 16-Core GPU:
72 fps
100%
M2 Pro 16-Core GPU:
65 fps
100%
M2 Pro 16-Core GPU:
57 fps
100%
M2 Pro 16-Core GPU:
36 fps
Radeon RX 7700S:
449 [X] Framework Laptop 16 1.47.22.14 D3D12
AMD Ryzen 9 7940HS 4GHz
Radeon RX 7700S
min:
142.6 fps, P1:
335 fps, max:
711 fps
fps
Radeon RX 7700S:
202 [X] Framework Laptop 16 1.47.22.14 D3D12
AMD Ryzen 9 7940HS 4GHz
Radeon RX 7700S
min:
102.7 fps, P1:
166.3 fps, max:
380 fps
fps
Radeon RX 7700S:
167.4 [X] Framework Laptop 16 1.47.22.14 D3D12
AMD Ryzen 9 7940HS 4GHz
Radeon RX 7700S
min:
88.3 fps, P1:
121 fps, max:
423 fps
fps
Radeon RX 7700S:
143.9 [X] Framework Laptop 16 1.47.22.14 D3D12
AMD Ryzen 9 7940HS 4GHz
Radeon RX 7700S
min:
84.9 fps, P1:
104.3 fps, max:
353 fps
fps
Radeon RX 7700S:
91.9 [X] Framework Laptop 16 1.47.22.14 D3D12
AMD Ryzen 9 7940HS 4GHz
Radeon RX 7700S
min:
66 fps, P1:
75.1 fps, max:
157.7 fps
fps
Radeon RX 7700S:
47.9 [X] Framework Laptop 16 1.47.22.14 D3D12
AMD Ryzen 9 7940HS 4GHz
Radeon RX 7700S
min:
38.8 fps, P1:
42.4 fps, max:
68.5 fps
fps
Radeon RX 7700S:
159.8 fps
Radeon RX 7700S:
156.5 fps
Radeon RX 7700S:
136.8 fps
Radeon RX 7700S:
392.2 fps
Radeon RX 7700S:
277.5 fps
100%
M2 Pro 16-Core GPU:
51 fps
288%
Radeon RX 7700S:
147.1 fps
100%
M2 Pro 16-Core GPU:
45 fps
187%
Radeon RX 7700S:
84 fps
100%
M2 Pro 16-Core GPU:
76 fps
242%
Radeon RX 7700S:
184 fps
100%
M2 Pro 16-Core GPU:
73 fps
245%
Radeon RX 7700S:
178.6 fps
100%
M2 Pro 16-Core GPU:
46 fps
371%
Radeon RX 7700S:
170.6 fps
Average Gaming Apple M2 Pro 16-Core GPU → 100% Average Gaming 30-70 fps → 100%
Average Gaming AMD Radeon RX 7700S → 267% AMD Radeon RX 7700S low med. high ultra QHD 4K Cyberpunk 2077 2.1 Phantom Liberty 100.7 80.5 68.1 60.7 37.3 15.8 Baldur's Gate 3 106.8 88 76.4 73.6 51.1 24.7 F1 22 251 221 168 47.7 29.9 11.3 Tiny Tina's Wonderlands 183.5 140.4 92 71.2 47.3 23.1 Strange Brigade 449 202 167.4 143.9 91.9 47.9 Far Cry 5 148 130 123 117 81 39 X-Plane 11.11 97.6 79.3 65 46.8 Final Fantasy XV Benchmark 206 106 74.8 54.5 29 Dota 2 Reborn 174 159.8 156.5 136.8 85.3 The Witcher 3 392.2 277.5 147.1 84 43 GTA V 184 178.6 170.6 95.8 67.1 68.4 < 30 fps < 60 fps < 120 fps ≥ 120 fps 3 8 4 7 5 6 1 6 2 1 4 3 5 4 2
Apple M2 Pro 16-Core GPU low med. high ultra QHD 4K Borderlands 3 80.8 52 38 28.9 Total War: Three Kingdoms 258 75 48 36 22 Shadow of the Tomb Raider 159 72 65 57 36 The Witcher 3 51 45 GTA V 76 73 46 < 30 fps < 60 fps < 120 fps ≥ 120 fps 2 2 1 3 4 1 1 3 1 1
For more games that might be playable and a list of all games and graphics cards visit our Gaming List
v1.28
log 04. 09:54:33
#0 checking url part for id 11570 +0s ... 0s
#1 checking url part for id 11554 +0s ... 0s
#2 redirected to Ajax server, took 1720079673 +0s ... 0s
#3 did not recreate cache, as it is less than 5 days old! Created at Thu, 04 Jul 2024 05:15:44 +0200 +0s ... 0s
#4 composed specs +0.005s ... 0.005s
#5 did output specs +0s ... 0.005s
#6 start showIntegratedCPUs +0s ... 0.005s
#7 getting avg benchmarks for device 11570 +0.009s ... 0.014s
#8 got single benchmarks 11570 +0s ... 0.015s
#9 getting avg benchmarks for device 11554 +0s ... 0.015s
#10 got single benchmarks 11554 +0.004s ... 0.019s
#11 got avg benchmarks for devices +0s ... 0.019s
#12 min, max, avg, median took s +0.011s ... 0.03s
#13 before gaming benchmark output +0s ... 0.03s
#14 Got 80 rows for game benchmarks. +0.007s ... 0.037s
#15 composed SQL query for gamebenchmarks +0s ... 0.037s
#16 got data and put it in $dataArray +0.001s ... 0.038s
#17 benchmarks composed for output. +0.005s ... 0.042s
#18 calculated avg scores. +0s ... 0.042s
#19 return log +0.002s ... 0.044s
Please share our article, every link counts!
Redaktion, 2017-09- 8 (Update: 2023-07- 1)
 Deutsch
 English
 Español
 Français
 Italiano
 Nederlands
 Polski
 Português
 Русский
 Türkçe
 Svenska
 Chinese
 Magyar