Apple M2 Pro 16-Core GPU vs Intel Arc A350M vs Apple M2 10-Core GPU
Apple M2 Pro 16-Core GPU ► remove from comparison
The Apple M2 Pro 16-Core-GPU is an integrated graphics card by Apple offering all 16 of the 19 cores in the M2 Pro 10-Core Chip .
The graphics card has no dedicated graphics memory but can use the fast LPDDR5-6400 unified memory with a 256 bit bus (up to 200 GBit/s).
According to Apple, the performance of the 19-core-GPU should be 30% higher than the old 16-core-GPU in the M1 Pro . Therefore, the cut down 16-core version should still beat the old full-featured 16-core M1 Pro slightly and the old 14-core more clearly.
The GPU is intended to use Apple Metal 2 API and could still be based on the older PowerVR architectures (last used in the Apple A10). A new feature in the MacBook Pro 14 of 2023 is the support for HDMI 2.1 and 8k output.
The Apple M2 Pro is manufactured in the second generation 5nm process at TSMC.
Intel Arc A350M ► remove from comparison
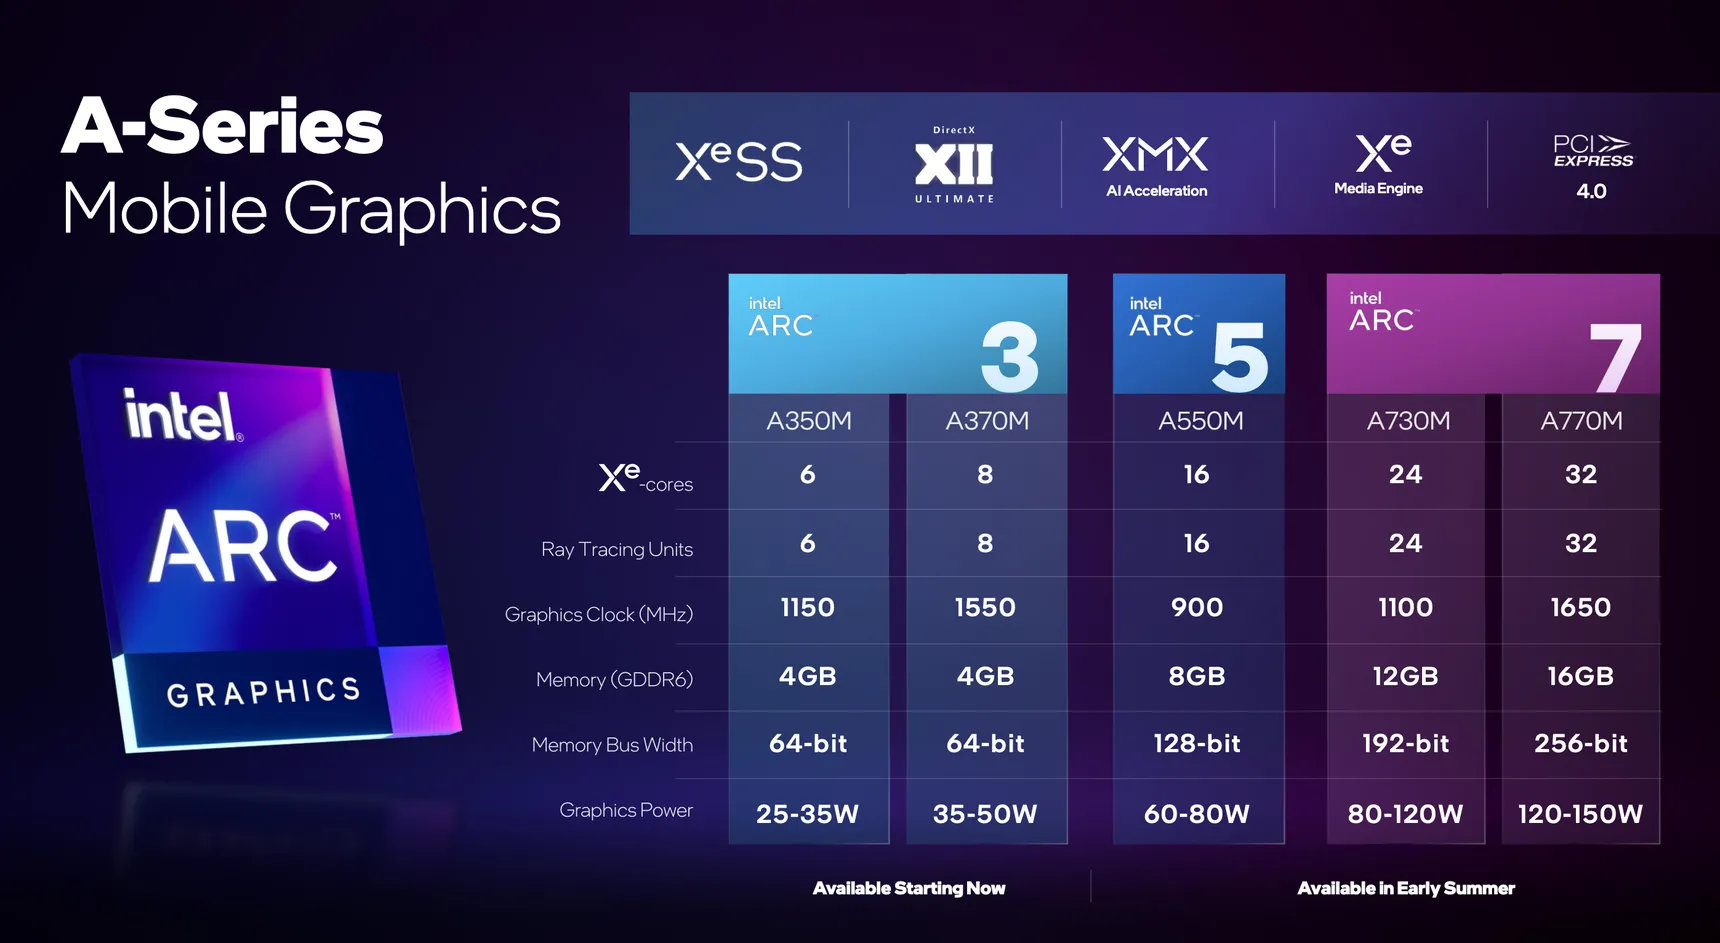
The Intel Arc A350M is a dedicated mobile entry level graphics card for laptops based on Xe HPG microarchitecture. It uses the ACM-G11 chip and offers 6 of the 8 Xe-cores (95 ALUs), 6 of the 8 ray tracing units and a 64-bit memory bus for 4 GB GDDR6 graphics memory. The chip integrates 7.2 billion transistors and the die measures 157 mm2.
The chip also integrates two media engines for VP9, AVC, HEVC, and AV1 8k en- and decoding. The 4 display pipes support up to 4x 4k120 HDR via DMI 2.0B or DisplayPort 2.0 10G.
The A350M is produced in 6nm at TSMC (N6 process) and supports dynamic power share (using Deep Link) with 12th gen Intel CPUs (Alder Lake).
Apple M2 10-Core GPU ► remove from comparison
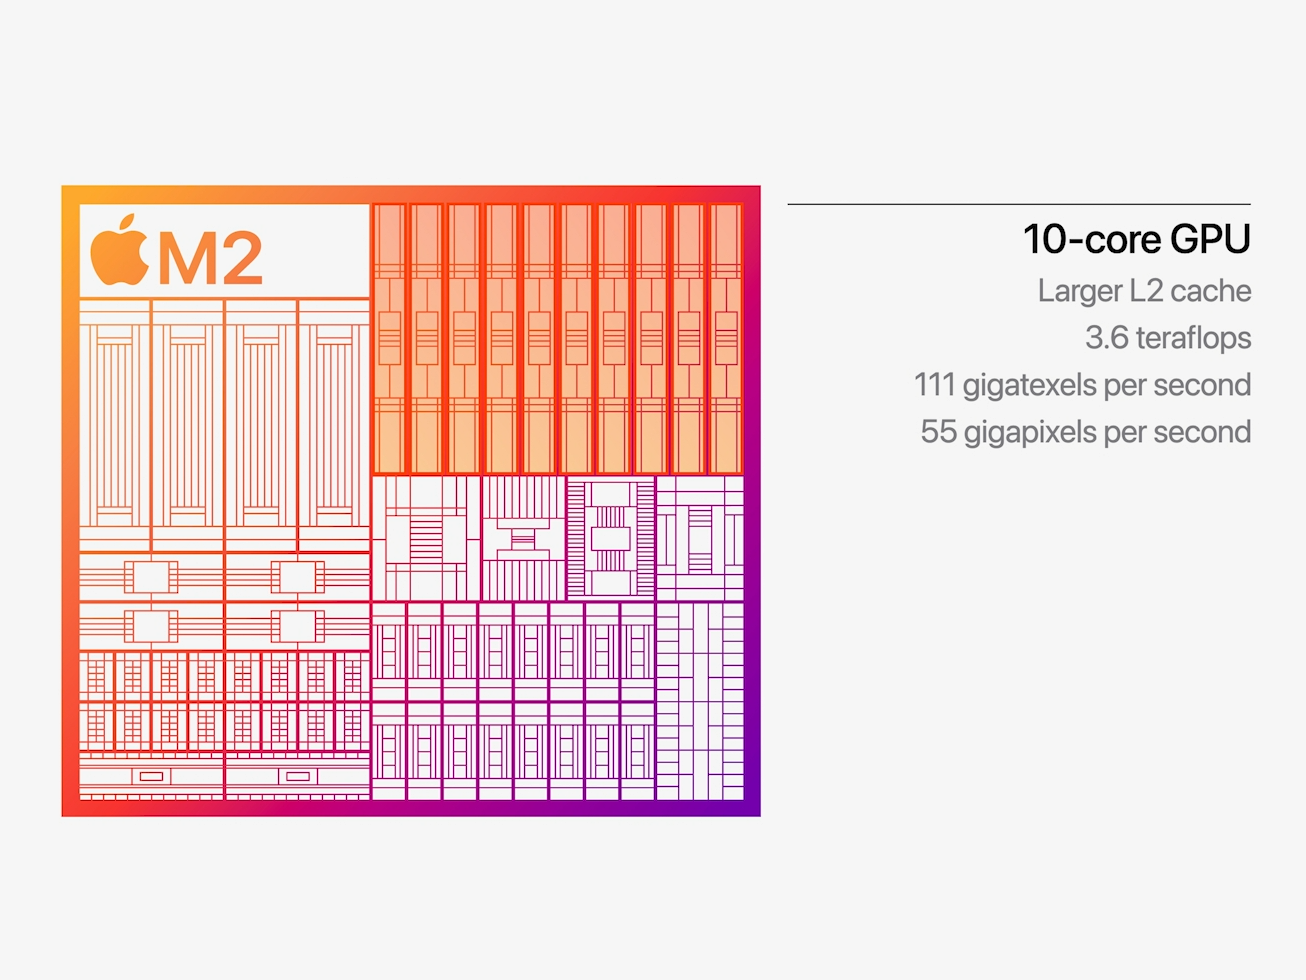
The Apple M2 GPU is an integrated graphics card offering 10 cores designed by Apple and integrated in the Apple M2 SoC . It uses the unified memory architecture of the M2 SoC (up to 24 GB LPDDR5-6400 with 100 GB/s bandwidth) and should offer 160 execution units.
According to Apple it offers a 25% higher performance at slightly higher power consumption. The theoretical performance is rated at 3.6 Teraflops and therefore 1 TFLOP higher than the M1 8-core GPU . In our benchmarks, the GPU was able to top the M1 with up to 40%, but still stays behind the 14-core GPU in the M1 Pro. Compared to other iGPUs from AMD and Intel, the M2 benefits greatly from the unified memory architecture and the high bandwidth.
The M2 chip is manufactured in the second generation 5nm process at TSMC (most likely N5P). The power consumption is around 13.5 Watt (in our tests under load of the MBP13) and up to 15W according to Apple.
Apple M2 Pro 16-Core GPU Intel Arc A350M Apple M2 10-Core GPU Apple M2 Series Arc A770 4096 @ 2.1 - 2.4 GHz 256 Bit @ 16000 MHz Arc A750 3584 @ 2.05 - 2.4 GHz 256 Bit @ 16000 MHz Arc A580 3072 @ 1.7 - 2 GHz 256 Bit @ 16000 MHz A770M 4096 @ 1.65 GHz 256 Bit @ 16000 MHz A730M 3072 @ 1.1 GHz 192 Bit @ 14000 MHz A570M 16 @ 0.9 - 1.3 GHz 128 Bit @ 14000 MHz A550M 16 @ 0.9 - 2.01 GHz 128 Bit @ 14000 MHz A530M 12 @ 0.9 - 1.3 GHz 128 Bit @ 14000 MHz A370M 8 @ 1.55 GHz 64 Bit @ 14000 MHz Arc A380 1024 @ 2 GHz 96 Bit @ 15500 MHz A310 6 @ 2 GHz 64 Bit @ 15500 MHz A350M 6 @ 1.15 GHz 64 Bit @ 14000 MHz
Pipelines 16 - unified 6 - unified 10 - unified Memory Type LPDDR5-6400 GDDR6 LPDDR5-6400 Shared Memory no no no technology 5 nm 6 nm 5 nm Notebook Size medium sized Date of Announcement 17.01.2023 30.03.2022 06.06.2022 Codename Alchemist Architecture Xe HPG Raytracing Cores 6 Core Speed 1150 MHz 1398 (Boost) MHz Cache L1: 1.1 MB, L2: 4 MB Memory Speed 14000 MHz Memory Bus Width 64 Bit Max. Amount of Memory 4 GB Memory Bandwidth 112 GB/s API DirectX 12_2, OpenGL 4.6, Vulkan 1.3 Power Consumption 35 Watt (25 - 35 Watt TGP) 15 Watt Transistors 7.2 Billion Die Size 157 mm² PCIe 4 8x Displays 4 Displays (max.), HDMI 2.0b, DisplayPort 2.0 10G Ready Link to Manufacturer Page ark.intel.com Predecessor M1 8-Core GPU
CPU in M2 Pro 16-Core GPU GPU Base Speed GPU Boost / Turbo Apple M2 Pro 10-Core 10 x 2424 MHz ? MHz ? MHz
CPU in M2 10-Core GPU GPU Base Speed GPU Boost / Turbo Apple M2 8 x 2424 MHz, 20 W ? MHz 1398 MHz
Benchmarks 3DMark - 3DMark Time Spy Score
min: 2976 avg: 3289 median: 3397 (10%) max: 3494 Points
GPU TDP ? TDP 35 W 100% 86%
3DMark - 3DMark Time Spy Graphics
min: 2731 avg: 2993 median: 3050 (8%) max: 3197 Points
GPU TDP ? TDP 35 W 100% 87%
3DMark - 3DMark Cloud Gate Score
min: 23965 avg: 25147 median: 25146.5 (27%) max: 26328 Points
GPU TDP ? TDP 35 W 91% 100%
3DMark - 3DMark Cloud Gate Graphics
min: 28623 avg: 36315 median: 36314.5 (10%) max: 44006 Points
GPU TDP ? TDP 35 W 65% 100%
3DMark - 3DMark Fire Strike Standard Score
min: 5961 avg: 6267 median: 6009 (11%) max: 6832 Points
GPU TDP ? TDP 35 W 100% 94%
3DMark - 3DMark Fire Strike Standard Graphics
min: 6800 avg: 7088 median: 7147 (8%) max: 7318 Points
GPU TDP ? TDP 35 W 100% 94%
3DMark - 3DMark Wild Life Unlimited
19449 Points (10%)
min: 21302 avg: 23924 median: 24236 (12%) max: 25317 Points
GPU TDP ? TDP 13 W TDP 35 W 94% 100% 78%
3DMark - 3DMark Wild Life Extreme Unlimited
11224 Points (13%)
min: 5189 avg: 5300 median: 5299.5 (6%) max: 5410 Points
GPU TDP ? TDP 25 W TDP 35 W 48% 100% 46%
min: 5328 avg: 6533 median: 6823.5 (8%) max: 6987 Points
GPU TDP ? TDP 12 W TDP 13 W TDP 25 W TDP 35 W 54% 62% 61% 100% 46%
3DMark 11 - 3DM11 Performance Score
min: 10123 avg: 10766 median: 10766 (15%) max: 11409 Points
GPU TDP ? TDP 35 W 100% 89%
3DMark 11 - 3DM11 Performance GPU
min: 10687 avg: 10730 median: 10730 (9%) max: 10773 Points
GPU TDP ? TDP 35 W 100% 99%
3DMark Vantage + Intel Arc A350M 3DMark Vantage - 3DM Vant. Perf. total
31023 Points (9%)
3DM Vant. Perf. GPU no PhysX + Intel Arc A350M 3DMark Vantage - 3DM Vant. Perf. GPU no PhysX
28186 Points (16%)
3DMark 06 3DMark 06 - Standard 1280x1024 + Intel Arc A350M
31625 Points (41%)
Unigine Valley 1.0 - Unigine Valley 1.0 DX
19.5 fps (6%)
Blender - Blender 3.3 Classroom METAL *
132 Seconds (14%)
min: 205 avg: 221 median: 221 (23%) max: 237 Seconds
GPU TDP 12 W TDP 13 W TDP 25 W 104% 100% 115%
SPECviewperf 13 specvp13 sw-04 + Intel Arc A350M SPECviewperf 13 - specvp13 sw-04
57.6 fps (15%)
specvp13 snx-03 + Intel Arc A350M SPECviewperf 13 - specvp13 snx-03
3.2 fps (0%)
specvp13 showcase-02 + Intel Arc A350M SPECviewperf 13 - specvp13 showcase-02
27.7 fps (6%)
specvp13 medical-02 + Intel Arc A350M SPECviewperf 13 - specvp13 medical-02
19.9 fps (4%)
specvp13 maya-05 + Intel Arc A350M SPECviewperf 13 - specvp13 maya-05
63.6 fps (7%)
specvp13 energy-02 + Intel Arc A350M SPECviewperf 13 - specvp13 energy-02
11.8 fps (4%)
specvp13 creo-02 + Intel Arc A350M SPECviewperf 13 - specvp13 creo-02
49.1 fps (7%)
specvp13 catia-05 + Intel Arc A350M SPECviewperf 13 - specvp13 catia-05
77 fps (9%)
specvp13 3dsmax-06 + Intel Arc A350M SPECviewperf 13 - specvp13 3dsmax-06
55.7 fps (10%)
SPECviewperf 2020 specvp2020 solidworks-05 1080p + Intel Arc A350M SPECviewperf 2020 - specvp2020 solidworks-05 1080p
17.2 fps (3%)
specvp2020 snx-04 1080p + Intel Arc A350M SPECviewperf 2020 - specvp2020 snx-04 1080p
3.2 fps (1%)
specvp2020 medical-03 1080p + Intel Arc A350M SPECviewperf 2020 - specvp2020 medical-03 1080p
9.1 fps (6%)
specvp2020 maya-06 1080p + Intel Arc A350M SPECviewperf 2020 - specvp2020 maya-06 1080p
72 fps (10%)
specvp2020 energy-03 1080p + Intel Arc A350M SPECviewperf 2020 - specvp2020 energy-03 1080p
12 fps (10%)
specvp2020 creo-03 1080p + Intel Arc A350M SPECviewperf 2020 - specvp2020 creo-03 1080p
30.8 fps (15%)
specvp2020 catia-06 1080p + Intel Arc A350M SPECviewperf 2020 - specvp2020 catia-06 1080p
17.4 fps (11%)
specvp2020 3dsmax-07 1080p + Intel Arc A350M SPECviewperf 2020 - specvp2020 3dsmax-07 1080p
20.9 fps (9%)
Cinebench R15 + Apple M2 Pro 16-Core GPU Cinebench R15 - Cinebench R15 OpenGL 64 Bit
141.9 fps (8%)
Cinebench R15 OpenGL 64 Bit + Intel Arc A350M
min: 138.13 avg: 149.3 median: 149.3 (9%) max: 160.4 fps
GPU TDP ? TDP 25 W TDP 35 W 86% 88% 100%
Cinebench R15 OpenGL 64 Bit + Apple M2 10-Core GPU
min: 128.65 avg: 132.8 median: 131 (8%) max: 140.5 fps
GPU TDP ? TDP 12 W TDP 13 W TDP 25 W TDP 35 W 86% 88% 81% 88% 100%
Cinebench R15 OpenGL Ref. Match 64 Bit + Apple M2 Pro 16-Core GPU Cinebench R15 - Cinebench R15 OpenGL Ref. Match 64 Bit
99.5 % (100%)
Cinebench R15 OpenGL Ref. Match 64 Bit + Intel Arc A350M
97.8 % (98%)
GPU TDP ? TDP 25 W TDP 35 W 98% 100% 98%
Cinebench R15 OpenGL Ref. Match 64 Bit + Apple M2 10-Core GPU
99.5 % (100%)
GPU TDP ? TDP 12 W TDP 13 W TDP 25 W TDP 35 W 98% 100% 100% 100% 98%
GFXBench - GFXBench 5.0 4K Aztec Ruins High Tier Offscreen
78.7 fps (32%)
29.6 fps (12%)
GPU TDP 25 W TDP 35 W 100% 38%
min: 35.6 avg: 43.9 median: 47.9 (19%) max: 48.6 fps
GPU TDP ? TDP 12 W TDP 13 W TDP 25 W TDP 35 W 52% 61% 61% 100% 38%
GFXBench - GFXBench 5.0 Aztec Ruins High Tier Offscreen
181.1 fps (33%)
62.8 fps (11%)
GPU TDP 25 W TDP 35 W 100% 35%
min: 68 avg: 96 median: 102.6 (19%) max: 110 fps
GPU TDP ? TDP 12 W TDP 13 W TDP 25 W TDP 35 W 46% 60% 60% 100% 35%
GFXBench - GFXBench 5.0 Aztec Ruins Normal Tier Offscreen
493 fps (37%)
160 fps (12%)
GPU TDP 25 W TDP 35 W 100% 32%
min: 208 avg: 267.5 median: 283.8 (21%) max: 296 fps
GPU TDP ? TDP 12 W TDP 13 W TDP 25 W TDP 35 W 49% 59% 59% 100% 32%
GFXBench - GFXBench Car Chase Offscreen
389 fps (44%)
125 fps (14%)
GPU TDP 25 W TDP 35 W 100% 32%
min: 136 avg: 197.6 median: 206.1 (23%) max: 232 fps
GPU TDP ? TDP 12 W TDP 13 W TDP 25 W TDP 35 W 49% 60% 51% 100% 32%
GFXBench 3.1 - GFXBench Manhattan ES 3.1 Offscreen
659 fps (14%)
194 fps (4%)
GPU TDP 25 W TDP 35 W 100% 29%
min: 247 avg: 318.6 median: 331.5 (7%) max: 374.6 fps
GPU TDP ? TDP 12 W TDP 13 W TDP 25 W TDP 35 W 46% 57% 48% 100% 29%
GFXBench 3.0 - GFXBench 3.0 Manhattan Offscreen
1011 fps (59%)
309 fps (18%)
GPU TDP 25 W TDP 35 W 100% 31%
min: 411 avg: 503 median: 509.5 (30%) max: 557.2 fps
GPU TDP ? TDP 12 W TDP 13 W TDP 25 W TDP 35 W 46% 55% 53% 100% 31%
GFXBench (DX / GLBenchmark) 2.7 + Apple M2 Pro 16-Core GPU GFXBench (DX / GLBenchmark) 2.7 - GFXBench T-Rex HD Offscreen C24Z16
1815 fps (14%)
GFXBench T-Rex HD Offscreen C24Z16 + Intel Arc A350M
640 fps (5%)
GPU TDP 25 W TDP 35 W 100% 35%
GFXBench T-Rex HD Offscreen C24Z16 + Apple M2 10-Core GPU
min: 628 avg: 824 median: 891.5 (7%) max: 931.9 fps
GPU TDP ? TDP 12 W TDP 13 W TDP 25 W TDP 35 W 40% 51% 51% 100% 35%
Antutu v9 - AnTuTu v9 GPU
min: 654168 avg: 728087 median: 728086 (91%) max: 802005 Points
Geekbench 6.2 - Geekbench 6.2 GPU OpenCL
min: 27880 avg: 27900 median: 27900 (8%) max: 27920 Points
GPU TDP 12 W TDP 13 W 100% 100%
Geekbench 6.2 - Geekbench 6.2 GPU Metal
min: 42013 avg: 44473 median: 45460 (29%) max: 45946 Points
GPU TDP ? TDP 12 W TDP 13 W 91% 100% 99%
LuxMark v2.0 64Bit - LuxMark v2.0 Room GPU
1062 Samples/s (5%)
LuxMark v2.0 64Bit - LuxMark v2.0 Sala GPU
2796 Samples/s (5%)
ComputeMark v2.1 - ComputeMark v2.1 Result
4447 Points (5%)
Power Consumption - Furmark Stress Test Power Consumption - external Monitor *
min: 60.5 avg: 69.4 median: 69.4 (10%) max: 78.3 Watt
GPU TDP ? TDP 35 W 100% 103%
Power Consumption - The Witcher 3 Power Consumption - external Monitor *
47.8 Watt (7%)
min: 53.2 avg: 65.1 median: 65.1 (9%) max: 77 Watt
GPU TDP ? TDP 25 W TDP 35 W 100% 105% 104%
min: 22.8 avg: 27.8 median: 26.9 (4%) max: 34.4 Watt
GPU TDP ? TDP 12 W TDP 13 W TDP 25 W TDP 35 W 100% 108% 108% 105% 104%
Power Consumption - Witcher 3 Power Consumption *
46.6 Watt (10%)
min: 56.7 avg: 71.2 median: 71.2 (16%) max: 85.6 Watt
GPU TDP ? TDP 25 W TDP 35 W 100% 111% 108%
min: 27.8 avg: 32.5 median: 30.8 (7%) max: 38.9 Watt
GPU TDP ? TDP 13 W TDP 25 W TDP 35 W 100% 114% 111% 108%
Power Consumption - GFXBench Aztec Ruins Normal Tier Offscreen Power Consumption 150cd *
min: 16 avg: 16.5 median: 16.7 (6%) max: 16.7 Watt
Power Consumption - Witcher 3 ultra Power Efficiency
1 fps per Watt (87%)
min: 0.2395 avg: 0.3 median: 0.3 (25%) max: 0.3245 fps per Watt
GPU TDP ? TDP 25 W TDP 35 W 25% 100% 34%
min: 1.007 avg: 1 median: 1 (91%) max: 1.108 fps per Watt
GPU TDP ? TDP 13 W TDP 25 W TDP 35 W 24% 100% 96% 32%
Power Consumption - Witcher 3 ultra Power Efficiency - external Monitor
0.9 fps per Watt (78%)
0.3 fps per Watt (29%)
GPU TDP 25 W TDP 35 W 100% 37%
min: 1.116 avg: 1.1 median: 1.1 (92%) max: 1.207 fps per Watt
GPU TDP 13 W TDP 25 W TDP 35 W 100% 84% 31%
Emissions Witcher 3 Fan Noise + Intel Arc A350M Emissions - Witcher 3 Fan Noise
47.5 dB(A) (76%)
Witcher 3 Fan Noise + Apple M2 10-Core GPU
34.6 dB(A) (55%)
GPU TDP 13 W TDP 35 W 73% 100%
Average Benchmarks Apple M2 Pro 16-Core GPU → 100% n=10 Average Benchmarks Intel Arc A350M → 48% n=10 Average Benchmarks Apple M2 10-Core GPU → 63% n=10
- Range of benchmark values for this graphics card
- Average benchmark values for this graphics card
* Smaller numbers mean a higher performance
1 This benchmark is not used for the average calculation
Game Benchmarks The following benchmarks stem from our benchmarks of review laptops. The performance depends on the used graphics memory, clock rate, processor, system settings, drivers, and operating systems. So the results don't have to be representative for all laptops with this GPU. For detailed information on the benchmark results, click on the fps number.
100%
M2 Pro 16-Core GPU:
80.8 fps
100%
M2 Pro 16-Core GPU:
52 fps
100%
M2 Pro 16-Core GPU:
38 fps
100%
M2 Pro 16-Core GPU:
28.9 fps
100%
M2 Pro 16-Core GPU:
258 fps
100%
M2 Pro 16-Core GPU:
75 fps
100%
M2 Pro 16-Core GPU:
48 fps
100%
M2 Pro 16-Core GPU:
36 fps
100%
M2 Pro 16-Core GPU:
22 fps
100%
M2 Pro 16-Core GPU:
159 fps
50%
M2 10-Core GPU:
60 76 102 ~ 79 fps
100%
M2 Pro 16-Core GPU:
72 fps
100%
M2 Pro 16-Core GPU:
65 fps
100%
M2 Pro 16-Core GPU:
57 fps
100%
M2 Pro 16-Core GPU:
36 fps
56%
M2 10-Core GPU:
20 fps
100%
M2 Pro 16-Core GPU:
51 fps
67%
M2 10-Core GPU:
34 fps
100%
M2 Pro 16-Core GPU:
45 fps
62%
M2 10-Core GPU:
28 fps
100%
M2 Pro 16-Core GPU:
76 fps
100%
M2 Pro 16-Core GPU:
73 fps
100%
M2 Pro 16-Core GPU:
46 fps
Average Gaming Apple M2 Pro 16-Core GPU → 100% Average Gaming 30-70 fps → 100%
Average Gaming Intel Arc A350M → 118% Average Gaming 30-70 fps → 82%
Average Gaming Apple M2 10-Core GPU → 57% Average Gaming 30-70 fps → 61%
 Deutsch
 English
 Español
 Français
 Italiano
 Nederlands
 Polski
 Português
 Русский
 Türkçe
 Svenska
 Chinese
 Magyar