Notebookcheck Logo

Apple M2 Max vs Intel Core i9-10980HK

Apple M2 Max

► remove from comparison Apple M2 Max

The Apple M2 Max is a System on a Chip (SoC) from Apple that is found in the early 2023 MacBook Pro 14 and 16-inch models. It offers all 12 CPU cores available in the chip divided in eight performance cores (P-cores) and four power-efficiency cores (E-cores). The E-cores clock with up to 3.4 GHz, the P-Cores up to 3.7 GHz (mostly 3.3 GHz in multi-threaded workloads and 3.4 GHz in single threaded).

The big cores (codename Avalanche) offer 192 KB instruction cache, 128 KB data cache, and 36 MB shared L2 cache (up from 24 MB in the M1 Pro). The four efficiency cores (codename Blizzard) are a lot smaller and offer only 128 KB instruction cache, 64 KB data cache, and 4 MB shared cache. CPU and GPU can both use the 49 MB SLC (System Level Cache). 

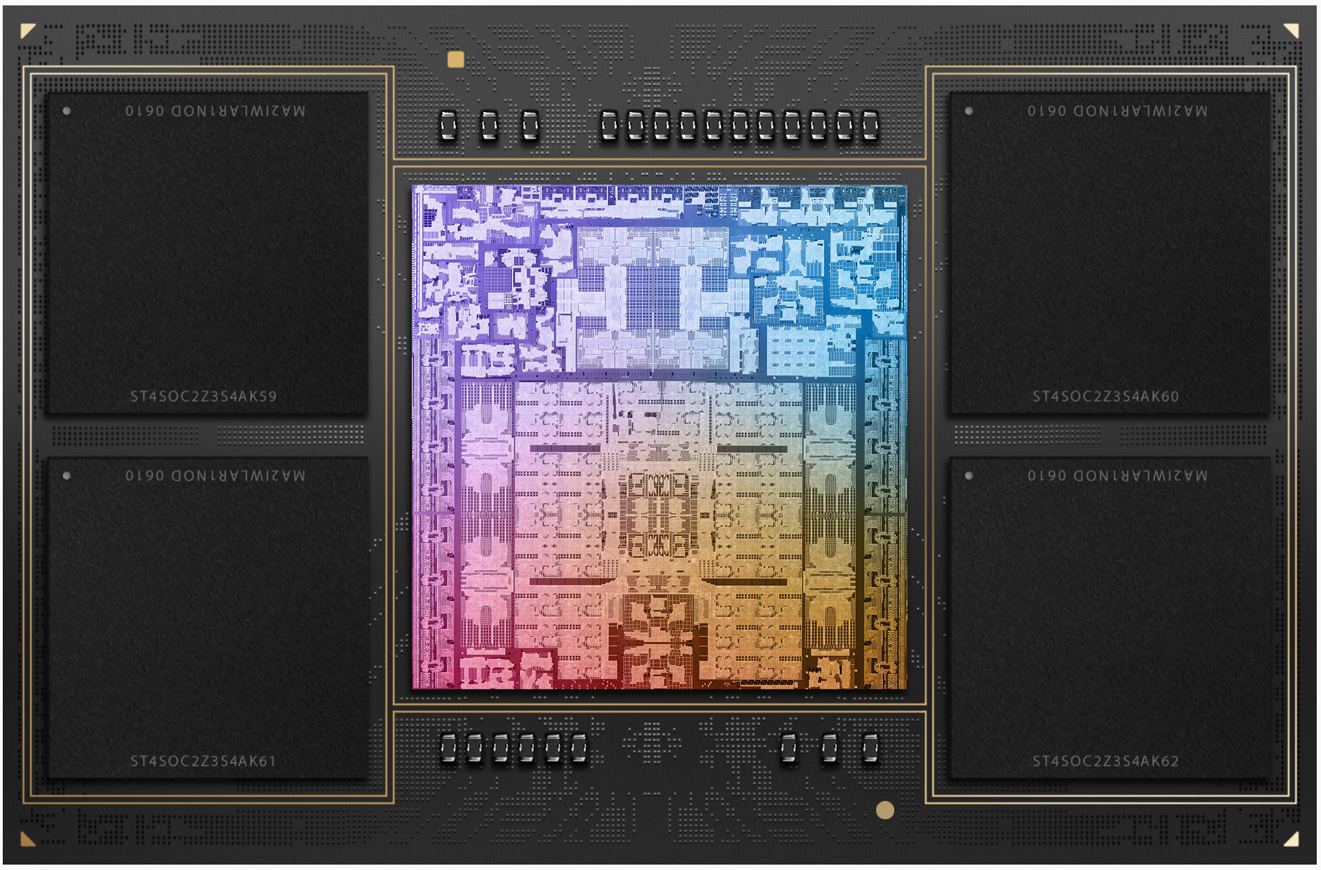
The unified memory (32, 64, or 96 GB LPDDR5-6400) next to the chip is connected by a 512 Bit memory controller (400 GB/s bandwidth) and can be used by the GPU and CPU.

The CPU performance should be quite similar to the M2 Pro as only the higher memory bandwidth and bigger L3 cache could make a difference for some workloads.

The integrated graphics card in the M1 Max offers a 30-core GPU or a GPU with all 38 cores.

Furthermore, the SoC integrates a fast 16 core neural engine (faster than M1 Max), a secure enclave (e.g., for encryption), a unified memory architecture, Thunderbolt 4 controller, an ISP, and media de- and encoders (including ProRes).

The M2 Max is manufactured in 5 nm at TSMC (second generation) and integrates 40 billion transistors. The power consumption of the CPU part is up to 36 Watt according to powermetrics. When fully loading the CPU and GPU cores, the chip uses up to 89 Watt and the CPU part is limited to 25 Watt.

Intel Core i9-10980HK

► remove from comparison Intel i9-10980HK

The Intel Core i9-10980HK is a high-end processor for laptops with eight cores based on the Comet Lake architecture (CML-H, 4th generation of Skylake). The processor clocks at between 2.4 and 5.3 GHz (all 8 cores up to 4.4 GHz) and can execute up to sixteen threads simultaneously thanks to Hyper-Threading. The 5.3 GHz can be only achieved below 65°C core temperature (Thermal Velocity Boost), between 65 and 85°C, 5.2 GHz are the maximum and above that 5.1 with restrictions (Turbo Boost 3.0).

The processor is still manufactured in the old 14nm (14nm++) process. Compared to the predecessor, the Core i9-9980HK, the 10980HK probably offers only increased base clock rates (and maybe multi core turbo clocks). Thanks to the free multiplicator, the CPU can also be easily overclocked (but may not have much headroom).

The Comet Lake architecture is similar to Coffee Lake and offers the same features and is produced in the same 14nm process. Other than the improved clock rates, the memory controller now also supports faster DDR4-2933 RAM. More information on Comet Lake and all the models and articles on it can be found here.

The Core i7-10750H supports no vPro, TXT or SIPP. These business features are available in the similar (and later released) Core i9-10885H (2.4 - 5.3 GHz).

Performance

The performance of the Core i9-10980HK should be higher than the old Core i9-9980HK (2.4 - 5 GHz) thanks to the increased turbo clock speeds. Thanks to the 8 cores and high Turbo speeds, even demanding applications should run very good on the CPU. However, long term performance is always depending on the laptop cooling system and system configuration. At the time of announcement, the i9-10980HK is the fastest Comet Lake-H CPU and fastest laptop CPU on the market. 

Graphics

The integrated Intel UHD Graphics 630 iGPU is supposed to offer a similar performance as the UHD630 in the Core i7-9980HK. As a  low-end solution it will only run current games smoothly at reduced details - if at all.

Power Consumption

Intel specifies the TDP with 45 watts and therefore the i9 is only suited for big laptops with good cooling solutions. Using cTDP-down, the CPU can also be configured to 35 Watt resulting in a reduced performance.

Beware, the CPU was not yet released at the time of writing and the information is based on leaks and early information.

ModelApple M2 MaxIntel Core i9-10980HK
SeriesApple Apple M2Intel Comet Lake
Series: Comet Lake Comet Lake-H
Apple M2 Max « 2.42 - 3.7 GHz12 / 12 cores48 MB L3
Apple M2 Pro compare2.42 - 3.5 GHz12 / 12 cores24 MB L3
Apple M2 Pro 10-Core compare2.42 - 3.7 GHz10 / 10 cores24 MB L3
Apple M2 compare2.42 - 3.48 GHz8 / 8 cores8 MB L3
Intel Core i9-10980HK « 2.4 - 5.3 GHz8 / 16 cores16 MB L3
Intel Xeon W-10885M compare2.4 - 5.3 GHz8 / 16 cores16 MB L3
Intel Core i9-10885H compare2.4 - 5.3 GHz8 / 16 cores16 MB L3
Intel Core i9-10880H compare2.3 - 5.1 GHz8 / 16 cores16 MB L3
Intel Core i7-10875H compare2.3 - 5.1 GHz8 / 16 cores16 MB L3
Intel Core i7-10870H compare2.2 - 5 GHz8 / 16 cores16 MB L3
Intel Core i7-10850H compare2.7 - 5.1 GHz6 / 12 cores12 MB L3
Intel Xeon W-10855M compare2.8 - 5.1 GHz6 / 12 cores12 MB L3
Intel Core i7-10750H compare2.6 - 5 GHz6 / 12 cores12 MB L3
Intel Core i5-10500H compare2.5 - 4.5 GHz6 / 12 cores12 MB L3
Intel Core i5-10400H compare2.6 - 4.6 GHz4 / 8 cores8 MB L3
Intel Core i5-10300H compare2.5 - 4.5 GHz4 / 8 cores8 MB L3
Intel Core i5-10200H compare2.4 - 4.1 GHz4 / 8 cores8 MB L3
Clock2424 - 3696 MHz2400 - 5300 MHz
L1 Cache3.3 MB512 KB
L2 Cache36 MB2 MB
L3 Cache48 MB16 MB
Cores / Threads12 / 128 / 16
TDP79 Watt45 Watt
Transistors67000 Million
Technology5 nm14 nm
FeaturesARMv8 Instruction SetDual-Channel DDR4 Memory Controller, HyperThreading, AVX, AVX2, Quick Sync, Virtualization, AES-NI
iGPUApple M2 Max 38-Core GPUIntel UHD Graphics 630 (350 - 1250 MHz)
ArchitectureARMx86
Announced
CodenameComet Lake-H
max. Temp.100 °C
SocketFCBGA1440
$583 U.S.
Manufacturerark.intel.com

Benchmarks

Performance Rating - CB R15 + R20 + 7-Zip + X265 + Blender + 3DM11 CPU - i9-10980HK
36.4 pt (50%)
Cinebench R23 - Cinebench R23 Multi Core
min: 14738     avg: 14753     median: 14752.5 (14%)     max: 14767 Points
min: 9597     avg: 10605     median: 10590.5 (10%)     max: 11641 Points
Cinebench R23 - Cinebench R23 Single Core
min: 1625     avg: 1644     median: 1643.5 (70%)     max: 1662 Points
min: 1228     avg: 1277     median: 1287 (55%)     max: 1305 Points
Cinebench R20 - Cinebench R20 CPU (Single Core)
min: 451     avg: 455.5     median: 455.5 (51%)     max: 460 Points
min: 465     avg: 488.2     median: 489 (54%)     max: 507 Points
Cinebench R20 - Cinebench R20 CPU (Multi Core)
min: 4044     avg: 4065     median: 4064.5 (10%)     max: 4085 Points
min: 3526     avg: 3933     median: 3883 (9%)     max: 4487 Points
Cinebench R15 - Cinebench R15 CPU Multi 64 Bit
min: 2074     avg: 2084     median: 2084 (13%)     max: 2094 Points
min: 1606     avg: 1739     median: 1737 (11%)     max: 1862 Points
Cinebench R15 - Cinebench R15 CPU Single 64 Bit
min: 233     avg: 236     median: 236 (71%)     max: 239 Points
min: 198     avg: 206.7     median: 206 (62%)     max: 219 Points
WinRAR - WinRAR 4.0
6869 Points (11%)
7-Zip 18.03 - 7-Zip 18.03 Multli Thread 4 runs
min: 43786     avg: 47126     median: 47455 (27%)     max: 49275 MIPS
7-Zip 18.03 - 7-Zip 18.03 Single Thread 4 runs
min: 5081     avg: 5386     median: 5437 (65%)     max: 5542 MIPS
X264 HD Benchmark 4.0 - x264 Pass 2
98.2 fps (34%)
X264 HD Benchmark 4.0 - x264 Pass 1
238.5 fps (55%)
HWBOT x265 Benchmark v2.2 - HWBOT x265 4k Preset
min: 12     avg: 13     median: 13 (23%)     max: 14.6 fps
TrueCrypt - TrueCrypt Serpent
1.1 GB/s (0%)
TrueCrypt - TrueCrypt Twofish
1.8 GB/s (31%)
TrueCrypt - TrueCrypt AES
10.1 GB/s (26%)
Blender - Blender 3.3 Classroom CPU *
100%
1 M2 Max +
326 Seconds (4%)
Blender - Blender 2.79 BMW27 CPU *
333 Seconds (2%)
min: 239     avg: 277.4     median: 279 (2%)     max: 299 Seconds
R Benchmark 2.5 - R Benchmark 2.5 *
min: 0.561     avg: 0.6     median: 0.6 (12%)     max: 0.596 sec
3DMark 06 - CPU - 3DMark 06 - CPU
min: 13573     avg: 13765     median: 13765 (29%)     max: 13957 Points
Super Pi mod 1.5 XS 1M - Super Pi mod 1.5 XS 1M *
7.8 s (2%)
Super Pi mod 1.5 XS 2M - Super Pi mod 1.5 XS 2M *
17.2 s (1%)
Super Pi Mod 1.5 XS 32M - Super Pi mod 1.5 XS 32M *
449 s (2%)
3DMark Vantage - 3DM Vant. Perf. CPU no Physx
min: 54332     avg: 56780     median: 56779.5 (50%)     max: 59227 Points
3DMark 11 - 3DM11 Performance Physics
min: 13629     avg: 16455     median: 16268 (44%)     max: 19000 Points
3DMark - 3DMark Ice Storm Unlimited Physics
67714 Points (57%)
3DMark - 3DMark Cloud Gate Physics
min: 14150     avg: 15807     median: 16163 (41%)     max: 17016 Points
3DMark - 3DMark Fire Strike Standard Physics
min: 19789     avg: 21270     median: 21190.5 (38%)     max: 22476 Points
3DMark - 3DMark Time Spy CPU
min: 8448     avg: 9352     median: 9439 (40%)     max: 10020 Points
Geekbench 6.2 - Geekbench 6.2 Single-Core
100%
1 M2 Max +
2692 Points (72%)
Geekbench 6.2 - Geekbench 6.2 Multi-Core
100%
1 M2 Max +
14863 Points (59%)
Geekbench 5.5 - Geekbench 5.1 - 5.4 64 Bit Single-Core
min: 1965     avg: 1970     median: 1967 (83%)     max: 1978 Points
min: 1283     avg: 1339     median: 1347.5 (57%)     max: 1401 Points
Geekbench 5.5 - Geekbench 5.1 - 5.4 64 Bit Multi-Core
min: 15348     avg: 15388     median: 15373 (28%)     max: 15444 Points
min: 7634     avg: 8175     median: 8155.5 (15%)     max: 8666 Points
Geekbench 5.0 - Geekbench 5.0 64 Bit Single-Core
min: 1222     avg: 1317     median: 1349 (6%)     max: 1380 Points
Geekbench 5.0 - Geekbench 5.0 64 Bit Multi-Core
min: 7597     avg: 7969     median: 8010 (25%)     max: 8300 Points
Geekbench 4.4 - Geekbench 4.1 - 4.4 64 Bit Single-Core
min: 5615     avg: 5935     median: 5971 (60%)     max: 6218 Points
Geekbench 4.4 - Geekbench 4.1 - 4.4 64 Bit Multi-Core
min: 29927     avg: 31196     median: 30973 (34%)     max: 32688 Points
Geekbench 4.0 - Geekbench 4.0 64 Bit Single-Core
5687 Points (77%)
Geekbench 4.0 - Geekbench 4.0 64 Bit Multi-Core
30205 Points (74%)
Mozilla Kraken 1.1 - Kraken 1.1 Total Score *
min: 430.2     avg: 437.2     median: 437.2 (1%)     max: 444.2 ms
min: 722     avg: 748     median: 745 (1%)     max: 764 ms
Octane V2 - Octane V2 Total Score
min: 76610     avg: 77676     median: 77676 (68%)     max: 78742 Points
57793 Points (51%)
WebXPRT 4 - WebXPRT 4 Score
100%
1 M2 Max +
min: 258     avg: 259     median: 259 (74%)     max: 260 Points
WebXPRT 3 - WebXPRT 3 Score
min: 402     avg: 404.5     median: 404.5 (84%)     max: 407 Points
min: 232     avg: 242.9     median: 243 (51%)     max: 252 Points
CrossMark - CrossMark Overall
100%
1 M2 Max +
min: 1759     avg: 1835     median: 1834.5 (70%)     max: 1910 Points
Power Consumption - Prime95 Power Consumption - external Monitor *
min: 139     avg: 149.5     median: 149.5 (26%)     max: 160 Watt
Power Consumption - Cinebench R15 Multi Power Consumption - external Monitor *
100%
1 M2 Max +
72.8 Watt (13%)
min: 147     avg: 170.5     median: 170.5 (31%)     max: 194 Watt
Power Consumption - Idle Power Consumption - external Monitor *
100%
1 M2 Max +
9.2 Watt (6%)
Power Consumption - Cinebench R15 Multi Power Efficiency - external Monitor
100%
1 M2 Max +
28.5 Points per Watt (21%)
min: 9.05     avg: 10.2     median: 10.2 (8%)     max: 11.4 Points per Watt

Average Benchmarks Apple M2 Max → 100% n=12

Average Benchmarks Intel Core i9-10980HK → 82% n=12

- Range of benchmark values for this graphics card
- Average benchmark values for this graphics card
* Smaller numbers mean a higher performance
1 This benchmark is not used for the average calculation

Add one or more devices and compare

In the following list you can select (and also search for) devices that should be added to the comparison. You can select more than one device.

restrict list:

show all (including archived), 2024, 2023
v1.28
log 04. 09:57:26

#0 checking url part for id 14975 +0s ... 0s

#1 checking url part for id 11873 +0s ... 0s

#2 redirected to Ajax server, took 1720079846 +0s ... 0s

#3 did not recreate cache, as it is less than 5 days old! Created at Thu, 04 Jul 2024 05:15:21 +0200 +0s ... 0s

#4 composed specs +0.005s ... 0.005s

#5 did output specs +0s ... 0.005s

#6 getting avg benchmarks for device 14975 +0.001s ... 0.006s

#7 got single benchmarks 14975 +0.005s ... 0.01s

#8 getting avg benchmarks for device 11873 +0.004s ... 0.015s

#9 got single benchmarks 11873 +0.019s ... 0.034s

#10 got avg benchmarks for devices +0s ... 0.034s

#11 min, max, avg, median took s +0.031s ... 0.064s

#12 return log +0.002s ... 0.067s

Please share our article, every link counts!
> Expert Reviews and News on Laptops, Smartphones and Tech Innovations > Benchmarks / Tech > Processor Comparison - Head 2 Head
Redaktion, 2017-09- 8 (Update: 2023-07- 1)