Notebookcheck Logo

Apple M2 Max vs Microsoft SQ1 vs Apple M2 Pro

Apple M2 Max

► remove from comparison Apple M2 Max

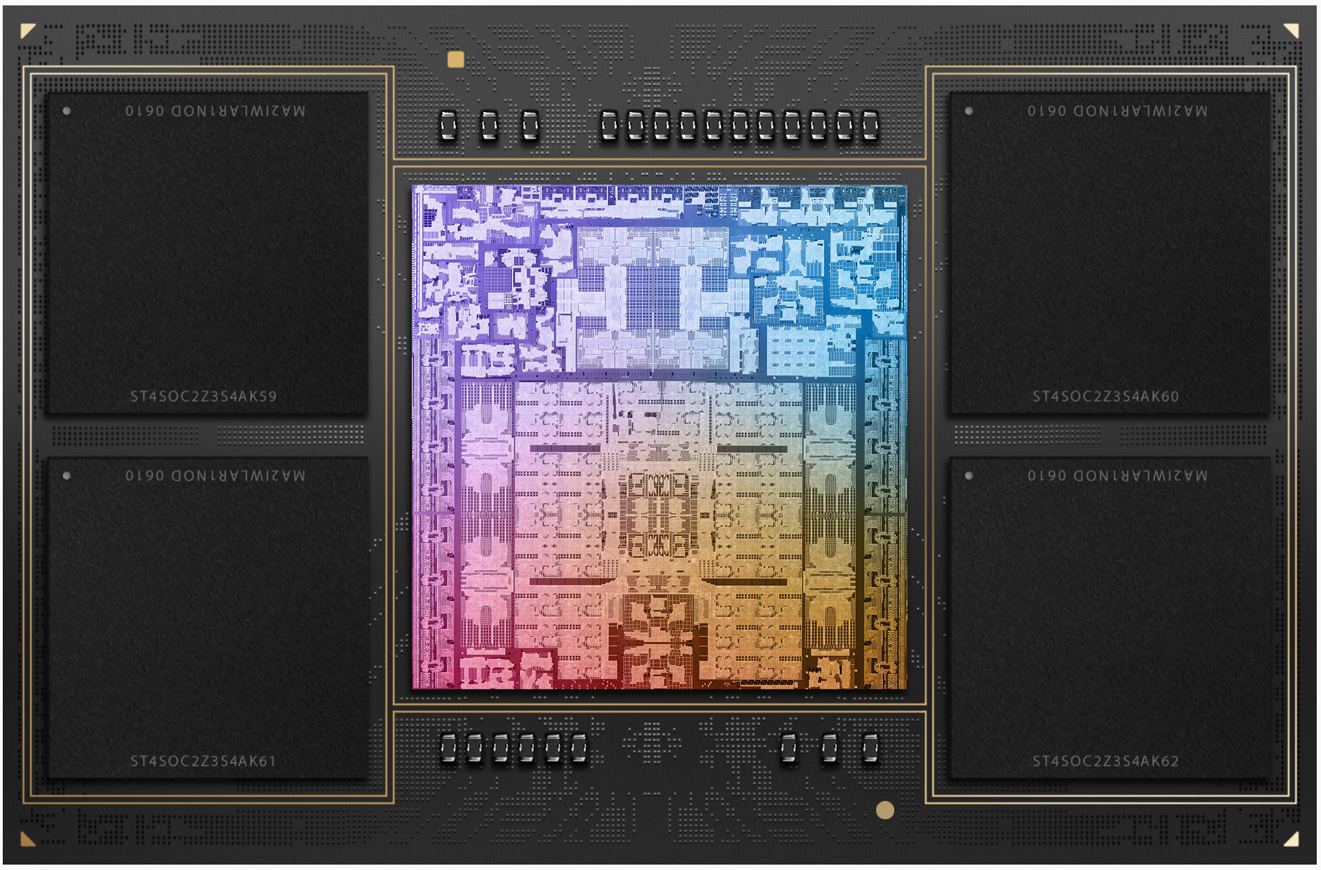
The Apple M2 Max is a System on a Chip (SoC) from Apple that is found in the early 2023 MacBook Pro 14 and 16-inch models. It offers all 12 CPU cores available in the chip divided in eight performance cores (P-cores) and four power-efficiency cores (E-cores). The E-cores clock with up to 3.4 GHz, the P-Cores up to 3.7 GHz (mostly 3.3 GHz in multi-threaded workloads and 3.4 GHz in single threaded).

The big cores (codename Avalanche) offer 192 KB instruction cache, 128 KB data cache, and 36 MB shared L2 cache (up from 24 MB in the M1 Pro). The four efficiency cores (codename Blizzard) are a lot smaller and offer only 128 KB instruction cache, 64 KB data cache, and 4 MB shared cache. CPU and GPU can both use the 49 MB SLC (System Level Cache). 

The unified memory (32, 64, or 96 GB LPDDR5-6400) next to the chip is connected by a 512 Bit memory controller (400 GB/s bandwidth) and can be used by the GPU and CPU.

The CPU performance should be quite similar to the M2 Pro as only the higher memory bandwidth and bigger L3 cache could make a difference for some workloads.

The integrated graphics card in the M1 Max offers a 30-core GPU or a GPU with all 38 cores.

Furthermore, the SoC integrates a fast 16 core neural engine (faster than M1 Max), a secure enclave (e.g., for encryption), a unified memory architecture, Thunderbolt 4 controller, an ISP, and media de- and encoders (including ProRes).

The M2 Max is manufactured in 5 nm at TSMC (second generation) and integrates 40 billion transistors. The power consumption of the CPU part is up to 36 Watt according to powermetrics. When fully loading the CPU and GPU cores, the chip uses up to 89 Watt and the CPU part is limited to 25 Watt.

Microsoft SQ1

► remove from comparison Qualcomm SQ1

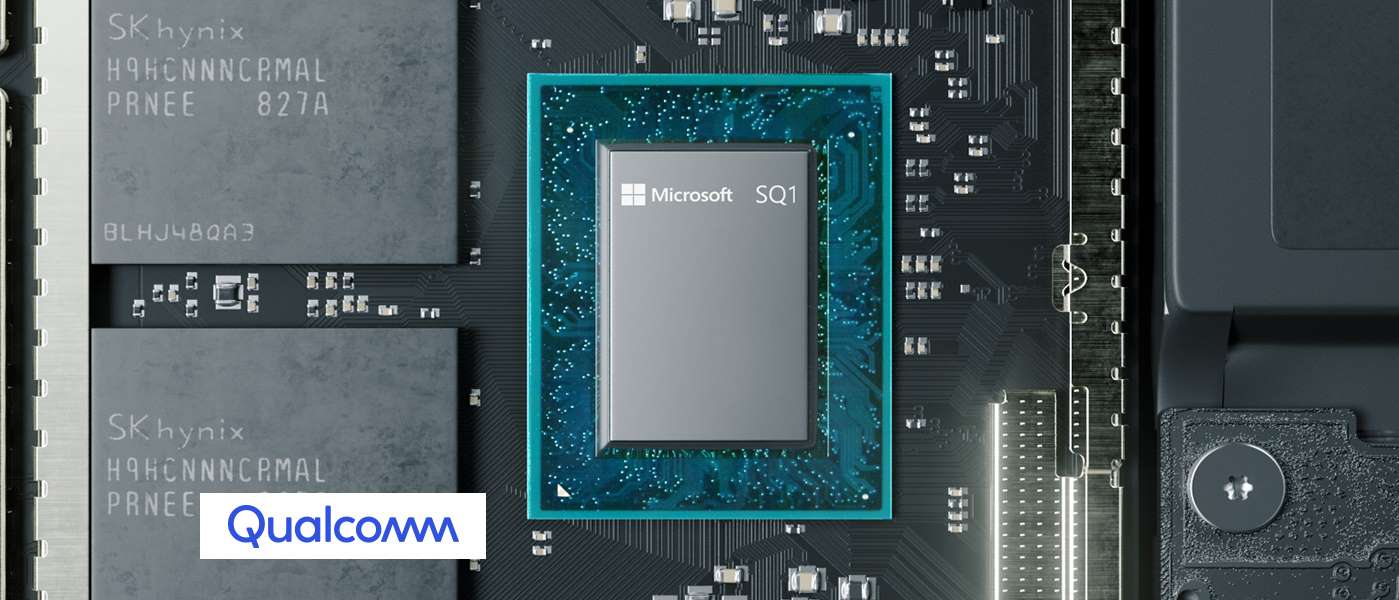
The Microsoft SQ1 is a ARM based SoC for Windows tablets (Surface Pro X). It is based on the Snapdragon 8cx but with higher clocked CPU and GPU cores. The CPU cores clock with up to 3 GHz. The 4 Kryo 495 Gold cores are based on the ARM Cortex-A76 architecture (for performance) and clocked at up to 3 GHz (2.84 GHz  for the 8cx) under load (no single core Turbo). The 4 Kryo 495 Silver cores are small ARM Cortex-A55 cores for power efficiency and clocked at 1.9 GHz (unverified) under load. The integrated X24 LTE modem supports up to 2 Gbps download speeds. Furthermore, the SoC integrates ac-Wifi and a dual-channel 32-bit 1866 MHz LPDDR4x memory controller.

The processor performance should be similar to a Intel Core i5 8th gen U-series (e.g. i5-8250U) according to Qualcomm. However, this is only the case for native ARM64 compiled Windows apps which are not that many (in mid 2019). 32 bit applications and games for AMD/Intel run in a rather slow emulation and 65 bit apps wont start at all.

The integrated Adreno 685 graphics card is a higher clocked version of the Adreno 680 in the Snapdragon 8cx. Microsoft claims 2 TFlops theoretical performance compared to the 1.8 for the Adreno 680 (+11%).

The chip is very power efficient as its produced at TSMC in the modern 7 process. Therefore, laptops using the Snapdragon 8cx can be passively cooled (no fan) and should not throttle under constant load.

Apple M2 Pro

► remove from comparison Apple M2 Pro

The Apple M2 Pro is a System on a Chip (SoC) from Apple that is found in the early 2023 MacBook Pro 14 and 16-inch models. It offers all 12 cores available in the chip divided in eight performance cores (P-cores) and four power-efficiency cores (E-cores). The E-cores clock with up to 3.4 GHz, the P-Cores up to 3.7 GHz (mostly 3.3 GHz in multi-threaded workloads and 3.4 GHz in single threaded).

The big cores (codename Avalanche) offer 192 KB instruction cache, 128 KB data cache, and 36 MB shared L2 cache (up from 24 MB in the M1 Pro). The four efficiency cores (codename Blizzard) are a lot smaller and offer only 128 KB instruction cache, 64 KB data cache, and 4 MB shared cache. CPU and GPU can both use the 24 MB SLC (System Level Cache). 

The unified memory (16 or 32 GB LPDDR5-6400) next to the chip is connected by a 256 Bit memory controller (200 GB/s bandwidth) and can be used by the GPU and CPU.

Apple states that the M2 Pro has a 25% higher performance than the M1 Pro in Xcode compiling.

The integrated graphics card in the M1 Pro offers all 19 cores.

Furthermore, the SoC integrates a fast 16 core neural engine (faster than M1 Pro), a secure enclave (e.g., for encryption), a unified memory architecture, Thunderbolt 4 controller, an ISP, and media de- and encoders (including ProRes).

The M2 Pro is manufactured in 5 nm at TSMC (second generation) and integrates 40 billion transistors. 

ModelApple M2 MaxMicrosoft SQ1Apple M2 Pro
SeriesApple Apple M2Qualcomm SnapdragonApple Apple M2
Series: Apple M2
Apple M2 Max « 2.42 - 3.7 GHz12 / 12 cores48 MB L3
Apple M2 Pro2.42 - 3.5 GHz12 / 12 cores24 MB L3
Apple M2 Pro 10-Core2.42 - 3.7 GHz10 / 10 cores24 MB L3
Apple M22.42 - 3.48 GHz8 / 8 cores8 MB L3
Qualcomm Snapdragon 8cx Gen 2 5G3.15 GHz8 / 8 cores2 MB L3 Cortex-A76 / A55 (Kryo 495)
Microsoft SQ1 « 3 GHz8 / 8 cores2 MB L3 Cortex-A76 / A55 (Kryo 495)
Qualcomm Snapdragon 8cx2.84 GHz8 / 8 cores2 MB L3 Cortex-A76 / A55 (Kryo 495)
Apple M2 Max2.42 - 3.7 GHz12 / 12 cores48 MB L3
Apple M2 Pro « 2.42 - 3.5 GHz12 / 12 cores24 MB L3
Apple M2 Pro 10-Core2.42 - 3.7 GHz10 / 10 cores24 MB L3
Apple M22.42 - 3.48 GHz8 / 8 cores8 MB L3
Clock2424 - 3696 MHz3000 MHz2424 - 3504 MHz
L1 Cache3.3 MB3.3 MB
L2 Cache36 MB36 MB
L3 Cache48 MB2 MB24 MB
Cores / Threads12 / 128 / 812 / 12
TDP79 Watt
Transistors67000 Million40000 Million
Technology5 nm7 nm5 nm
FeaturesARMv8 Instruction SetX24 LTE Modem, Adreno 685 GPUARMv8 Instruction Set
iGPUApple M2 Max 38-Core GPUQualcomm Adreno 685Apple M2 Pro 19-Core GPU
ArchitectureARMARMARM
Announced
CodenameCortex-A76 / A55 (Kryo 495)
Manufacturerwww.microsoft.com

Benchmarks

Cinebench 2024 - Cinebench 2024 CPU Single Core
100%
1 M2 Pro +
123 Points (85%)
Cinebench 2024 - Cinebench 2024 CPU Multi Core
100%
1 M2 Pro +
1030 Points (19%)
Cinebench R23 - Cinebench R23 Multi Core
100%
1 M2 Max +
min: 14738     avg: 14753     median: 14752.5 (14%)     max: 14767 Points
100%
1 M2 Pro +
min: 14787     avg: 14795     median: 14794.5 (14%)     max: 14802 Points
Cinebench R23 - Cinebench R23 Single Core
100%
1 M2 Max +
min: 1625     avg: 1644     median: 1643.5 (70%)     max: 1662 Points
100%
1 M2 Pro +
min: 1647     avg: 1648     median: 1647.5 (70%)     max: 1648 Points
Cinebench R20 - Cinebench R20 CPU (Single Core)
100%
1 M2 Max +
min: 451     avg: 455.5     median: 455.5 (51%)     max: 460 Points
98%
1 M2 Pro +
min: 446     avg: 446.5     median: 446.5 (50%)     max: 447 Points
Cinebench R20 - Cinebench R20 CPU (Multi Core)
100%
1 M2 Max +
min: 4044     avg: 4065     median: 4064.5 (10%)     max: 4085 Points
99%
1 M2 Pro +
min: 4018     avg: 4031     median: 4031 (10%)     max: 4044 Points
Cinebench R15 - Cinebench R15 CPU Multi 64 Bit
100%
1 M2 Max +
min: 2074     avg: 2084     median: 2084 (13%)     max: 2094 Points
99%
1 M2 Pro +
2069 Points (13%)
Cinebench R15 - Cinebench R15 CPU Single 64 Bit
100%
1 M2 Max +
min: 233     avg: 236     median: 236 (71%)     max: 239 Points
97%
1 M2 Pro +
230 Points (69%)
Cinebench R10 - Cinebench R10 Rend. Single (32bit)
100%
1 SQ1 +
537 Points (3%)
Cinebench R10 - Cinebench R10 Rend. Multi (32bit)
100%
1 SQ1 +
4276 Points (3%)
wPrime 2.10 - wPrime 2.0 1024m *
100%
1 SQ1 +
429.3 s (5%)
wPrime 2.10 - wPrime 2.0 32m *
100%
1 SQ1 +
14.2 s (3%)
Blender - Blender 3.3 Classroom CPU *
100%
1 M2 Max +
326 Seconds (4%)
100%
1 M2 Pro +
331 Seconds (4%)
Blender - Blender 2.79 BMW27 CPU *
100%
1 M2 Max +
333 Seconds (2%)
R Benchmark 2.5 - R Benchmark 2.5 *
100%
1 M2 Pro +
0.4 sec (9%)
Super Pi mod 1.5 XS 1M - Super Pi mod 1.5 XS 1M *
100%
1 SQ1 +
21.2 s (5%)
Super Pi mod 1.5 XS 2M - Super Pi mod 1.5 XS 2M *
100%
1 SQ1 +
46.7 s (2%)
Super Pi Mod 1.5 XS 32M - Super Pi mod 1.5 XS 32M *
100%
1 SQ1 +
1095 s (5%)
3DMark 11 - 3DM11 Performance Physics
100%
1 SQ1 +
3210 Points (9%)
Geekbench 6.2 - Geekbench 6.2 Single-Core
100%
1 M2 Max +
2692 Points (72%)
99%
1 M2 Pro +
2663 Points (72%)
Geekbench 6.2 - Geekbench 6.2 Multi-Core
100%
1 M2 Max +
14863 Points (59%)
98%
1 M2 Pro +
14568 Points (57%)
Geekbench 5.5 - Geekbench 5.1 - 5.4 64 Bit Single-Core
min: 1965     avg: 1970     median: 1967 (83%)     max: 1978 Points
38%
SQ1 +
739 Points (31%)
min: 1952     avg: 1957     median: 1957 (83%)     max: 1961 Points
Geekbench 5.5 - Geekbench 5.1 - 5.4 64 Bit Multi-Core
min: 15348     avg: 15388     median: 15373 (28%)     max: 15444 Points
19%
SQ1 +
2875 Points (5%)
min: 14859     avg: 14961     median: 15010 (27%)     max: 15013 Points
Geekbench 5.0 - Geekbench 5.0 64 Bit Single-Core
100%
1 SQ1 +
728 Points (3%)
Geekbench 5.0 - Geekbench 5.0 64 Bit Multi-Core
100%
1 SQ1 +
2785 Points (9%)
Geekbench 4.4 - Geekbench 4.1 - 4.4 64 Bit Single-Core
100%
1 SQ1 +
830 Points (8%)
Geekbench 4.4 - Geekbench 4.1 - 4.4 64 Bit Multi-Core
100%
1 SQ1 +
2597 Points (3%)
Mozilla Kraken 1.1 - Kraken 1.1 Total Score *
min: 430.2     avg: 437.2     median: 437.2 (1%)     max: 444.2 ms
99%
SQ1 +
1408 ms (2%)
443.8 ms (1%)
Octane V2 - Octane V2 Total Score
min: 76610     avg: 77676     median: 77676 (68%)     max: 78742 Points
40%
SQ1 +
31099 Points (27%)
76205 Points (67%)
WebXPRT 4 - WebXPRT 4 Score
100%
1 M2 Max +
min: 258     avg: 259     median: 259 (74%)     max: 260 Points
98%
1 M2 Pro +
253 Points (73%)
WebXPRT 3 - WebXPRT 3 Score
min: 402     avg: 404.5     median: 404.5 (84%)     max: 407 Points
29%
SQ1 +
116 Points (24%)
386 Points (80%)
CrossMark - CrossMark Overall
100%
1 M2 Max +
min: 1759     avg: 1835     median: 1834.5 (70%)     max: 1910 Points
98%
1 M2 Pro +
min: 1797     avg: 1805     median: 1804.5 (69%)     max: 1812 Points
Power Consumption - Cinebench R15 Multi Power Consumption - external Monitor *
100%
1 M2 Max +
72.8 Watt (13%)
Power Consumption - Idle Power Consumption - external Monitor *
100%
1 M2 Max +
9.2 Watt (6%)
Power Consumption - Cinebench R15 Multi Power Efficiency - external Monitor
100%
1 M2 Max +
28.5 Points per Watt (21%)

Average Benchmarks Apple M2 Max → 100% n=5

Average Benchmarks Microsoft SQ1 → 45% n=5

Average Benchmarks Apple M2 Pro → 98% n=5

- Range of benchmark values for this graphics card
- Average benchmark values for this graphics card
* Smaller numbers mean a higher performance
1 This benchmark is not used for the average calculation

v1.28
log 04. 01:13:52

#0 checking url part for id 14975 +0s ... 0s

#1 checking url part for id 11516 +0s ... 0s

#2 checking url part for id 14973 +0s ... 0s

#3 redirected to Ajax server, took 1720048432 +0s ... 0s

#4 did not recreate cache, as it is less than 5 days old! Created at Mon, 01 Jul 2024 05:15:43 +0200 +0s ... 0s

#5 composed specs +0.007s ... 0.007s

#6 did output specs +0s ... 0.007s

#7 getting avg benchmarks for device 14975 +0.001s ... 0.008s

#8 got single benchmarks 14975 +0.005s ... 0.013s

#9 getting avg benchmarks for device 11516 +0.001s ... 0.013s

#10 got single benchmarks 11516 +0.003s ... 0.017s

#11 getting avg benchmarks for device 14973 +0s ... 0.017s

#12 got single benchmarks 14973 +0.001s ... 0.018s

#13 got avg benchmarks for devices +0s ... 0.018s

#14 min, max, avg, median took s +0.02s ... 0.038s

#15 return log +0s ... 0.038s

Please share our article, every link counts!
> Expert Reviews and News on Laptops, Smartphones and Tech Innovations > Benchmarks / Tech > Processor Comparison - Head 2 Head
Redaktion, 2017-09- 8 (Update: 2023-07- 1)