Apple M2 Max 38-Core GPU vs Intel UHD Graphics Xe 16EUs (Tiger Lake-H) vs Apple M2 10-Core GPU
Apple M2 Max 38-Core GPU ► remove from comparison
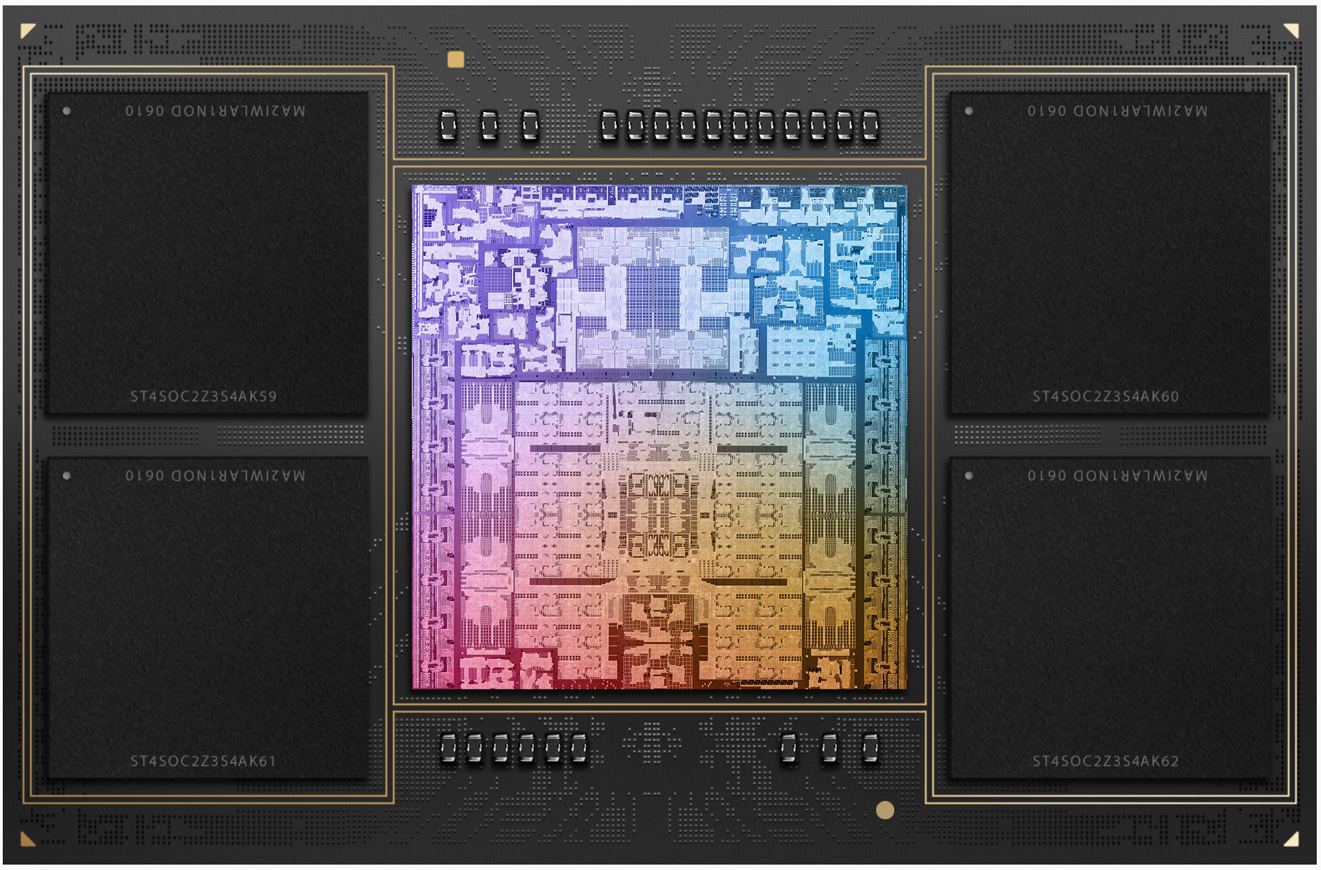
The Apple M2 Max 38-Core-GPU is an integrated graphics card by Apple offering all 38 cores in the M2 Max Chip .
The graphics card has no dedicated graphics memory but can use the fast LPDDR5-6400 unified memory with a 512 bit bus (up to 400 GBit/s).
Thanks to the additional cores and architectural improvements, the M2 Max GPU should clearly best the old M1 Max GPU with 32 cores and therefore be the fastest iGPU currently available.
The GPU is intended to use Apple Metal 2 API and could still be based on the older PowerVR architectures (last used in the Apple A10). A new feature in the MacBook Pro 14 and 16 of 2023 is the support for HDMI 2.1 and 8k output.
The Apple M2 Max is manufactured in the second generation 5nm process at TSMC. According to the internal powermetrics tool, the GPU uses up to 53.6 Watt (performance mode) and the whole chip (including the CPU) up to 89 Watt.
Intel UHD Graphics Xe 16EUs (Tiger Lake-H) ► remove from comparison
The Intel UHD Graphics Xe 750 (Rocket-Lake GPU with 16 EUs) is a integrated graphics card in the low end Tiger Lake-H CPUs. It is using the new Xe architecture (Gen12) and was announced in May 2021. This variant only uses 16 of the 32 EUs in the chip (=128 shaders) and therefore is significantly slower than the 32 EU version .
Compared to the previous generation of UHD Graphics ,the Xe architecture and the improved shader count lead to a big leap in graphics performance.
Apple M2 10-Core GPU ► remove from comparison
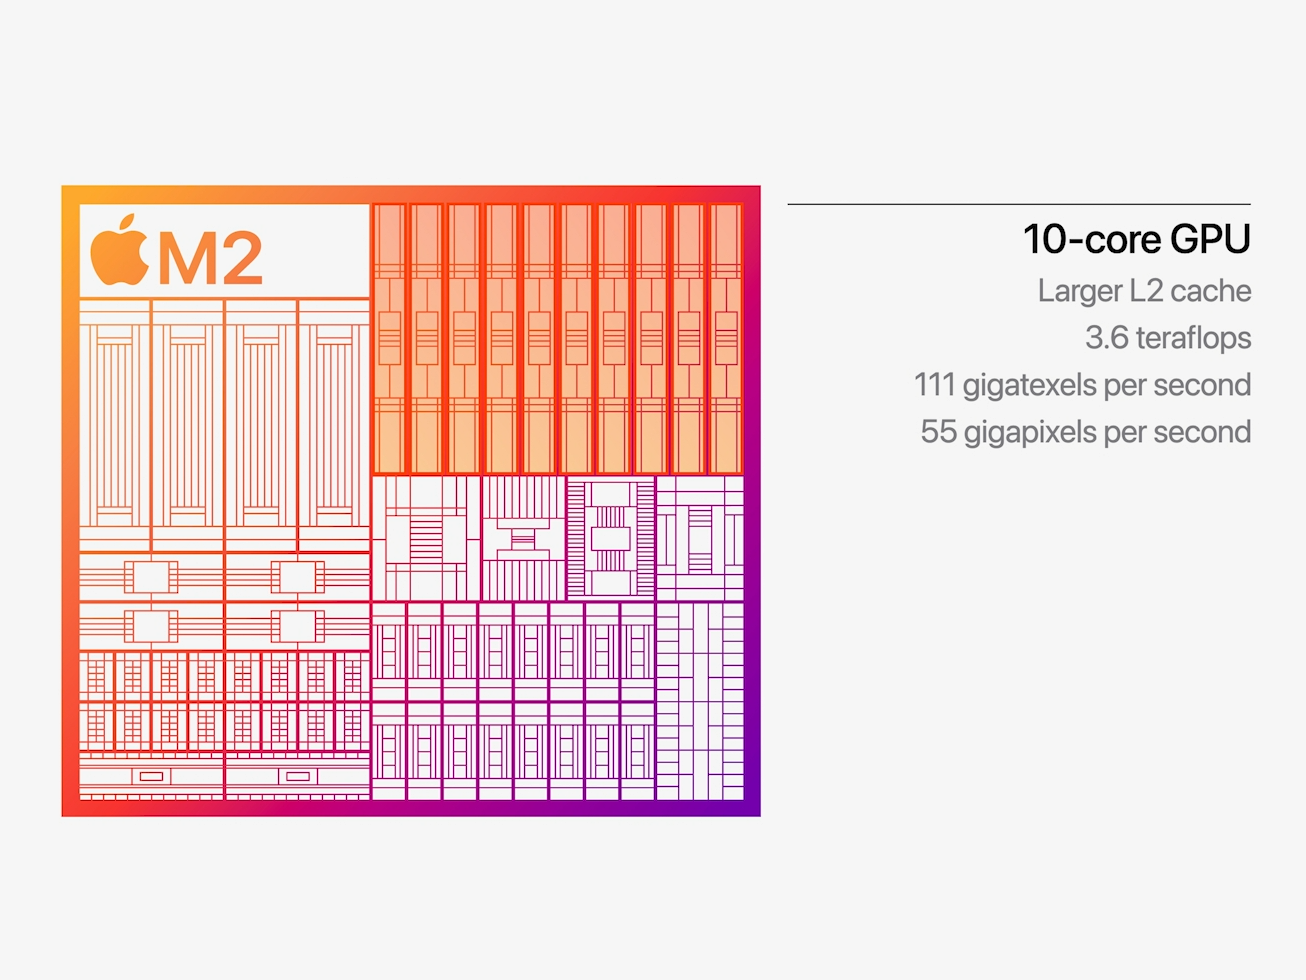
The Apple M2 GPU is an integrated graphics card offering 10 cores designed by Apple and integrated in the Apple M2 SoC . It uses the unified memory architecture of the M2 SoC (up to 24 GB LPDDR5-6400 with 100 GB/s bandwidth) and should offer 160 execution units.
According to Apple it offers a 25% higher performance at slightly higher power consumption. The theoretical performance is rated at 3.6 Teraflops and therefore 1 TFLOP higher than the M1 8-core GPU . In our benchmarks, the GPU was able to top the M1 with up to 40%, but still stays behind the 14-core GPU in the M1 Pro. Compared to other iGPUs from AMD and Intel, the M2 benefits greatly from the unified memory architecture and the high bandwidth.
The M2 chip is manufactured in the second generation 5nm process at TSMC (most likely N5P). The power consumption is around 13.5 Watt (in our tests under load of the MBP13) and up to 15W according to Apple.
Apple M2 Max 38-Core GPU Intel UHD Graphics Xe 16EUs (Tiger Lake-H) Apple M2 10-Core GPU Apple M2 Series Pipelines 38 - unified 16 - unified 10 - unified Memory Type LPDDR5-6400 LPDDR5-6400 Shared Memory no yes no Power Consumption 53 Watt 15 Watt technology 5 nm 10 nm 5 nm Notebook Size medium sized Date of Announcement 17.01.2023 30.03.2021 06.06.2022 Codename Tiger Lake Xe Architecture Gen. 12 Core Speed 350 - 1450 (Boost) MHz 1398 (Boost) MHz API DirectX 12_1, OpenGL 4.6 Features QuickSync Predecessor M1 8-Core GPU
CPU in M2 Max 38-Core GPU GPU Base Speed GPU Boost / Turbo Apple M2 Max 12 x 2424 MHz, 79 W ? MHz ? MHz
CPU in UHD Graphics Xe 16EUs (Tiger Lake-H) GPU Base Speed GPU Boost / Turbo Intel Core i7-13650HX 14 x 1900 MHz, 55 W ? MHz 1550 MHz Intel Core i5-13500HX 14 x 1800 MHz, 55 W ? MHz 1500 MHz Intel Core i5-14450HX 10 x 1800 MHz, 55 W ? MHz 1500 MHz » show 6 more Intel Core i5-13450HX 10 x 1800 MHz, 55 W ? MHz 1450 MHz Intel Core i5-12450HX 8 x 1800 MHz, 55 W ? MHz 1300 MHz Intel Core i5-11400H 6 x 2700 MHz, 45 W 350 MHz 1450 MHz Intel Core i5-11260H 6 x 2600 MHz, 45 W 350 MHz 1400 MHz Intel Processor N95 4 x ? MHz, 15 W ? MHz 1200 MHz Intel Processor N50 2 x 1000 MHz, 6 W ? MHz 750 MHz min. - max. ? MHz 750 - ? MHz
CPU in M2 10-Core GPU GPU Base Speed GPU Boost / Turbo Apple M2 8 x 2424 MHz, 20 W ? MHz 1398 MHz
Benchmarks Performance Rating - 3DMark 11 + Fire Strike + Time Spy - UHD Graphics Xe 16EUs (Tiger Lake-H)
0.5 pt (2%)
...
Intel UHD Graphics Xe 16EUs (Tiger Lake-H)
...
max:
3DMark - 3DMark Time Spy Score
min: 359 avg: 398.7 median: 404 (1%) max: 433 Points
3DMark - 3DMark Time Spy Graphics
min: 313 avg: 344.7 median: 348 (1%) max: 373 Points
3DMark - 3DMark Ice Storm Unlimited Graphics
min: 52786 avg: 61319 median: 64701 (7%) max: 66471 Points
3DMark - 3DMark Ice Storm Extreme Graphics
min: 19751 avg: 22257 median: 22256.5 (3%) max: 24762 Points
3DMark - 3DMark Cloud Gate Score
min: 6660 avg: 8390 median: 8223 (9%) max: 10288 Points
3DMark - 3DMark Cloud Gate Graphics
min: 7779 avg: 8628 median: 7982 (2%) max: 10124 Points
3DMark - 3DMark Fire Strike Standard Score
min: 1022 avg: 1157 median: 1151 (2%) max: 1298 Points
3DMark - 3DMark Fire Strike Standard Graphics
min: 1089 avg: 1220 median: 1203 (1%) max: 1368 Points
3DMark - 3DMark Ice Storm Graphics
min: 22104 avg: 37415 median: 35681 (4%) max: 54459 Points
3DMark - 3DMark Wild Life Unlimited
min: 21302 avg: 23924 median: 24236 (12%) max: 25317 Points
GPU TDP ? TDP 13 W 94% 100%
3DMark - 3DMark Wild Life Extreme Unlimited
25103 Points (29%)
min: 5328 avg: 6533 median: 6823.5 (8%) max: 6987 Points
GPU TDP ? TDP 12 W TDP 13 W TDP 64 W 25% 28% 27% 100%
3DMark 11 - 3DM11 Performance Score
min: 1684 avg: 1865 median: 1933 (3%) max: 1979 Points
3DMark 11 - 3DM11 Performance GPU
min: 1474 avg: 1602 median: 1654 (1%) max: 1679 Points
3DMark Vantage + Intel UHD Graphics Xe 16EUs (Tiger Lake-H) 3DMark Vantage - 3DM Vant. Perf. total
min: 5508 avg: 6769 median: 7190 (2%) max: 7609 Points
3DM Vant. Perf. GPU no PhysX + Intel UHD Graphics Xe 16EUs (Tiger Lake-H) 3DMark Vantage - 3DM Vant. Perf. GPU no PhysX
min: 4561 avg: 5372 median: 5589 (3%) max: 5966 Points
3DMark 05 - 3DMark 05 - Standard
min: 15740 avg: 19694 median: 19694 (22%) max: 23648 Points
3DMark 06 3DMark 06 - Standard 1280x1024 + Intel UHD Graphics Xe 16EUs (Tiger Lake-H)
min: 9852 avg: 11702 median: 12452 (16%) max: 12803 Points
Unigine Valley 1.0 - Unigine Valley 1.0 DX
min: 4.4 avg: 4.8 median: 4.8 (2%) max: 5.1 fps
Blender - Blender 3.3 Classroom METAL *
51.2 Seconds (5%)
min: 205 avg: 221 median: 221 (23%) max: 237 Seconds
GPU TDP 12 W TDP 13 W TDP 64 W 104% 100% 126%
SPECviewperf 12 + Intel UHD Graphics Xe 16EUs (Tiger Lake-H) SPECviewperf 12 - specvp12 sw-03
25.7 fps (6%)
specvp12 snx-02 + Intel UHD Graphics Xe 16EUs (Tiger Lake-H) SPECviewperf 12 - specvp12 snx-02
3.6 fps (1%)
specvp12 showcase-01 + Intel UHD Graphics Xe 16EUs (Tiger Lake-H) SPECviewperf 12 - specvp12 showcase-01
6.6 fps (1%)
specvp12 mediacal-01 + Intel UHD Graphics Xe 16EUs (Tiger Lake-H) SPECviewperf 12 - specvp12 mediacal-01
2.8 fps (1%)
specvp12 maya-04 + Intel UHD Graphics Xe 16EUs (Tiger Lake-H) SPECviewperf 12 - specvp12 maya-04
12.8 fps (3%)
specvp12 energy-01 + Intel UHD Graphics Xe 16EUs (Tiger Lake-H) SPECviewperf 12 - specvp12 energy-01
0.2 fps (0%)
specvp12 creo-01 + Intel UHD Graphics Xe 16EUs (Tiger Lake-H) SPECviewperf 12 - specvp12 creo-01
4 fps (2%)
specvp12 catia-04 + Intel UHD Graphics Xe 16EUs (Tiger Lake-H) SPECviewperf 12 - specvp12 catia-04
14.6 fps (2%)
specvp12 3dsmax-05 + Intel UHD Graphics Xe 16EUs (Tiger Lake-H) SPECviewperf 12 - specvp12 3dsmax-05
16.8 fps (3%)
SPECviewperf 13 specvp13 sw-04 + Intel UHD Graphics Xe 16EUs (Tiger Lake-H) SPECviewperf 13 - specvp13 sw-04
34.1 fps (9%)
specvp13 snx-03 + Intel UHD Graphics Xe 16EUs (Tiger Lake-H) SPECviewperf 13 - specvp13 snx-03
6.5 fps (1%)
specvp13 showcase-02 + Intel UHD Graphics Xe 16EUs (Tiger Lake-H) SPECviewperf 13 - specvp13 showcase-02
6.6 fps (1%)
specvp13 medical-02 + Intel UHD Graphics Xe 16EUs (Tiger Lake-H) SPECviewperf 13 - specvp13 medical-02
2.6 fps (1%)
specvp13 maya-05 + Intel UHD Graphics Xe 16EUs (Tiger Lake-H) SPECviewperf 13 - specvp13 maya-05
18.8 fps (2%)
specvp13 creo-02 + Intel UHD Graphics Xe 16EUs (Tiger Lake-H) SPECviewperf 13 - specvp13 creo-02
12.8 fps (2%)
specvp13 catia-05 + Intel UHD Graphics Xe 16EUs (Tiger Lake-H) SPECviewperf 13 - specvp13 catia-05
21.5 fps (2%)
specvp13 3dsmax-06 + Intel UHD Graphics Xe 16EUs (Tiger Lake-H) SPECviewperf 13 - specvp13 3dsmax-06
16.7 fps (3%)
Cinebench R10 Cinebench R10 Shading (32bit) + Intel UHD Graphics Xe 16EUs (Tiger Lake-H) Cinebench R10 - Cinebench R10 Shading (32bit)
min: 4461 avg: 9517 median: 12011 (9%) max: 12078 Points
Cinebench R11.5 Cinebench R11.5 OpenGL 64 Bit + Intel UHD Graphics Xe 16EUs (Tiger Lake-H) Cinebench R11.5 - Cinebench R11.5 OpenGL 64 Bit
min: 23.53 avg: 36.2 median: 41.6 (14%) max: 43.57 fps
Cinebench R15 + Apple M2 Max 38-Core GPU Cinebench R15 - Cinebench R15 OpenGL 64 Bit
147.5 fps (9%)
Cinebench R15 OpenGL 64 Bit + Intel UHD Graphics Xe 16EUs (Tiger Lake-H)
min: 30.59 avg: 42 median: 46.3 (3%) max: 49.1 fps
GPU TDP ? TDP 64 W 28% 100%
Cinebench R15 OpenGL 64 Bit + Apple M2 10-Core GPU
min: 128.65 avg: 132.8 median: 131 (8%) max: 140.5 fps
GPU TDP ? TDP 12 W TDP 13 W TDP 64 W 28% 95% 88% 100%
Cinebench R15 OpenGL Ref. Match 64 Bit + Apple M2 Max 38-Core GPU Cinebench R15 - Cinebench R15 OpenGL Ref. Match 64 Bit
99.5 % (100%)
Cinebench R15 OpenGL Ref. Match 64 Bit + Intel UHD Graphics Xe 16EUs (Tiger Lake-H)
97.8 % (98%)
GPU TDP ? TDP 64 W 98% 100%
Cinebench R15 OpenGL Ref. Match 64 Bit + Apple M2 10-Core GPU
99.5 % (100%)
GPU TDP ? TDP 12 W TDP 13 W TDP 64 W 98% 100% 100% 100%
GFXBench - GFXBench 5.0 4K Aztec Ruins High Tier Offscreen
179.9 fps (73%)
min: 35.6 avg: 43.9 median: 47.9 (19%) max: 48.6 fps
GPU TDP ? TDP 12 W TDP 13 W TDP 64 W 23% 27% 27% 100%
GFXBench - GFXBench 5.0 Aztec Ruins High Tier Offscreen
397.6 fps (72%)
11.4 fps (2%)
min: 68 avg: 96 median: 102.6 (19%) max: 110 fps
GPU TDP ? TDP 12 W TDP 13 W TDP 64 W 17% 27% 27% 100%
GFXBench - GFXBench 5.0 Aztec Ruins Normal Tier Offscreen
950 fps (70%)
33.6 fps (2%)
min: 208 avg: 267.5 median: 283.8 (21%) max: 296 fps
GPU TDP ? TDP 12 W TDP 13 W TDP 64 W 21% 30% 31% 100%
GFXBench - GFXBench Car Chase Offscreen
585 fps (66%)
31.1 fps (4%)
min: 136 avg: 197.6 median: 206.1 (23%) max: 232 fps
GPU TDP ? TDP 12 W TDP 13 W TDP 64 W 27% 40% 34% 100%
GFXBench 3.1 - GFXBench Manhattan ES 3.1 Offscreen
1294 fps (27%)
41.9 fps (1%)
min: 247 avg: 318.6 median: 331.5 (7%) max: 374.6 fps
GPU TDP ? TDP 12 W TDP 13 W TDP 64 W 20% 29% 25% 100%
GFXBench 3.0 - GFXBench 3.0 Manhattan Offscreen
1708 fps (100%)
77.3 fps (5%)
min: 411 avg: 503 median: 509.5 (30%) max: 557.2 fps
GPU TDP ? TDP 12 W TDP 13 W TDP 64 W 23% 33% 32% 100%
GFXBench (DX / GLBenchmark) 2.7 + Apple M2 Max 38-Core GPU GFXBench (DX / GLBenchmark) 2.7 - GFXBench T-Rex HD Offscreen C24Z16
3185 fps (25%)
GFXBench T-Rex HD Offscreen C24Z16 + Intel UHD Graphics Xe 16EUs (Tiger Lake-H)
123.6 fps (1%)
GFXBench T-Rex HD Offscreen C24Z16 + Apple M2 10-Core GPU
min: 628 avg: 824 median: 891.5 (7%) max: 931.9 fps
GPU TDP ? TDP 12 W TDP 13 W TDP 64 W 19% 29% 29% 100%
Antutu v9 - AnTuTu v9 GPU
min: 654168 avg: 728087 median: 728086 (91%) max: 802005 Points
Basemark GPU 1.2 - Basemark GPU 1.2 Vulkan Official Medium Offscreen 1080
52.8 fps (0%)
Basemark GPU 1.2 - Basemark GPU 1.2 Vulkan Official High Offscreen 2160
4.1 fps (1%)
Geekbench 6.2 - Geekbench 6.2 GPU OpenCL
min: 3191 avg: 3474 median: 3473.5 (1%) max: 3756 Points
min: 27880 avg: 27900 median: 27900 (8%) max: 27920 Points
GPU TDP ? TDP 12 W TDP 13 W 12% 100% 100%
Geekbench 6.2 - Geekbench 6.2 GPU Vulkan
min: 3619 avg: 3947 median: 3946.5 (1%) max: 4274 Points
Geekbench 6.2 - Geekbench 6.2 GPU Metal
min: 42013 avg: 44473 median: 45460 (29%) max: 45946 Points
GPU TDP ? TDP 12 W TDP 13 W 91% 100% 99%
LuxMark v2.0 64Bit - LuxMark v2.0 Room GPU
292 Samples/s (1%)
LuxMark v2.0 64Bit - LuxMark v2.0 Sala GPU
601 Samples/s (1%)
ComputeMark v2.1 - ComputeMark v2.1 Result
min: 634 avg: 726 median: 745 (1%) max: 800 Points
Power Consumption - Furmark Stress Test Power Consumption - external Monitor *
min: 18.5 avg: 24.6 median: 23.4 (3%) max: 31.8 Watt
Power Consumption - The Witcher 3 Power Consumption - external Monitor *
80.7 Watt (11%)
27.5 Watt (4%)
GPU TDP ? TDP 64 W 108% 100%
min: 22.8 avg: 27.8 median: 26.9 (4%) max: 34.4 Watt
GPU TDP ? TDP 12 W TDP 13 W TDP 64 W 108% 108% 108% 100%
Power Consumption - Witcher 3 Power Consumption *
92 Watt (20%)
min: 30.6 avg: 37.7 median: 37.7 (8%) max: 44.8 Watt
GPU TDP ? TDP 64 W 115% 100%
min: 27.8 avg: 32.5 median: 30.8 (7%) max: 38.9 Watt
GPU TDP ? TDP 13 W TDP 64 W 115% 116% 100%
Power Consumption - GFXBench Aztec Ruins Normal Tier Offscreen Power Consumption 150cd *
min: 16 avg: 16.5 median: 16.7 (6%) max: 16.7 Watt
Power Consumption - Witcher 3 ultra Power Efficiency
0.2 fps per Watt (15%)
min: 1.007 avg: 1 median: 1 (91%) max: 1.108 fps per Watt
GPU TDP ? TDP 13 W 16% 100%
Power Consumption - Witcher 3 ultra Power Efficiency - external Monitor
0.9 fps per Watt (78%)
0.2 fps per Watt (15%)
GPU TDP ? TDP 64 W 19% 100%
min: 1.116 avg: 1.1 median: 1.1 (92%) max: 1.207 fps per Watt
GPU TDP ? TDP 13 W TDP 64 W 16% 100% 84%
Emissions Witcher 3 Fan Noise + Apple M2 Max 38-Core GPU Emissions - Witcher 3 Fan Noise
35.1 dB(A) (56%)
Witcher 3 Fan Noise + Intel UHD Graphics Xe 16EUs (Tiger Lake-H)
33.2 dB(A) (53%)
GPU TDP ? TDP 64 W 95% 100%
Witcher 3 Fan Noise + Apple M2 10-Core GPU
34.6 dB(A) (55%)
GPU TDP ? TDP 13 W TDP 64 W 95% 99% 100%
Average Benchmarks Apple M2 Max 38-Core GPU → 100% n=8 Average Benchmarks Intel UHD Graphics Xe 16EUs (Tiger Lake-H) → 19% n=8 Average Benchmarks Apple M2 10-Core GPU → 45% n=8
- Range of benchmark values for this graphics card
- Average benchmark values for this graphics card
* Smaller numbers mean a higher performance
1 This benchmark is not used for the average calculation
Game Benchmarks The following benchmarks stem from our benchmarks of review laptops. The performance depends on the used graphics memory, clock rate, processor, system settings, drivers, and operating systems. So the results don't have to be representative for all laptops with this GPU. For detailed information on the benchmark results, click on the fps number.
UHD Graphics Xe 16EUs (Tiger Lake-H):
39.9 [X] Lenovo ThinkBook 15p G2 ITH 21B1000WGE Intel Core i5-11400H 2.7GHz
UHD Graphics Xe 16EUs (Tiger Lake-H)
min:
11.5 fps, P0.1:
11.6 fps, P1:
27.4 fps, max:
107.6 fps
fps
UHD Graphics Xe 16EUs (Tiger Lake-H):
26.9 [X] Lenovo ThinkBook 15p G2 ITH 21B1000WGE Intel Core i5-11400H 2.7GHz
UHD Graphics Xe 16EUs (Tiger Lake-H)
min:
9.24 fps, P0.1:
9.72 fps, P1:
17.3 fps, max:
121.1 fps
fps
UHD Graphics Xe 16EUs (Tiger Lake-H):
24.8 [X] Lenovo ThinkBook 15p G2 ITH 21B1000WGE Intel Core i5-11400H 2.7GHz
UHD Graphics Xe 16EUs (Tiger Lake-H)
min:
9.37 fps, P0.1:
9.61 fps, P1:
15.8 fps, max:
93.6 fps
fps
UHD Graphics Xe 16EUs (Tiger Lake-H):
9.7 [X] Lenovo ThinkBook 15p G2 ITH 21B1000WGE Intel Core i5-11400H 2.7GHz
UHD Graphics Xe 16EUs (Tiger Lake-H)
min:
4.3 fps, P0.1:
4.84 fps, P1:
6.93 fps, max:
25.8 fps
fps
UHD Graphics Xe 16EUs (Tiger Lake-H):
9.9 [X] Lenovo ThinkBook 15p G2 ITH 21B1000WGE Intel Core i5-11400H 2.7GHz
UHD Graphics Xe 16EUs (Tiger Lake-H)
min:
7.99 fps, P0.1:
8.06 fps, P1:
8.22 fps, max:
11.5 fps
fps
UHD Graphics Xe 16EUs (Tiger Lake-H):
5 (!) [X] Lenovo ThinkBook 15p G2 ITH 21B1000WGE Intel Core i5-11400H 2.7GHz
UHD Graphics Xe 16EUs (Tiger Lake-H)
min:
4 fps
fps
UHD Graphics Xe 16EUs (Tiger Lake-H):
6.6 [X] Lenovo ThinkBook 15p G2 ITH 21B1000WGE Intel Core i5-11400H 2.7GHz
UHD Graphics Xe 16EUs (Tiger Lake-H)
min:
3.14 fps, P0.1:
3.16 fps, P1:
3.29 fps, max:
158.1 fps
fps
UHD Graphics Xe 16EUs (Tiger Lake-H):
17.8 [X] Lenovo ThinkBook 15p G2 ITH 21B1000WGE Intel Core i5-11400H 2.7GHz
UHD Graphics Xe 16EUs (Tiger Lake-H)
fps
UHD Graphics Xe 16EUs (Tiger Lake-H):
13.5 [X] Lenovo ThinkBook 15p G2 ITH 21B1000WGE Intel Core i5-11400H 2.7GHz
UHD Graphics Xe 16EUs (Tiger Lake-H)
fps
UHD Graphics Xe 16EUs (Tiger Lake-H):
6 [X] Lenovo ThinkBook 15p G2 ITH 21B1000WGE Intel Core i5-11400H 2.7GHz
UHD Graphics Xe 16EUs (Tiger Lake-H)
min:
5 fps, max:
7 fps
fps
UHD Graphics Xe 16EUs (Tiger Lake-H):
10.7 [X] Lenovo ThinkBook 15p G2 ITH 21B1000WGE Intel Core i5-11400H 2.7GHz
UHD Graphics Xe 16EUs (Tiger Lake-H)
min:
1.406 fps, P0.1:
3.82 fps, P1:
10.1 fps, max:
111.7 fps
fps
UHD Graphics Xe 16EUs (Tiger Lake-H):
23.4 [X] Lenovo ThinkBook 15p G2 ITH 21B1000WGE Intel Core i5-11400H 2.7GHz
UHD Graphics Xe 16EUs (Tiger Lake-H)
min:
16 fps, P0.1:
16 fps, P1:
16.2 fps, max:
42.4 fps
fps
UHD Graphics Xe 16EUs (Tiger Lake-H):
16.7 [X] Lenovo ThinkBook 15p G2 ITH 21B1000WGE Intel Core i5-11400H 2.7GHz
UHD Graphics Xe 16EUs (Tiger Lake-H)
min:
11.9 fps, P0.1:
11.9 fps, P1:
12 fps, max:
33.4 fps
fps
UHD Graphics Xe 16EUs (Tiger Lake-H):
9 [X] Lenovo ThinkBook 15p G2 ITH 21B1000WGE Intel Core i5-11400H 2.7GHz
UHD Graphics Xe 16EUs (Tiger Lake-H)
min:
5.74 fps, P0.1:
5.84 fps, P1:
6.75 fps, max:
18.8 fps
fps
UHD Graphics Xe 16EUs (Tiger Lake-H):
4.7 [X] Lenovo ThinkBook 15p G2 ITH 21B1000WGE 2.02
Intel Core i5-11400H 2.7GHz
UHD Graphics Xe 16EUs (Tiger Lake-H)
min:
3.23 fps, max:
6.5 fps
fps
UHD Graphics Xe 16EUs (Tiger Lake-H):
5.4 [X] Lenovo ThinkBook 15p G2 ITH 21B1000WGE Intel Core i5-11400H 2.7GHz
UHD Graphics Xe 16EUs (Tiger Lake-H)
min:
2.4 fps, P0.1:
2.41 fps, P1:
2.49 fps, max:
126.5 fps
fps
UHD Graphics Xe 16EUs (Tiger Lake-H):
10.1 [X] Lenovo ThinkBook 15p G2 ITH 21B1000WGE Intel Core i5-11400H 2.7GHz
UHD Graphics Xe 16EUs (Tiger Lake-H)
min:
2.16 fps, P0.1:
2.92 fps, P1:
8.81 fps, max:
54.1 fps
fps
UHD Graphics Xe 16EUs (Tiger Lake-H):
5.4 [X] Lenovo ThinkBook 15p G2 ITH 21B1000WGE Intel Core i5-11400H 2.7GHz
UHD Graphics Xe 16EUs (Tiger Lake-H)
min:
4.57 fps, P0.1:
4.57 fps, P1:
4.62 fps, max:
6.84 fps
fps
UHD Graphics Xe 16EUs (Tiger Lake-H):
10.6 [X] Lenovo ThinkBook 15p G2 ITH 21B1000WGE 1070925
Intel Core i5-11400H 2.7GHz
UHD Graphics Xe 16EUs (Tiger Lake-H)
min:
9 fps, P1:
9 fps, max:
12 fps
fps
UHD Graphics Xe 16EUs (Tiger Lake-H):
9.6 [X] Lenovo ThinkBook 15p G2 ITH 21B1000WGE 1070925
Intel Core i5-11400H 2.7GHz
UHD Graphics Xe 16EUs (Tiger Lake-H)
min:
8 fps, P1:
8 fps, max:
10 fps
fps
UHD Graphics Xe 16EUs (Tiger Lake-H):
6.5 [X] Lenovo ThinkBook 15p G2 ITH 21B1000WGE 1070925
Intel Core i5-11400H 2.7GHz
UHD Graphics Xe 16EUs (Tiger Lake-H)
min:
5 fps, P1:
5 fps, max:
7 fps
fps
UHD Graphics Xe 16EUs (Tiger Lake-H):
11.2 [X] Lenovo ThinkBook 15p G2 ITH 21B1000WGE Intel Core i5-11400H 2.7GHz
UHD Graphics Xe 16EUs (Tiger Lake-H)
min:
8.07 fps, P0.1:
8.26 fps, P1:
9.08 fps, max:
13.1 fps
fps
UHD Graphics Xe 16EUs (Tiger Lake-H):
9.6 [X] Lenovo ThinkBook 15p G2 ITH 21B1000WGE Intel Core i5-11400H 2.7GHz
UHD Graphics Xe 16EUs (Tiger Lake-H)
min:
4.45 fps, P0.1:
4.49 fps, P1:
4.67 fps, max:
151.9 fps
fps
UHD Graphics Xe 16EUs (Tiger Lake-H):
3.3 [X] Lenovo ThinkBook 15p G2 ITH 21B1000WGE Intel Core i5-11400H 2.7GHz
UHD Graphics Xe 16EUs (Tiger Lake-H)
min:
2.39 fps, P0.1:
2.39 fps, P1:
2.4 fps, max:
5.36 fps
fps
UHD Graphics Xe 16EUs (Tiger Lake-H):
5.6 [X] Lenovo ThinkBook 15p G2 ITH 21B1000WGE Intel Core i5-11400H 2.7GHz
UHD Graphics Xe 16EUs (Tiger Lake-H)
min:
4.55 fps, P0.1:
4.56 fps, P1:
4.64 fps, max:
7.94 fps
fps
UHD Graphics Xe 16EUs (Tiger Lake-H):
6.8 [X] Lenovo ThinkBook 15p G2 ITH 21B1000WGE Intel Core i5-11400H 2.7GHz
UHD Graphics Xe 16EUs (Tiger Lake-H)
min:
6.15 fps, P0.1:
6.17 fps, P1:
6.24 fps, max:
7.36 fps
fps
UHD Graphics Xe 16EUs (Tiger Lake-H):
3.5 [X] Lenovo ThinkBook 15p G2 ITH 21B1000WGE Intel Core i5-11400H 2.7GHz
UHD Graphics Xe 16EUs (Tiger Lake-H)
min:
0.931 fps, P0.1:
1.008 fps, P1:
2.54 fps, max:
168.2 fps
fps
UHD Graphics Xe 16EUs (Tiger Lake-H):
9.8 [X] Lenovo ThinkBook 15p G2 ITH 21B1000WGE Intel Core i5-11400H 2.7GHz
UHD Graphics Xe 16EUs (Tiger Lake-H)
min:
5.03 fps, P0.1:
6.57 fps, P1:
7.95 fps, max:
100.7 fps
fps
UHD Graphics Xe 16EUs (Tiger Lake-H):
9.8 [X] Lenovo ThinkBook 15p G2 ITH 21B1000WGE Intel Core i5-11400H 2.7GHz
UHD Graphics Xe 16EUs (Tiger Lake-H)
min:
3.86 fps, P0.1:
3.9 fps, P1:
4.11 fps, max:
137.8 fps
fps
UHD Graphics Xe 16EUs (Tiger Lake-H):
6.2 [X] Lenovo ThinkBook 15p G2 ITH 21B1000WGE Intel Core i5-11400H 2.7GHz
UHD Graphics Xe 16EUs (Tiger Lake-H)
min:
3.7 fps, P0.1:
4.44 fps, P1:
5.31 fps, max:
168.4 fps
fps
UHD Graphics Xe 16EUs (Tiger Lake-H):
6.7 [X] Lenovo ThinkBook 15p G2 ITH 21B1000WGE Intel Core i5-11400H 2.7GHz
UHD Graphics Xe 16EUs (Tiger Lake-H)
min:
4.59 fps, P0.1:
4.61 fps, P1:
4.94 fps, max:
14.6 fps
fps
UHD Graphics Xe 16EUs (Tiger Lake-H):
3.4 [X] Lenovo ThinkBook 15p G2 ITH 21B1000WGE Intel Core i5-11400H 2.7GHz
UHD Graphics Xe 16EUs (Tiger Lake-H)
min:
1.594 fps, P0.1:
1.616 fps, P1:
1.837 fps, max:
62.4 fps
fps
UHD Graphics Xe 16EUs (Tiger Lake-H):
4.1 [X] Lenovo ThinkBook 15p G2 ITH 21B1000WGE Intel Core i5-11400H 2.7GHz
UHD Graphics Xe 16EUs (Tiger Lake-H)
min:
2.12 fps, P0.1:
2.34 fps, P1:
2.89 fps, max:
5.4 fps
fps
UHD Graphics Xe 16EUs (Tiger Lake-H):
3.5 [X] Lenovo ThinkBook 15p G2 ITH 21B1000WGE Intel Core i5-11400H 2.7GHz
UHD Graphics Xe 16EUs (Tiger Lake-H)
min:
2.69 fps, P0.1:
2.71 fps, P1:
2.83 fps, max:
4.73 fps
fps
UHD Graphics Xe 16EUs (Tiger Lake-H):
12.1 [X] Lenovo ThinkBook 15p G2 ITH 21B1000WGE 959964
Intel Core i5-11400H 2.7GHz
UHD Graphics Xe 16EUs (Tiger Lake-H)
min:
10 fps, P1:
10 fps, max:
13 fps
fps
UHD Graphics Xe 16EUs (Tiger Lake-H):
10.9 [X] Lenovo ThinkBook 15p G2 ITH 21B1000WGE 959964
Intel Core i5-11400H 2.7GHz
UHD Graphics Xe 16EUs (Tiger Lake-H)
min:
9 fps, P1:
9 fps, max:
12 fps
fps
UHD Graphics Xe 16EUs (Tiger Lake-H):
7.7 [X] Lenovo ThinkBook 15p G2 ITH 21B1000WGE 959964
Intel Core i5-11400H 2.7GHz
UHD Graphics Xe 16EUs (Tiger Lake-H)
min:
6 fps, P1:
6 fps, max:
8 fps
fps
UHD Graphics Xe 16EUs (Tiger Lake-H):
6 [X] Lenovo ThinkBook 15p G2 ITH 21B1000WGE 959964
Intel Core i5-11400H 2.7GHz
UHD Graphics Xe 16EUs (Tiger Lake-H)
min:
5 fps, P1:
5 fps, max:
6 fps
fps
UHD Graphics Xe 16EUs (Tiger Lake-H):
18.6 [X] Lenovo ThinkBook 15p G2 ITH 21B1000WGE Intel Core i5-11400H 2.7GHz
UHD Graphics Xe 16EUs (Tiger Lake-H)
min:
13.9 fps, P0.1:
14.3 fps, P1:
14.9 fps, max:
24.4 fps
fps
UHD Graphics Xe 16EUs (Tiger Lake-H):
10.9 [X] Lenovo ThinkBook 15p G2 ITH 21B1000WGE Intel Core i5-11400H 2.7GHz
UHD Graphics Xe 16EUs (Tiger Lake-H)
min:
6.82 fps, P0.1:
6.88 fps, P1:
8.69 fps, max:
74.4 fps
fps
UHD Graphics Xe 16EUs (Tiger Lake-H):
5.7 [X] Lenovo ThinkBook 15p G2 ITH 21B1000WGE Intel Core i5-11400H 2.7GHz
UHD Graphics Xe 16EUs (Tiger Lake-H)
min:
2.66 fps, P0.1:
2.7 fps, P1:
2.78 fps, max:
113.7 fps
fps
UHD Graphics Xe 16EUs (Tiger Lake-H):
7.5 [X] Lenovo ThinkBook 15p G2 ITH 21B1000WGE Intel Core i5-11400H 2.7GHz
UHD Graphics Xe 16EUs (Tiger Lake-H)
fps
UHD Graphics Xe 16EUs (Tiger Lake-H):
20.1 [X] Lenovo ThinkBook 15p G2 ITH 21B1000WGE Intel Core i5-11400H 2.7GHz
UHD Graphics Xe 16EUs (Tiger Lake-H)
min:
14.6 fps, max:
26.4 fps
fps
UHD Graphics Xe 16EUs (Tiger Lake-H):
15.5 [X] Lenovo ThinkBook 15p G2 ITH 21B1000WGE Intel Core i5-11400H 2.7GHz
UHD Graphics Xe 16EUs (Tiger Lake-H)
min:
11.9 fps, max:
21 fps
fps
UHD Graphics Xe 16EUs (Tiger Lake-H):
10.3 [X] Lenovo ThinkBook 15p G2 ITH 21B1000WGE Intel Core i5-11400H 2.7GHz
UHD Graphics Xe 16EUs (Tiger Lake-H)
min:
6.85 fps, P0.1:
7.68 fps, P1:
8.68 fps, max:
21.5 fps
fps
UHD Graphics Xe 16EUs (Tiger Lake-H):
6.4 [X] Lenovo ThinkBook 15p G2 ITH 21B1000WGE Intel Core i5-11400H 2.7GHz
UHD Graphics Xe 16EUs (Tiger Lake-H)
min:
3.9 fps, P0.1:
3.95 fps, P1:
4.58 fps, max:
12.2 fps
fps
UHD Graphics Xe 16EUs (Tiger Lake-H):
34.7 [X] Lenovo ThinkBook 15p G2 ITH 21B1000WGE Intel Core i5-11400H 2.7GHz
UHD Graphics Xe 16EUs (Tiger Lake-H)
min:
4.85 fps, P0.1:
8.72 fps, P1:
11.1 fps, max:
164.9 fps
fps
UHD Graphics Xe 16EUs (Tiger Lake-H):
14 [X] Lenovo ThinkBook 15p G2 ITH 21B1000WGE Intel Core i5-11400H 2.7GHz
UHD Graphics Xe 16EUs (Tiger Lake-H)
min:
4.05 fps, P0.1:
4.28 fps, P1:
8.42 fps, max:
108.6 fps
fps
UHD Graphics Xe 16EUs (Tiger Lake-H):
23 [X] Gigabyte G5 GD Intel Core i5-11400H 2.7GHz
UHD Graphics Xe 16EUs (Tiger Lake-H)
fps
UHD Graphics Xe 16EUs (Tiger Lake-H):
9 [X] Gigabyte G5 GD Intel Core i5-11400H 2.7GHz
UHD Graphics Xe 16EUs (Tiger Lake-H)
fps
UHD Graphics Xe 16EUs (Tiger Lake-H):
13 [X] Gigabyte G5 GD Intel Core i5-11400H 2.7GHz
UHD Graphics Xe 16EUs (Tiger Lake-H)
min:
10 fps, max:
16 fps
fps
UHD Graphics Xe 16EUs (Tiger Lake-H):
19 [X] Gigabyte G5 GD Intel Core i5-11400H 2.7GHz
UHD Graphics Xe 16EUs (Tiger Lake-H)
min:
4.45 fps, P0.1:
5.75 fps, P1:
7.32 fps, max:
305 fps
fps
UHD Graphics Xe 16EUs (Tiger Lake-H):
9.3 [X] Gigabyte G5 GD Intel Core i5-11400H 2.7GHz
UHD Graphics Xe 16EUs (Tiger Lake-H)
min:
3.84 fps, P0.1:
3.9 fps, P1:
4.21 fps, max:
206 fps
fps
UHD Graphics Xe 16EUs (Tiger Lake-H):
21.7 [X] Gigabyte G5 GD Intel Core i5-11400H 2.7GHz
UHD Graphics Xe 16EUs (Tiger Lake-H)
min:
9.01 fps, P0.1:
9.46 fps, P1:
18.7 fps, max:
132 fps
fps
UHD Graphics Xe 16EUs (Tiger Lake-H):
34 36.6 [X] Gigabyte G5 GD 815237
Intel Core i5-11400H 2.7GHz
UHD Graphics Xe 16EUs (Tiger Lake-H)
min:
29 fps, P1:
29 fps, max:
44 fps
~ 35 fps
UHD Graphics Xe 16EUs (Tiger Lake-H):
14.7 [X] Gigabyte G5 GD 815237
Intel Core i5-11400H 2.7GHz
UHD Graphics Xe 16EUs (Tiger Lake-H)
min:
12 fps, P1:
12 fps, max:
16 fps
fps
UHD Graphics Xe 16EUs (Tiger Lake-H):
11.9 [X] Gigabyte G5 GD 815237
Intel Core i5-11400H 2.7GHz
UHD Graphics Xe 16EUs (Tiger Lake-H)
min:
10 fps, P1:
10 fps, max:
13 fps
fps
UHD Graphics Xe 16EUs (Tiger Lake-H):
48.9 [X] Gigabyte G5 GD Intel Core i5-11400H 2.7GHz
UHD Graphics Xe 16EUs (Tiger Lake-H)
min:
36.8 fps, P0.1:
36.9 fps, P1:
38.5 fps, max:
65.9 fps
fps
UHD Graphics Xe 16EUs (Tiger Lake-H):
25.1 [X] Gigabyte G5 GD Intel Core i5-11400H 2.7GHz
UHD Graphics Xe 16EUs (Tiger Lake-H)
min:
20.8 fps, P0.1:
20.9 fps, P1:
21.7 fps, max:
31 fps
fps
UHD Graphics Xe 16EUs (Tiger Lake-H):
21 [X] Gigabyte G5 GD Intel Core i5-11400H 2.7GHz
UHD Graphics Xe 16EUs (Tiger Lake-H)
min:
17.5 fps, P0.1:
17.7 fps, P1:
18.4 fps, max:
24.9 fps
fps
UHD Graphics Xe 16EUs (Tiger Lake-H):
13 [X] Gigabyte G5 GD Intel Core i5-11400H 2.7GHz
UHD Graphics Xe 16EUs (Tiger Lake-H)
min:
5.84 fps, P0.1:
6.1 fps, P1:
8.93 fps, max:
93.1 fps
fps
UHD Graphics Xe 16EUs (Tiger Lake-H):
22 [X] Gigabyte G5 GD Intel Core i5-11400H 2.7GHz
UHD Graphics Xe 16EUs (Tiger Lake-H)
min:
6.25 fps, P0.1:
7.03 fps, P1:
8.53 fps, max:
119 fps
fps
UHD Graphics Xe 16EUs (Tiger Lake-H):
13 [X] Gigabyte G5 GD Intel Core i5-11400H 2.7GHz
UHD Graphics Xe 16EUs (Tiger Lake-H)
min:
2.97 fps, P0.1:
3.13 fps, P1:
4.72 fps, max:
151 fps
fps
UHD Graphics Xe 16EUs (Tiger Lake-H):
22.7 [X] Gigabyte G5 GD Intel Core i5-11400H 2.7GHz
UHD Graphics Xe 16EUs (Tiger Lake-H)
fps
UHD Graphics Xe 16EUs (Tiger Lake-H):
13 [X] Gigabyte G5 GD Intel Core i5-11400H 2.7GHz
UHD Graphics Xe 16EUs (Tiger Lake-H)
min:
7 fps, max:
26 fps
fps
UHD Graphics Xe 16EUs (Tiger Lake-H):
15.6 [X] Lenovo ThinkBook 15p G2 ITH 21B1000WGE Intel Core i5-11400H 2.7GHz
UHD Graphics Xe 16EUs (Tiger Lake-H)
min:
5.02 fps, P0.1:
6.08 fps, P1:
8.36 fps, max:
53 fps
fps
UHD Graphics Xe 16EUs (Tiger Lake-H):
12 [X] Gigabyte G5 GD Intel Core i5-11400H 2.7GHz
UHD Graphics Xe 16EUs (Tiger Lake-H)
min:
9 fps, max:
69 fps
fps
UHD Graphics Xe 16EUs (Tiger Lake-H):
14.3 [X] Gigabyte G5 GD Intel Core i5-11400H 2.7GHz
UHD Graphics Xe 16EUs (Tiger Lake-H)
min:
10.7 fps, P0.1:
11.2 fps, P1:
12.3 fps, max:
17.5 fps
fps
UHD Graphics Xe 16EUs (Tiger Lake-H):
8 [X] Gigabyte G5 GD Intel Core i5-11400H 2.7GHz
UHD Graphics Xe 16EUs (Tiger Lake-H)
min:
5.8 fps, P0.1:
6.2 fps, P1:
6.4 fps, max:
10 fps
fps
UHD Graphics Xe 16EUs (Tiger Lake-H):
12.3 [X] Gigabyte G5 GD Intel Core i5-11400H 2.7GHz
UHD Graphics Xe 16EUs (Tiger Lake-H)
min:
6.21 fps, P1:
9.53 fps, max:
15.79 fps
fps
UHD Graphics Xe 16EUs (Tiger Lake-H):
6.2 [X] Gigabyte G5 GD Intel Core i5-11400H 2.7GHz
UHD Graphics Xe 16EUs (Tiger Lake-H)
min:
2.95 fps, P1:
4.72 fps, max:
8 fps
fps
UHD Graphics Xe 16EUs (Tiger Lake-H):
44.1 [X] Gigabyte G5 GD Intel Core i5-11400H 2.7GHz
UHD Graphics Xe 16EUs (Tiger Lake-H)
min:
22.6 fps, P0.1:
23.6 fps, P1:
25.6 fps, max:
129 fps
fps
UHD Graphics Xe 16EUs (Tiger Lake-H):
17.1 [X] Gigabyte G5 GD Intel Core i5-11400H 2.7GHz
UHD Graphics Xe 16EUs (Tiger Lake-H)
min:
8.62 fps, P0.1:
8.67 fps, P1:
9.69 fps, max:
85.9 fps
fps
UHD Graphics Xe 16EUs (Tiger Lake-H):
14.8 [X] Gigabyte G5 GD Intel Core i5-11400H 2.7GHz
UHD Graphics Xe 16EUs (Tiger Lake-H)
min:
7.22 fps, P0.1:
7.36 fps, P1:
8.21 fps, max:
149 fps
fps
UHD Graphics Xe 16EUs (Tiger Lake-H):
13.7 [X] Gigabyte G5 GD Intel Core i5-11400H 2.7GHz
UHD Graphics Xe 16EUs (Tiger Lake-H)
min:
6.66 fps, P0.1:
6.73 fps, P1:
7.63 fps, max:
150 fps
fps
UHD Graphics Xe 16EUs (Tiger Lake-H):
33.7 [X] Gigabyte G5 GD Intel Core i5-11400H 2.7GHz
UHD Graphics Xe 16EUs (Tiger Lake-H)
min:
10.4 fps, P0.1:
12 fps, P1:
22.2 fps, max:
157 fps
fps
UHD Graphics Xe 16EUs (Tiger Lake-H):
6.1 [X] Gigabyte G5 GD Intel Core i5-11400H 2.7GHz
UHD Graphics Xe 16EUs (Tiger Lake-H)
min:
1.062 fps, P0.1:
1.283 fps, P1:
2.34 fps, max:
91.2 fps
fps
UHD Graphics Xe 16EUs (Tiger Lake-H):
27.2 [X] Lenovo ThinkBook 15p G2 ITH 21B1000WGE Intel Core i5-11400H 2.7GHz
UHD Graphics Xe 16EUs (Tiger Lake-H)
min:
11.9 fps, P0.1:
12.3 fps, P1:
13 fps, max:
188.5 fps
27.2 [X] Lenovo ThinkBook 15p G2 ITH 21B1000WGE Intel Core i5-11400H 2.7GHz
UHD Graphics Xe 16EUs (Tiger Lake-H)
min:
11.9 fps, P0.1:
12.3 fps, P1:
13 fps, max:
188.5 fps
~ 27 fps
UHD Graphics Xe 16EUs (Tiger Lake-H):
11.4 [X] Lenovo ThinkBook 15p G2 ITH 21B1000WGE Intel Core i5-11400H 2.7GHz
UHD Graphics Xe 16EUs (Tiger Lake-H)
min:
5.54 fps, P0.1:
5.54 fps, P1:
5.9 fps, max:
151.3 fps
11.4 [X] Lenovo ThinkBook 15p G2 ITH 21B1000WGE Intel Core i5-11400H 2.7GHz
UHD Graphics Xe 16EUs (Tiger Lake-H)
min:
5.54 fps, P0.1:
5.54 fps, P1:
5.9 fps, max:
151.3 fps
~ 11 fps
UHD Graphics Xe 16EUs (Tiger Lake-H):
9.9 [X] Lenovo ThinkBook 15p G2 ITH 21B1000WGE Intel Core i5-11400H 2.7GHz
UHD Graphics Xe 16EUs (Tiger Lake-H)
min:
7.44 fps, P0.1:
7.55 fps, P1:
8.12 fps, max:
10.5 fps
fps
UHD Graphics Xe 16EUs (Tiger Lake-H):
14 [X] Gigabyte G5 GD Intel Core i5-11400H 2.7GHz
UHD Graphics Xe 16EUs (Tiger Lake-H)
min:
8 fps, max:
20 fps
fps
UHD Graphics Xe 16EUs (Tiger Lake-H):
7 [X] Gigabyte G5 GD Intel Core i5-11400H 2.7GHz
UHD Graphics Xe 16EUs (Tiger Lake-H)
min:
4 fps, max:
9 fps
fps
UHD Graphics Xe 16EUs (Tiger Lake-H):
15.8 [X] Gigabyte G5 GD Intel Core i5-11400H 2.7GHz
UHD Graphics Xe 16EUs (Tiger Lake-H)
min:
12.9 fps, P0.1:
13 fps, P1:
13.4 fps, max:
28.4 fps
fps
UHD Graphics Xe 16EUs (Tiger Lake-H):
8.4 [X] Gigabyte G5 GD Intel Core i5-11400H 2.7GHz
UHD Graphics Xe 16EUs (Tiger Lake-H)
min:
7.27 fps, P0.1:
7.3 fps, P1:
7.56 fps, max:
9.59 fps
fps
UHD Graphics Xe 16EUs (Tiger Lake-H):
26 fps
UHD Graphics Xe 16EUs (Tiger Lake-H):
12 fps
UHD Graphics Xe 16EUs (Tiger Lake-H):
38.2 [X] Gigabyte G5 GD Intel Core i5-11400H 2.7GHz
UHD Graphics Xe 16EUs (Tiger Lake-H)
fps
UHD Graphics Xe 16EUs (Tiger Lake-H):
12.8 [X] Gigabyte G5 GD Intel Core i5-11400H 2.7GHz
UHD Graphics Xe 16EUs (Tiger Lake-H)
fps
UHD Graphics Xe 16EUs (Tiger Lake-H):
7.8 [X] Gigabyte G5 GD Intel Core i5-11400H 2.7GHz
UHD Graphics Xe 16EUs (Tiger Lake-H)
fps
UHD Graphics Xe 16EUs (Tiger Lake-H):
17.1 [X] Lenovo ThinkBook 15p G2 ITH 21B1000WGE Intel Core i5-11400H 2.7GHz
UHD Graphics Xe 16EUs (Tiger Lake-H)
min:
12.8 fps, P0.1:
12.9 fps, P1:
13.2 fps, max:
20.6 fps
fps
UHD Graphics Xe 16EUs (Tiger Lake-H):
8.1 [X] Lenovo ThinkBook 15p G2 ITH 21B1000WGE Intel Core i5-11400H 2.7GHz
UHD Graphics Xe 16EUs (Tiger Lake-H)
min:
6.35 fps, P0.1:
6.35 fps, P1:
6.43 fps, max:
9.62 fps
fps
UHD Graphics Xe 16EUs (Tiger Lake-H):
13.4 14.4 [X] Gigabyte G5 GD Intel Core i5-11400H 2.7GHz
UHD Graphics Xe 16EUs (Tiger Lake-H)
~ 14 fps
100%
M2 Max 38-Core GPU:
72 fps
8%
UHD Graphics Xe 16EUs (Tiger Lake-H):
5.8 fps
100%
M2 Max 38-Core GPU:
60.2 fps
5%
UHD Graphics Xe 16EUs (Tiger Lake-H):
3.3 fps
100%
M2 Max 38-Core GPU:
48.6 fps
UHD Graphics Xe 16EUs (Tiger Lake-H):
15.4 [X] Lenovo ThinkBook 15p G2 ITH 21B1000WGE Intel Core i5-11400H 2.7GHz
UHD Graphics Xe 16EUs (Tiger Lake-H)
min:
5.42 fps, P0.1:
6.05 fps, P1:
9.93 fps, max:
84.5 fps
fps
UHD Graphics Xe 16EUs (Tiger Lake-H):
4.8 [X] Lenovo ThinkBook 15p G2 ITH 21B1000WGE Intel Core i5-11400H 2.7GHz
UHD Graphics Xe 16EUs (Tiger Lake-H)
min:
2.68 fps, P0.1:
2.69 fps, P1:
2.78 fps, max:
23.3 fps
fps
100%
M2 Max 38-Core GPU:
330 fps
100%
M2 Max 38-Core GPU:
147 fps
100%
M2 Max 38-Core GPU:
96 fps
100%
M2 Max 38-Core GPU:
71 fps
100%
M2 Max 38-Core GPU:
47 fps
UHD Graphics Xe 16EUs (Tiger Lake-H):
25.5 [X] Gigabyte G5 GD Intel Core i5-11400H 2.7GHz
UHD Graphics Xe 16EUs (Tiger Lake-H)
min:
14.3 fps, P0.1:
14.7 fps, P1:
17.7 fps, max:
41.1 fps
fps
UHD Graphics Xe 16EUs (Tiger Lake-H):
7.9 [X] Gigabyte G5 GD Intel Core i5-11400H 2.7GHz
UHD Graphics Xe 16EUs (Tiger Lake-H)
min:
4.73 fps, P0.1:
4.9 fps, P1:
6.04 fps, max:
14.7 fps
fps
UHD Graphics Xe 16EUs (Tiger Lake-H):
15 [X] Blackview MP200 Intel Core i5-11400H 2.7GHz
UHD Graphics Xe 16EUs (Tiger Lake-H)
min:
11 fps, max:
19 fps
fps
UHD Graphics Xe 16EUs (Tiger Lake-H):
7 [X] Blackview MP200 Intel Core i5-11400H 2.7GHz
UHD Graphics Xe 16EUs (Tiger Lake-H)
min:
6 fps, max:
9 fps
fps
UHD Graphics Xe 16EUs (Tiger Lake-H):
7 [X] Blackview MP200 Intel Core i5-11400H 2.7GHz
UHD Graphics Xe 16EUs (Tiger Lake-H)
min:
5 fps, max:
9 fps
fps
UHD Graphics Xe 16EUs (Tiger Lake-H):
6 [X] Blackview MP200 Intel Core i5-11400H 2.7GHz
UHD Graphics Xe 16EUs (Tiger Lake-H)
min:
5 fps, max:
8 fps
fps
UHD Graphics Xe 16EUs (Tiger Lake-H):
28.4 [X] Gigabyte G5 GD Intel Core i5-11400H 2.7GHz
UHD Graphics Xe 16EUs (Tiger Lake-H)
min:
12.8 fps, P0.1:
13.2 fps, P1:
21.7 fps, max:
96.3 fps
fps
UHD Graphics Xe 16EUs (Tiger Lake-H):
10.4 [X] Gigabyte G5 GD Intel Core i5-11400H 2.7GHz
UHD Graphics Xe 16EUs (Tiger Lake-H)
min:
9.04 fps, P0.1:
9.04 fps, P1:
9.07 fps, max:
15.2 fps
fps
100%
M2 Max 38-Core GPU:
182 fps
9%
UHD Graphics Xe 16EUs (Tiger Lake-H):
15.8 fps
43%
M2 10-Core GPU:
60 76 102 ~ 79 fps
100%
M2 Max 38-Core GPU:
131 fps
5%
UHD Graphics Xe 16EUs (Tiger Lake-H):
6.7 fps
100%
M2 Max 38-Core GPU:
122 fps
100%
M2 Max 38-Core GPU:
109 fps
100%
M2 Max 38-Core GPU:
78 fps
26%
M2 10-Core GPU:
20 fps
UHD Graphics Xe 16EUs (Tiger Lake-H):
31 31.5 [X] Blackview MP200 1.47.22.14 D3D12
Intel Core i5-11400H 2.7GHz
UHD Graphics Xe 16EUs (Tiger Lake-H)
min:
7.3 fps, P1:
9.39 fps, max:
338 fps
33.9 [X] Gigabyte G5 GD 1.47.22.14 D3D12
Intel Core i5-11400H 2.7GHz
UHD Graphics Xe 16EUs (Tiger Lake-H)
min:
7.7 fps, P1:
10.7 fps, max:
467 fps
~ 32 fps
UHD Graphics Xe 16EUs (Tiger Lake-H):
11.7 [X] Blackview MP200 1.47.22.14 D3D12
Intel Core i5-11400H 2.7GHz
UHD Graphics Xe 16EUs (Tiger Lake-H)
min:
5 fps, P1:
5 fps, max:
282 fps
12 12.3 [X] Gigabyte G5 GD 1.47.22.14 D3D12
Intel Core i5-11400H 2.7GHz
UHD Graphics Xe 16EUs (Tiger Lake-H)
min:
5 fps, P1:
5.03 fps, max:
298 fps
~ 12 fps
UHD Graphics Xe 16EUs (Tiger Lake-H):
10.9 [X] Gigabyte G5 GD 1.47.22.14 D3D12
Intel Core i5-11400H 2.7GHz
UHD Graphics Xe 16EUs (Tiger Lake-H)
min:
5 fps, P1:
5 fps, max:
362 fps
11 11.9 [X] Blackview MP200 1.47.22.14 D3D12
Intel Core i5-11400H 2.7GHz
UHD Graphics Xe 16EUs (Tiger Lake-H)
min:
5 fps, P1:
5 fps, max:
294 fps
~ 11 fps
UHD Graphics Xe 16EUs (Tiger Lake-H):
7 13.8 [X] Gigabyte G5 GD 1.47.22.14 D3D12
Intel Core i5-11400H 2.7GHz
UHD Graphics Xe 16EUs (Tiger Lake-H)
min:
5 fps, P1:
5 fps, max:
423 fps
15 [X] Blackview MP200 1.47.22.14 D3D12
Intel Core i5-11400H 2.7GHz
UHD Graphics Xe 16EUs (Tiger Lake-H)
min:
5 fps, P1:
5 fps, max:
320 fps
~ 12 fps
UHD Graphics Xe 16EUs (Tiger Lake-H):
16 [X] Blackview MP200 Intel Core i5-11400H 2.7GHz
UHD Graphics Xe 16EUs (Tiger Lake-H)
min:
14 fps, max:
19 fps
18 [X] Gigabyte G5 GD Intel Core i5-11400H 2.7GHz
UHD Graphics Xe 16EUs (Tiger Lake-H)
min:
15 fps, max:
21 fps
~ 17 fps
UHD Graphics Xe 16EUs (Tiger Lake-H):
7 [X] Blackview MP200 Intel Core i5-11400H 2.7GHz
UHD Graphics Xe 16EUs (Tiger Lake-H)
min:
6 fps, max:
9 fps
8 [X] Gigabyte G5 GD Intel Core i5-11400H 2.7GHz
UHD Graphics Xe 16EUs (Tiger Lake-H)
min:
6 fps, max:
10 fps
~ 8 fps
UHD Graphics Xe 16EUs (Tiger Lake-H):
7 [X] Blackview MP200 Intel Core i5-11400H 2.7GHz
UHD Graphics Xe 16EUs (Tiger Lake-H)
min:
6 fps, max:
8 fps
fps
UHD Graphics Xe 16EUs (Tiger Lake-H):
14.7 18.4 18.8 [X] Gigabyte G5 GD Intel Core i5-11400H 2.7GHz
UHD Graphics Xe 16EUs (Tiger Lake-H)
29.1 ~ 20 fps
UHD Graphics Xe 16EUs (Tiger Lake-H):
10.1 14.8 [X] Gigabyte G5 GD Intel Core i5-11400H 2.7GHz
UHD Graphics Xe 16EUs (Tiger Lake-H)
16.8 17.2 ~ 15 fps
UHD Graphics Xe 16EUs (Tiger Lake-H):
8.9 13.7 [X] Gigabyte G5 GD Intel Core i5-11400H 2.7GHz
UHD Graphics Xe 16EUs (Tiger Lake-H)
15.4 15.8 ~ 13 fps
UHD Graphics Xe 16EUs (Tiger Lake-H):
12.1 14 14.6 14.9 [X] Gigabyte G5 GD 1.3
Intel Core i5-11400H 2.7GHz
UHD Graphics Xe 16EUs (Tiger Lake-H)
~ 14 fps
UHD Graphics Xe 16EUs (Tiger Lake-H):
5.8 6.6 6.9 ~ 6 fps
UHD Graphics Xe 16EUs (Tiger Lake-H):
4.2 4.7 4.8 ~ 5 fps
UHD Graphics Xe 16EUs (Tiger Lake-H):
53.2 98.7 [X] Blackview MP200 Intel Core i5-11400H 2.7GHz
UHD Graphics Xe 16EUs (Tiger Lake-H)
min:
85.5 fps, max:
-1 fps
108 114 [X] Gigabyte G5 GD Intel Core i5-11400H 2.7GHz
UHD Graphics Xe 16EUs (Tiger Lake-H)
min:
92.2 fps, max:
-1 fps
~ 93 fps
UHD Graphics Xe 16EUs (Tiger Lake-H):
37.6 53.7 [X] Blackview MP200 Intel Core i5-11400H 2.7GHz
UHD Graphics Xe 16EUs (Tiger Lake-H)
min:
47.9 fps, max:
-1 fps
57 58.1 [X] Gigabyte G5 GD Intel Core i5-11400H 2.7GHz
UHD Graphics Xe 16EUs (Tiger Lake-H)
min:
51.9 fps, max:
-1 fps
~ 52 fps
UHD Graphics Xe 16EUs (Tiger Lake-H):
18.5 22.6 [X] Blackview MP200 Intel Core i5-11400H 2.7GHz
UHD Graphics Xe 16EUs (Tiger Lake-H)
min:
20.6 fps, max:
-1 fps
23.1 23.8 [X] Gigabyte G5 GD Intel Core i5-11400H 2.7GHz
UHD Graphics Xe 16EUs (Tiger Lake-H)
min:
21.7 fps, max:
-1 fps
~ 22 fps
UHD Graphics Xe 16EUs (Tiger Lake-H):
17.1 20.9 [X] Blackview MP200 Intel Core i5-11400H 2.7GHz
UHD Graphics Xe 16EUs (Tiger Lake-H)
min:
19 fps, max:
-1 fps
21.5 22 [X] Gigabyte G5 GD Intel Core i5-11400H 2.7GHz
UHD Graphics Xe 16EUs (Tiger Lake-H)
min:
19.9 fps, max:
-1 fps
~ 20 fps
UHD Graphics Xe 16EUs (Tiger Lake-H):
24.5 27 ~ 26 fps
UHD Graphics Xe 16EUs (Tiger Lake-H):
17 fps
100%
M2 Max 38-Core GPU:
83 fps
11%
UHD Graphics Xe 16EUs (Tiger Lake-H):
8.3 9 ~ 9 fps
41%
M2 10-Core GPU:
34 fps
100%
M2 Max 38-Core GPU:
76 fps
7%
UHD Graphics Xe 16EUs (Tiger Lake-H):
5 fps
37%
M2 10-Core GPU:
28 fps
100%
M2 Max 38-Core GPU:
84 fps
73%
UHD Graphics Xe 16EUs (Tiger Lake-H):
59.3 [X] Blackview MP200 Intel Core i5-11400H 2.7GHz
UHD Graphics Xe 16EUs (Tiger Lake-H)
min:
9.5 fps, P1:
33.3 fps, max:
110.9 fps
62.8 ~ 61 fps
100%
M2 Max 38-Core GPU:
81 fps
59%
UHD Graphics Xe 16EUs (Tiger Lake-H):
46.9 [X] Blackview MP200 Intel Core i5-11400H 2.7GHz
UHD Graphics Xe 16EUs (Tiger Lake-H)
min:
11.4 fps, P1:
27 fps, max:
188.7 fps
50 ~ 48 fps
100%
M2 Max 38-Core GPU:
57 fps
16%
UHD Graphics Xe 16EUs (Tiger Lake-H):
8.6 [X] Blackview MP200 Intel Core i5-11400H 2.7GHz
UHD Graphics Xe 16EUs (Tiger Lake-H)
min:
3.34 fps, P1:
6.21 fps, max:
247 fps
9.2 ~ 9 fps
UHD Graphics Xe 16EUs (Tiger Lake-H):
3.5 [X] Blackview MP200 Intel Core i5-11400H 2.7GHz
UHD Graphics Xe 16EUs (Tiger Lake-H)
min:
1.639 fps, P1:
2.12 fps, max:
21.2 fps
3.6 [X] Blackview MP200 Intel Core i5-11400H 2.7GHz
UHD Graphics Xe 16EUs (Tiger Lake-H)
min:
1.706 fps, P1:
2.11 fps, max:
17.5 fps
~ 4 fps
Average Gaming Apple M2 Max 38-Core GPU → 100% Average Gaming 30-70 fps → 100%
Average Gaming Intel UHD Graphics Xe 16EUs (Tiger Lake-H) → 21% Average Gaming 30-70 fps → 66%
Average Gaming Apple M2 10-Core GPU → 33% Average Gaming 30-70 fps → 34%
Apple M2 Max 38-Core GPU low med. high ultra QHD 4K Borderlands 3 72 60.2 48.6 Total War: Three Kingdoms 330 147 96 71 47 Shadow of the Tomb Raider 182 131 122 109 78 The Witcher 3 83 76 GTA V 84 81 57 < 30 fps < 60 fps < 120 fps ≥ 120 fps 1 2 2 2 1 3 1 1 3 1 1
For more games that might be playable and a list of all games and graphics cards visit our Gaming List
v1.28
log 04. 06:26:04
#0 checking url part for id 11574 +0s ... 0s
#1 checking url part for id 10941 +0s ... 0s
#2 checking url part for id 11368 +0s ... 0s
#3 redirected to Ajax server, took 1720067164 +0s ... 0s
#4 did not recreate cache, as it is less than 5 days old! Created at Thu, 04 Jul 2024 05:15:44 +0200 +0s ... 0s
#5 composed specs +0.03s ... 0.03s
#6 did output specs +0s ... 0.03s
#7 start showIntegratedCPUs +0s ... 0.03s
#8 getting avg benchmarks for device 11574 +0.019s ... 0.05s
#9 got single benchmarks 11574 +0.004s ... 0.054s
#10 getting avg benchmarks for device 10941 +0.002s ... 0.057s
#11 got single benchmarks 10941 +0.002s ... 0.058s
#12 getting avg benchmarks for device 11368 +0s ... 0.059s
#13 got single benchmarks 11368 +0.008s ... 0.067s
#14 got avg benchmarks for devices +0s ... 0.067s
#15 min, max, avg, median took s +0.032s ... 0.098s
#16 before gaming benchmark output +0s ... 0.098s
#17 Got 269 rows for game benchmarks. +0.019s ... 0.117s
#18 composed SQL query for gamebenchmarks +0s ... 0.117s
#19 got data and put it in $dataArray +0.003s ... 0.12s
#20 benchmarks composed for output. +0.024s ... 0.145s
#21 calculated avg scores. +0s ... 0.145s
#22 return log +0.001s ... 0.145s
Please share our article, every link counts!
Redaktion, 2017-09- 8 (Update: 2023-07- 1)
 Deutsch
 English
 Español
 Français
 Italiano
 Nederlands
 Polski
 Português
 Русский
 Türkçe
 Svenska
 Chinese
 Magyar