Notebookcheck Logo

Apple M2 Max 30-Core GPU vs AMD Radeon RX 7900M vs Apple M2 Pro 16-Core GPU

Apple M2 Max 30-Core GPU

► remove from comparison Apple M2 Max 30-Core GPU

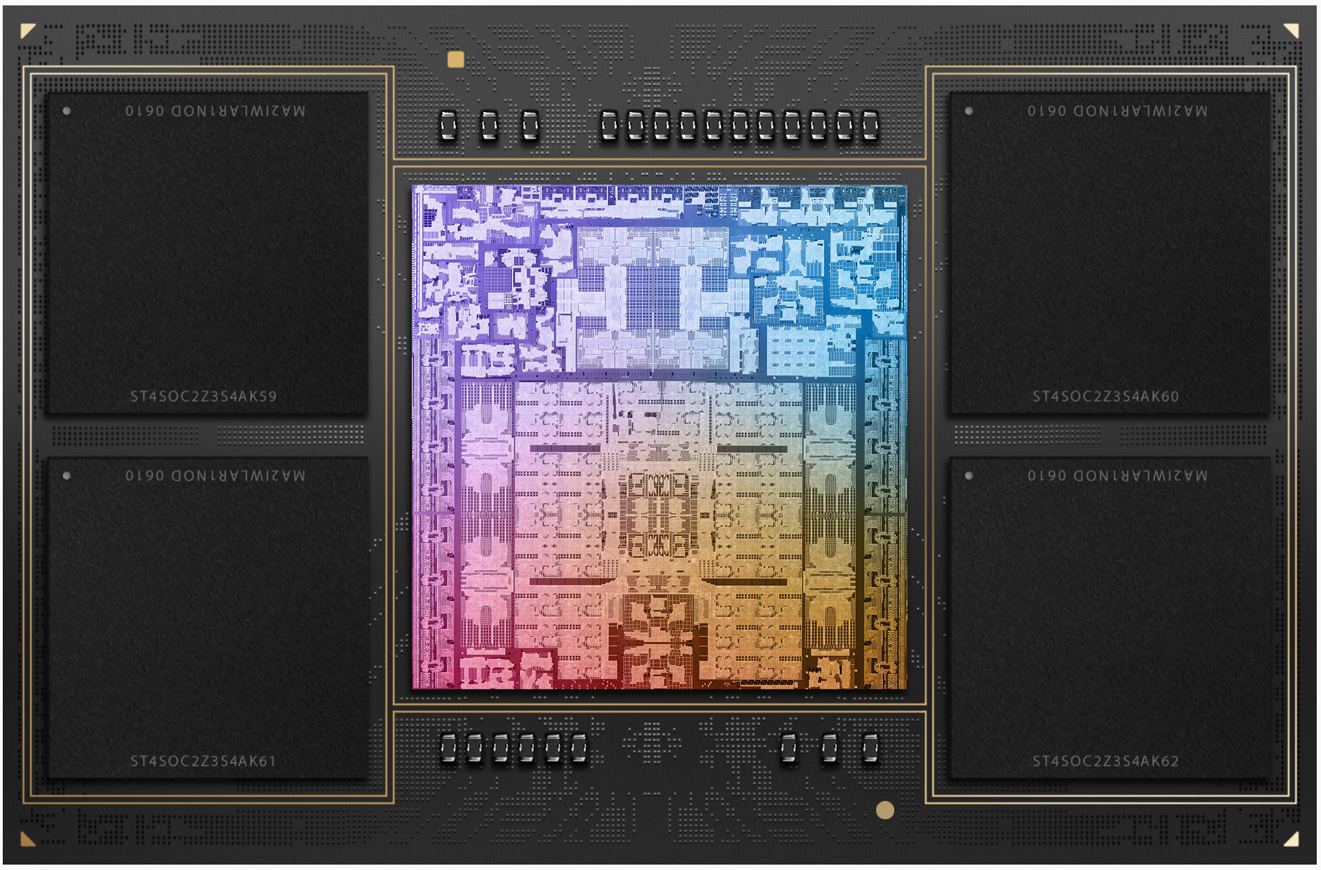
The Apple M2 Max 30-Core-GPU is an integrated graphics card by Apple offering 30 of the 38 cores in the M2 Max Chip.

The graphics card has no dedicated graphics memory but can use the fast LPDDR5-6400 unified memory with a 512 bit bus (up to 400 GBit/s).

The GPU is intended to use Apple Metal 2 API and could still be based on the older PowerVR architectures (last used in the Apple A10). A new feature in the MacBook Pro 14 and 16 of 2023 is the support for HDMI 2.1 and 8k output.

The Apple M2 Pro is manufactured in the second generation 5nm process at TSMC.

AMD Radeon RX 7900M

► remove from comparison AMD Radeon RX 7900M

The AMD Radeon RX 7900M is a mobile upper high-end graphics card based on the Navi 31 chip (RDNA 3 architecture) manufactured in 5nm. It features 4,608 cores (72 CUs - compute units) and 16 GB of fast GDDR6 graphics memory connected with a 256 Bit memory bus. The chip also includes 64 MB Infinity Cache. The clock speed of the cores will depend on the laptop according to AMD. The specified game clock speed is 1825 MHz (most likely at 180 W TGP). 

AMD compares the performance to the mobile RTX 4080 and shows a number of games where the 7900M is on average 7% faster. Raytracing is supported in hardware, but usually slower than the Nvidia counterpart. Nvidia also has the advantage of DLSS support in selected games.

The Navi 31 chip is manufactured at TSMC in the current 5nm process. The power consumption (TGP) is specified at 160 to 180 Watt (200 Watt including SmartShift from the CPU).

Apple M2 Pro 16-Core GPU

► remove from comparison Apple M2 Pro 16-Core GPU

The Apple M2 Pro 16-Core-GPU is an integrated graphics card by Apple offering all 16 of the 19 cores in the M2 Pro 10-Core Chip.

The graphics card has no dedicated graphics memory but can use the fast LPDDR5-6400 unified memory with a 256 bit bus (up to 200 GBit/s).

According to Apple, the performance of the 19-core-GPU should be 30% higher than the old 16-core-GPU in the M1 Pro. Therefore, the cut down 16-core version should still beat the old full-featured 16-core M1 Pro slightly and the old 14-core more clearly.

The GPU is intended to use Apple Metal 2 API and could still be based on the older PowerVR architectures (last used in the Apple A10). A new feature in the MacBook Pro 14 of 2023 is the support for HDMI 2.1 and 8k output.

The Apple M2 Pro is manufactured in the second generation 5nm process at TSMC.

Apple M2 Max 30-Core GPUAMD Radeon RX 7900MApple M2 Pro 16-Core GPU
Apple M2 Series
M2 Max 38-Core GPU 38
M2 Max 30-Core GPU 30
M2 Pro 19-Core GPU 19 @ 0.44 - 1.4 GHz
M2 Pro 16-Core GPU 16
M2 10-Core GPU 10 @ 1.4 GHz
M2 8-Core GPU 8 @ 1.4 GHz
Radeon RX 7900M 4608 @ 1.83 - 2.09 GHz256 Bit @ 18000 MHz
Radeon RX 7600M XT 2048 @ 2.3 GHz128 Bit @ 18000 MHz
Radeon RX 7700S 2048 @ 2.2 GHz128 Bit @ 18000 MHz
Radeon RX 7600M 1792 @ 2.07 GHz128 Bit @ 16000 MHz
Radeon RX 7600S 1792 @ 1.87 GHz128 Bit @ 16000 MHz
M2 Max 38-Core GPU 38
M2 Max 30-Core GPU 30
M2 Pro 19-Core GPU 19 @ 0.44 - 1.4 GHz
M2 Pro 16-Core GPU 16
M2 10-Core GPU 10 @ 1.4 GHz
M2 8-Core GPU 8 @ 1.4 GHz
Pipelines30 - unified4608 - unified16 - unified
Memory TypeLPDDR5-6400GDDR6LPDDR5-6400
Shared Memorynonono
technology5 nm5 nm5 nm
Notebook Sizemedium sizedlargemedium sized
Date of Announcement17.01.2023 19.10.2023 17.01.2023
CodenameNavi 31
ArchitectureRDNA 3
ROPs192
Core Speed1825 - 2090 (Boost) MHz
Theoretical Performance77.05 TFLOPS FP16, 38.52 TFLOPS FP32
CacheL3: 64 MB
Memory Speed18000 MHz
Memory Bus Width256 Bit
Max. Amount of Memory16 GB
Memory Bandwidth576 GB/s
APIDirectX 12_2, Shader 6.7, OpenGL 4.6, OpenCL 2.2, Vulkan 1.3
Power Consumption180 Watt (160 - 200 Watt TGP)
Transistors53.9 Billion
Link to Manufacturer Pagewww.amd.com
CPU in M2 Pro 16-Core GPUGPU Base SpeedGPU Boost / Turbo
Apple M2 Pro 10-Core10 x 2424 MHz? MHz? MHz

Benchmarks

3DMark - 3DMark Time Spy Score
18114 Points (52%)
3DMark - 3DMark Time Spy Graphics
19434 Points (51%)
3DMark - 3DMark Fire Strike Standard Score
40123 Points (71%)
3DMark - 3DMark Fire Strike Standard Graphics
50241 Points (57%)
3DMark - 3DMark Wild Life Extreme Unlimited
20692 Points (24%)
11224 Points (13%)
3DMark 11 - 3DM11 Performance Score
41670 Points (58%)
3DMark 11 - 3DM11 Performance GPU
59943 Points (52%)
Blender - Blender 3.3 Classroom METAL *
83 Seconds (9%)
132 Seconds (14%)
Cinebench R15
Cinebench R15 OpenGL 64 Bit + Apple M2 Max 30-Core GPU
Cinebench R15 - Cinebench R15 OpenGL 64 Bit
145.7 fps (9%)
Cinebench R15 OpenGL 64 Bit + AMD Radeon RX 7900M
369 fps (22%)
Cinebench R15 OpenGL 64 Bit + Apple M2 Pro 16-Core GPU
141.9 fps (8%)
Cinebench R15 OpenGL Ref. Match 64 Bit + Apple M2 Max 30-Core GPU
Cinebench R15 - Cinebench R15 OpenGL Ref. Match 64 Bit
99.5 % (100%)
Cinebench R15 OpenGL Ref. Match 64 Bit + AMD Radeon RX 7900M
97.9 % (98%)
Cinebench R15 OpenGL Ref. Match 64 Bit + Apple M2 Pro 16-Core GPU
99.5 % (100%)
GFXBench - GFXBench 5.0 4K Aztec Ruins High Tier Offscreen
145.3 fps (59%)
78.7 fps (32%)
GFXBench - GFXBench 5.0 Aztec Ruins High Tier Offscreen
326.1 fps (59%)
181.1 fps (33%)
GFXBench - GFXBench 5.0 Aztec Ruins Normal Tier Offscreen
853 fps (63%)
493 fps (37%)
GFXBench - GFXBench Car Chase Offscreen
585 fps (66%)
389 fps (44%)
GFXBench 3.1 - GFXBench Manhattan ES 3.1 Offscreen
659 fps (14%)
GFXBench 3.0 - GFXBench 3.0 Manhattan Offscreen
1011 fps (59%)
GFXBench (DX / GLBenchmark) 2.7
GFXBench T-Rex HD Offscreen C24Z16 + Apple M2 Pro 16-Core GPU
GFXBench (DX / GLBenchmark) 2.7 - GFXBench T-Rex HD Offscreen C24Z16
1815 fps (14%)
Basemark GPU 1.2 - Basemark GPU 1.2 Vulkan Official Medium Offscreen 1080
104.6 fps (1%)
Basemark GPU 1.2 - Basemark GPU 1.2 Vulkan Official High Offscreen 2160
3.6 fps (1%)
Geekbench 6.2 - Geekbench 6.2 GPU OpenCL
74601 Points (22%)
140024 Points (41%)
Geekbench 6.2 - Geekbench 6.2 GPU Vulkan
138222 Points (45%)
Geekbench 6.2 - Geekbench 6.2 GPU Metal
126173 Points (81%)
Power Consumption - Furmark Stress Test Power Consumption - external Monitor *
313 Watt (44%)
Power Consumption - The Witcher 3 Power Consumption - external Monitor *
83.7 Watt (12%)
167 Watt (23%)
47.8 Watt (7%)
Power Consumption - Witcher 3 Power Consumption *
216 Watt (47%)
46.6 Watt (10%)
Power Consumption - Witcher 3 ultra Power Efficiency
1 fps per Watt (87%)
Power Consumption - Witcher 3 ultra Power Efficiency - external Monitor
0.9 fps per Watt (78%)
Emissions Witcher 3 Fan Noise + AMD Radeon RX 7900M
Emissions - Witcher 3 Fan Noise
53.6 dB(A) (86%)

Average Benchmarks Apple M2 Max 30-Core GPU → 100% n=2

Average Benchmarks AMD Radeon RX 7900M → 176% n=2

Average Benchmarks Apple M2 Pro 16-Core GPU → 99% n=2

- Range of benchmark values for this graphics card
- Average benchmark values for this graphics card
* Smaller numbers mean a higher performance
1 This benchmark is not used for the average calculation

Game Benchmarks

The following benchmarks stem from our benchmarks of review laptops. The performance depends on the used graphics memory, clock rate, processor, system settings, drivers, and operating systems. So the results don't have to be representative for all laptops with this GPU. For detailed information on the benchmark results, click on the fps number.

Alan Wake 2

Alan Wake 2

2023
high 1920x1080
Radeon RX 7900M:
104.8  fps
QHD 2560x1440
Radeon RX 7900M:
71.7  fps
4K 3840x2160
Radeon RX 7900M:
37.3  fps
Cyberpunk 2077 2.1 Phantom Liberty

Cyberpunk 2077 2.1 Phantom Liberty

2023
high 1920x1080
Radeon RX 7900M:
130.7  fps
ultra 1920x1080
Radeon RX 7900M:
129.6  fps
QHD 2560x1440
Radeon RX 7900M:
85.2  fps
4K 3840x2160
Radeon RX 7900M:
37.7  fps
high 1920x1080
Radeon RX 7900M:
152.4  fps
ultra 1920x1080
Radeon RX 7900M:
152.6  fps
QHD 2560x1440
Radeon RX 7900M:
118.5  fps
4K 3840x2160
Radeon RX 7900M:
65.8  fps
ultra 1920x1080
Radeon RX 7900M:
86.2  fps
QHD 2560x1440
Radeon RX 7900M:
83.6  fps
4K 3840x2160
Radeon RX 7900M:
54.8  fps
F1 22

F1 22

2022
high 1920x1080
Radeon RX 7900M:
296  fps
ultra 1920x1080
Radeon RX 7900M:
102.8  fps
QHD 2560x1440
Radeon RX 7900M:
69.3  fps
4K 3840x2160
Radeon RX 7900M:
36.1  fps
ultra 1920x1080
Radeon RX 7900M:
150.2  fps
QHD 2560x1440
Radeon RX 7900M:
106.8  fps
4K 3840x2160
Radeon RX 7900M:
56  fps
ultra 1920x1080
Radeon RX 7900M:
135  fps
QHD 2560x1440
Radeon RX 7900M:
93.3  fps
4K 3840x2160
Radeon RX 7900M:
44.3  fps
low 1280x720
M2 Pro 16-Core GPU:
80.8  fps
med. 1920x1080
M2 Pro 16-Core GPU:
52  fps
high 1920x1080
100%
M2 Max 30-Core GPU:
53.2  fps
71%
M2 Pro 16-Core GPU:
38  fps
ultra 1920x1080
100%
M2 Max 30-Core GPU:
45.2  fps
64%
M2 Pro 16-Core GPU:
28.9  fps
QHD 2560x1440
100%
M2 Max 30-Core GPU:
35.1  fps
low 1280x720
M2 Pro 16-Core GPU:
258  fps
med. 1920x1080
M2 Pro 16-Core GPU:
75  fps
high 1920x1080
100%
M2 Max 30-Core GPU:
91  fps
53%
M2 Pro 16-Core GPU:
48  fps
ultra 1920x1080
100%
M2 Max 30-Core GPU:
65  fps
55%
M2 Pro 16-Core GPU:
36  fps
QHD 2560x1440
100%
M2 Max 30-Core GPU:
41.4  fps
53%
M2 Pro 16-Core GPU:
22  fps
low 1280x720
M2 Pro 16-Core GPU:
159  fps
med. 1920x1080
M2 Pro 16-Core GPU:
72  fps
high 1920x1080
100%
M2 Max 30-Core GPU:
115  fps
180%
Radeon RX 7900M:
207  fps
57%
M2 Pro 16-Core GPU:
65  fps
ultra 1920x1080
100%
M2 Max 30-Core GPU:
102  fps
194%
Radeon RX 7900M:
198  fps
56%
M2 Pro 16-Core GPU:
57  fps
QHD 2560x1440
100%
M2 Max 30-Core GPU:
69  fps
201%
Radeon RX 7900M:
139  fps
52%
M2 Pro 16-Core GPU:
36  fps
4K 3840x2160
Radeon RX 7900M:
76  fps
Strange Brigade

Strange Brigade

2018
ultra 1920x1080
Radeon RX 7900M:
344  fps
QHD 2560x1440
Radeon RX 7900M:
249  fps
4K 3840x2160
Radeon RX 7900M:
130.5  fps
Far Cry 5

Far Cry 5

2018
ultra 1920x1080
Radeon RX 7900M:
128  fps
QHD 2560x1440
Radeon RX 7900M:
123  fps
4K 3840x2160
Radeon RX 7900M:
103  fps
high 1920x1080
Radeon RX 7900M:
83.7  fps
4K 3840x2160
Radeon RX 7900M:
64.3  fps
high 1920x1080
Radeon RX 7900M:
152.8  fps
QHD 2560x1440
Radeon RX 7900M:
114.6  fps
4K 3840x2160
Radeon RX 7900M:
69.3  fps
high 1920x1080
Radeon RX 7900M:
162.8  fps
ultra 1920x1080
Radeon RX 7900M:
146.2  fps
4K 3840x2160
Radeon RX 7900M:
122.5  fps
high 1920x1080
M2 Pro 16-Core GPU:
51  fps
ultra 1920x1080
Radeon RX 7900M:
167.7  fps
M2 Pro 16-Core GPU:
45  fps
4K 3840x2160
Radeon RX 7900M:
116  fps
GTA V

GTA V

2015
low 1024x768
M2 Pro 16-Core GPU:
76  fps
med. 1366x768
M2 Pro 16-Core GPU:
73  fps
high 1920x1080
Radeon RX 7900M:
172.9  fps
M2 Pro 16-Core GPU:
46  fps
ultra 1920x1080
Radeon RX 7900M:
105  fps
QHD 2560x1440
Radeon RX 7900M:
105.6  fps
4K 3840x2160
Radeon RX 7900M:
146  fps

Average Gaming Apple M2 Max 30-Core GPU → 100%

Average Gaming 30-70 fps → 100%

Average Gaming AMD Radeon RX 7900M → 192%

Average Gaming Apple M2 Pro 16-Core GPU → 58%

Average Gaming 30-70 fps → 57%

AMD Radeon RX 7900Mlowmed.highultraQHD4K
Alan Wake 2104.871.737.3
Cyberpunk 2077 2.1 Phantom Liberty130.7129.685.237.7
Baldur's Gate 3152.4152.6118.565.8
Ratchet & Clank Rift Apart86.283.654.8
F1 22296102.869.336.1
Tiny Tina's Wonderlands150.2106.856
Cyberpunk 2077 1.613593.344.3
Shadow of the Tomb Raider20719813976
Strange Brigade344249130.5
Far Cry 5128123103
X-Plane 11.1183.764.3
Final Fantasy XV Benchmark152.8114.669.3
Dota 2 Reborn162.8146.2122.5
The Witcher 3167.7116
GTA V172.9105105.6146
< 30 fps
< 60 fps
< 120 fps
≥ 120 fps


2
7


3
9


9
3

6
6
3
Apple M2 Pro 16-Core GPUlowmed.highultraQHD4K
Borderlands 380.8523828.9
Total War: Three Kingdoms25875483622
Shadow of the Tomb Raider15972655736
The Witcher 35145
GTA V767346
< 30 fps
< 60 fps
< 120 fps
≥ 120 fps


2
2

1
3

4
1
1
3

1
1


Apple M2 Max 30-Core GPUlowmed.highultraQHD4K
Borderlands 353.245.235.1
Total War: Three Kingdoms916541.4
Shadow of the Tomb Raider11510269
< 30 fps
< 60 fps
< 120 fps
≥ 120 fps


1
2

1
2

2
1


For more games that might be playable and a list of all games and graphics cards visit our Gaming List

v1.28
log 27. 20:55:16

#0 checking url part for id 11572 +0s ... 0s

#1 checking url part for id 11620 +0s ... 0s

#2 checking url part for id 11570 +0s ... 0s

#3 redirected to Ajax server, took 1719514515 +0s ... 0s

#4 did not recreate cache, as it is less than 5 days old! Created at Tue, 25 Jun 2024 05:15:40 +0200 +0s ... 0s

#5 composed specs +0.054s ... 0.055s

#6 did output specs +0s ... 0.055s

#7 start showIntegratedCPUs +0s ... 0.055s

#8 getting avg benchmarks for device 11572 +0.027s ... 0.081s

#9 got single benchmarks 11572 +0.004s ... 0.085s

#10 getting avg benchmarks for device 11620 +0s ... 0.085s

#11 got single benchmarks 11620 +0.004s ... 0.089s

#12 getting avg benchmarks for device 11570 +0s ... 0.089s

#13 got single benchmarks 11570 +0.004s ... 0.093s

#14 got avg benchmarks for devices +0s ... 0.093s

#15 min, max, avg, median took s +0.017s ... 0.11s

#16 before gaming benchmark output +0s ... 0.11s

#17 Got 76 rows for game benchmarks. +0.006s ... 0.116s

#18 composed SQL query for gamebenchmarks +0s ... 0.116s

#19 got data and put it in $dataArray +0.001s ... 0.117s

#20 benchmarks composed for output. +0.006s ... 0.123s

#21 calculated avg scores. +0s ... 0.123s

#22 return log +0s ... 0.123s

Please share our article, every link counts!
> Expert Reviews and News on Laptops, Smartphones and Tech Innovations > Benchmarks / Tech > Graphics Card Comparison - Head 2 Head
Redaktion, 2017-09- 8 (Update: 2023-07- 1)