 Deutsch
 English
 Español
 Français
 Italiano
 Nederlands
 Polski
 Português
 Русский
 Türkçe
 Svenska
 Chinese
 Magyar
Apple M2 8-Core GPU vs NVIDIA RTX A4500 Laptop GPU
Apple M2 8-Core GPU
► remove from comparison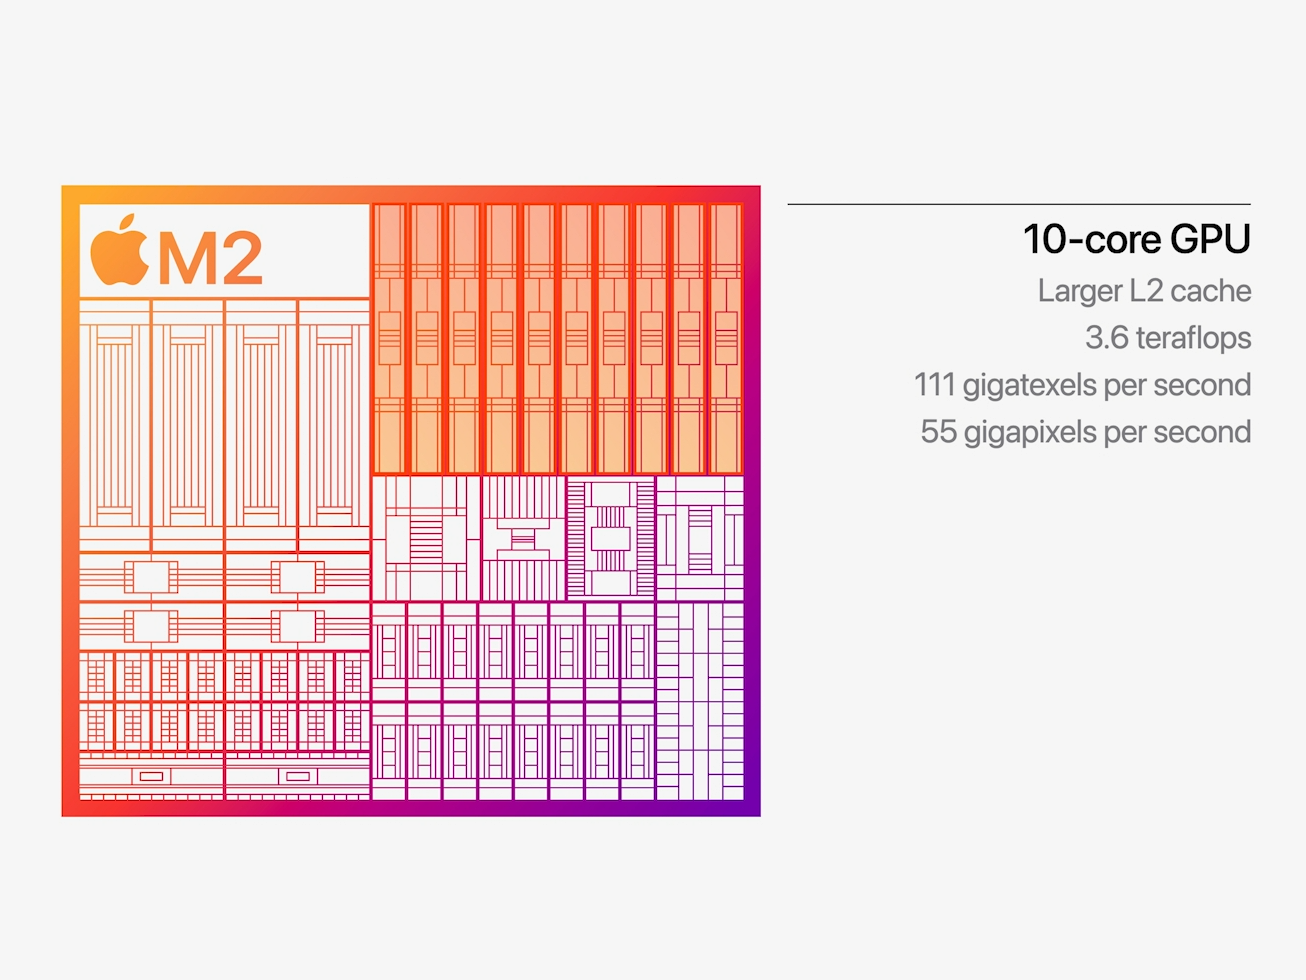
The Apple M2 8-core GPU is an integrated graphics card offering 8 of the 10 cores designed by Apple and integrated in the Apple M2 SoC. It uses the unified memory architecture of the M2 SoC (up to 24 GB LPDDR5-6400 with 100 GB/s bandwidth) and should offer 128 execution units.
The performance is positioned right between the old 8-core model in the M1 GPU and the higher end 10-core model in the M2. The theoretical performance should be around 2.9 Teraflops, as the 8-core version offers the same 1,398 MHz maximum clock rate as the 10-core version. Compared to other iGPUs from AMD and Intel, the M2 benefits greatly from the unified memory architecture and the high bandwidth.
The M2 chip is manufactured in the second generation 5nm process at TSMC (most likely N5P). The power consumption is around 10 Watt (in our tests under load of the MBP13) compared to the 13.5W of the 10-core version.
NVIDIA RTX A4500 Laptop GPU
► remove from comparison
The NVIDIA RTX A4500 Laptop GPU or A4500 Mobile is a professional graphics card for mobile workstations. It is based on the GA104 Ampere chip and similar to the consumer GeForce RTX 3070 Ti Laptop GPU. It offers 5,888 graphics cores, 46 RT cores, 184 Tensor cores and up to 16 GB GDDR6 graphics memory with a 256 Bit memory bus. It supports PCIe 4.0 and will be available in different variants from 80 to 140 Watt (TGP) with different clock speeds (and performance). The GPU supports eDP 1.4b to connect the internal monitor and DisplayPort 1.4 and HDMI 2.1 for external connections.
There is no more Max-Q variant (formerly used for the low power variants) but every OEM can choose to implement Max-Q technologies (Dynamic Boost, WhisperMode).
The raw performance should be similar to the GeForce RTX 3070 Ti laptop at the same TGP level. Both GPUs depend heavily on good cooling and a high TGP for good performance. At a similar power consumption level the RTX A4500 should be clearly faster than the old RTX A4000 and Quadro RTX 4000. The desktop variant of the A4500 however, is a lot faster.
The GA104 chip offers 6,144 FP32 ALUs of which half can also execute INT32 instructions (i.e. 3,072 INT32 ALUs). With Ampere all shaders could still execute FP32 or INT32 instructions. The raytracing and tensor cores on the chip were also improved according to Nvidia. The A4400 only uses 5,888 of the 6,144 CUDA cores. The Ampere chips also include an improved 5th generation video encoder (NVENC for H.264 and H.265) and a 7th generation decoder (for various formats now including AV1).
The GA104 chip is manufactured by Samsung in 8nm (8N), which is not quite able to keep up with the 7nm node at TSMC (e.g. used by AMD and also for the professional GA100 Ampere chip).
| Apple M2 8-Core GPU | NVIDIA RTX A4500 Laptop GPU | |||||||||||||||||||||||||||||||||||||||||||
| RTX A Series |
|
| ||||||||||||||||||||||||||||||||||||||||||
| Pipelines | 8 - unified | 5888 - unified | ||||||||||||||||||||||||||||||||||||||||||
| Core Speed | 1398 (Boost) MHz | 930 - 1500 (Boost) MHz | ||||||||||||||||||||||||||||||||||||||||||
| Memory Type | LPDDR5-6400 | GDDR6 | ||||||||||||||||||||||||||||||||||||||||||
| Shared Memory | no | no | ||||||||||||||||||||||||||||||||||||||||||
| Power Consumption | 10 Watt | 140 Watt (80 - 140 Watt TGP) | ||||||||||||||||||||||||||||||||||||||||||
| technology | 5 nm | 8 nm | ||||||||||||||||||||||||||||||||||||||||||
| Date of Announcement | 06.06.2022 | 30.03.2022 | ||||||||||||||||||||||||||||||||||||||||||
| Predecessor | M1 8-Core GPU | RTX A4000 Laptop GPU | ||||||||||||||||||||||||||||||||||||||||||
| Codename | GA104 | |||||||||||||||||||||||||||||||||||||||||||
| Architecture | Ampere | |||||||||||||||||||||||||||||||||||||||||||
| TMUs | 184 | |||||||||||||||||||||||||||||||||||||||||||
| ROPs | 96 | |||||||||||||||||||||||||||||||||||||||||||
| Raytracing Cores | 46 | |||||||||||||||||||||||||||||||||||||||||||
| Tensor / AI Cores | 127 | |||||||||||||||||||||||||||||||||||||||||||
| Theoretical Performance | 18.5 TFLOPS FP32 | |||||||||||||||||||||||||||||||||||||||||||
| Cache | L2: 4 MB | |||||||||||||||||||||||||||||||||||||||||||
| Memory Speed | 16000 effective = 2000 MHz | |||||||||||||||||||||||||||||||||||||||||||
| Memory Bus Width | 256 Bit | |||||||||||||||||||||||||||||||||||||||||||
| Max. Amount of Memory | 16 GB | |||||||||||||||||||||||||||||||||||||||||||
| Memory Bandwidth | 512 GB/s | |||||||||||||||||||||||||||||||||||||||||||
| API | DirectX 12_2, Shader 6.7, OpenGL 4.6, OpenCL 3.0, Vulkan 1.3 | |||||||||||||||||||||||||||||||||||||||||||
| PCIe | 4.0 x16 | |||||||||||||||||||||||||||||||||||||||||||
| Features | DisplayPort 1.4, HDMI 2.1, PCIe 4.0 x16, 17.8 SP-FP TFLOPS Peak, 143 Tensor Performance Peak, up to 384 GB/s Memory Bandwidth, Resizable BAR, Support for Modern Standby | |||||||||||||||||||||||||||||||||||||||||||
| Notebook Size | large | |||||||||||||||||||||||||||||||||||||||||||
| Link to Manufacturer Page | nvdam.widen.net |


